
Research article · 2026 · Full text
International Journal of Geography Geology and EnvironmentSpatio-temporal analysis of Thoubal River morphodynamics and its relationship with land use/land cover changes, flood hazards and anthropogenic activities, Manipur, India
Volume 8(8) · Pages 157–166 · DOI: 10.22271/27067483.2026.v8.i8b.858 ↗
Research areasHydrology and Sediment Transport ProcessesFlood Risk Assessment and ManagementCoastal and Marine Dynamics
Abstract
Author-writtenRiver systems are dynamic geomorphic environments whose channel form and behavior respond to variations in discharge, sediment supply, rainfall, vegetation cover, land-use change and human intervention. The Thoubal River, one of the important fluvial systems of Manipur, has experienced considerable changes in channel configuration and surrounding land use duringrecent decades. The present study investigates the spatio-temporal evolution of the Thoubal River between 1990 and 2024 and evaluates its relationship with Land Use/Land Cover (LULC) transformation, anthropogenic pressure, rainfall variability and flood hazards using remote sensing, Geographic Information System(GIS), digital elevation modelling and field verification. Multi-temporal Landsat imagery for 1990, 2000, 2010, 2020 and 2024 was analyzed for LULC classification and change detection. River-channel migration and erosion/deposition were assessed using multi-temporal channel boundaries and the Digital Shoreline Analysis System (DSAS) approach adapted to fluvial channel analysis. Channel length, mean width, sinuosity, braiding index and drainage density were calculated to quantify morphological change. A weighted multi-criteria approach incorporating rainfall, slope, elevation, and distance from the river, drainage density, LULC, and landform was used to prepare the 2024 flood hazard map. Anthropogenic pressure was evaluated using built-up expansion and spatial information on sand mining, urbanization, agricultural expansion, embankments, roads, bridges and waste disposal. The results indicate substantial morphological transformation of the Thoubal River. Total channel length increased from 77.64 km in 1990 to 79.13 km in 2024, while mean channel width increased from 162.3 to 228.7 m. Sinuosity increased from 1.36 to 1.72 and the braiding index increased from 0.28 to 0.49, indicating increasing channel complexity and lateral in stability. Built-up land expanded from 6,768 ha in1990to 20,543ha in 2024, whereas agricultural land and forest cover declined. Approximately66.13% of the analyzed area remained relatively stable with respect to erosion/deposition, while the remaining areas show substantial geomorphic activity. The upper reach recorded an average net migration rate of +1.38 m/year, the middle reach +0.72 m/year, and the lower reach -1.12 m/year. A strong positive relationship was observed between built-up expansion and net channel migration (r = 0.71, p < 0.01), while built-up area was also strongly correlated with flood hazard (r =0.75, p < 0.01). Mean rainfall increased from 1,702 mm during 1990-1999 to 2,146 mm during 2020-2024. The findings demonstrate that natural hydrological forcing and increasing anthropogenic pressure are jointly associated with morphodynamic change and flood vulnerability in the Thoubal River Basin. Integrated river-basin management, riparian-zone protection, regulation of sand mining and encroachment, floodplain zoning and continuous remote-sensing-based monitoring are recommended.
Summary
Source-checkedPlain-language reading of the full paper, prepared with AI and checked against the text. Each point links to the authors' own words.
Why it matters
- River systems are dynamic environments where channel form and behavior are influenced by factors such as rainfall, sediment supply, and human activities. View evidence ↗
- Morphological changes in rivers can lead to significant socioeconomic and environmental impacts, especially in densely populated floodplains. View evidence ↗
The question
- The study aims to investigate the spatio-temporal evolution of the Thoubal River from 1990 to 2024 and its relationship with land use changes, human pressure, rainfall, and flood hazards. View evidence ↗
What they did
- The researchers analyzed multi-temporal Landsat imagery from 1990, 2000, 2010, 2020, and 2024 to classify land use/land cover (LULC) and detect changes. View evidence ↗
- A 2024 flood hazard map was created using a weighted multi-criteria approach that included parameters like rainfall, slope, elevation, and distance from the river. View evidence ↗
- The study used a supervised Random Forest algorithm to classify the basin into six LULC categories: waterbody, forest, agriculture, built-up, barrenland, and others. View evidence ↗
What they found
- Between 1990 and 2024, the Thoubal River's total channel length grew from 77.64 km to 79.13 km, and its mean width increased from 162.3 m to 228.7 m. View evidence ↗
- The river's sinuosity rose from 1.36 to 1.72 and the braiding index increased from 0.28 to 0.49, suggesting greater channel complexity and instability. View evidence ↗
- Net migration rates varied by reach: the upper reach was +1.38 m/year, the middle reach was +0.72 m/year, and the lower reach was -1.12 m/year. View evidence ↗
- There was a strong positive correlation between built-up expansion and both net channel migration (r = 0.71) and flood hazard (r = 0.75). View evidence ↗
- Mean annual rainfall increased from 1,702 mm in the 1990-1999 period to 2,146 mm in the 2020-2024 period. View evidence ↗
What it means
- The authors recommend integrated river-basin management, including riparian zone protection, regulation of sand mining, floodplain zoning, and continuous monitoring. View evidence ↗
- The 30 m spatial resolution of Landsat imagery limits the ability to detect very small-scale changes to the river banks. View evidence ↗
- The authors note that the observed statistical correlations do not establish direct causation. View evidence ↗
Visual summary
3 visualsIllustrations explain the paper; charts are replotted from the paper's own table values.
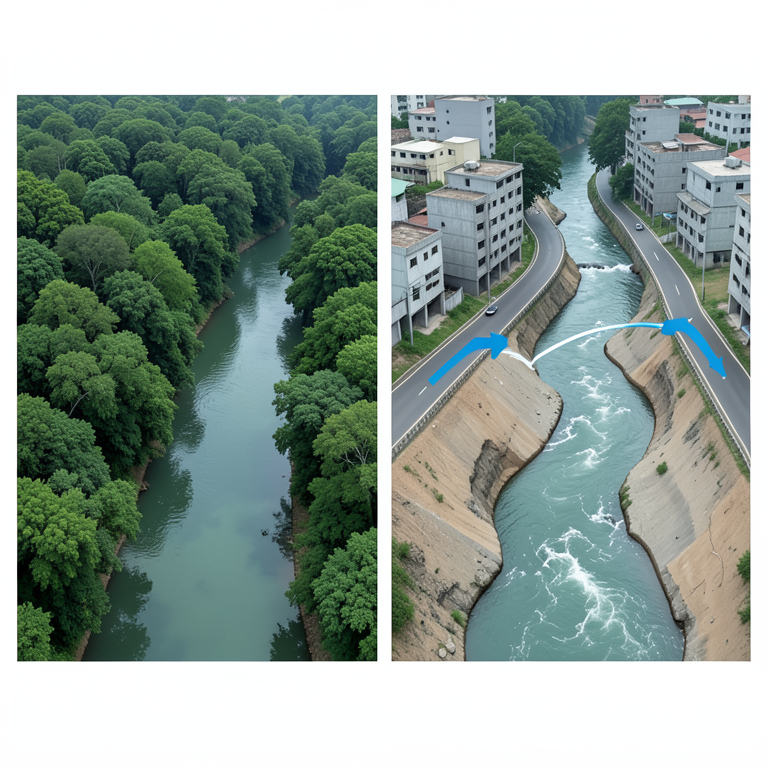
Urbanization and River Instability
AI-generated conceptual illustration (Thoubal River basin in Manipur, India). It explains the idea and does not show study data.
View source evidence ↗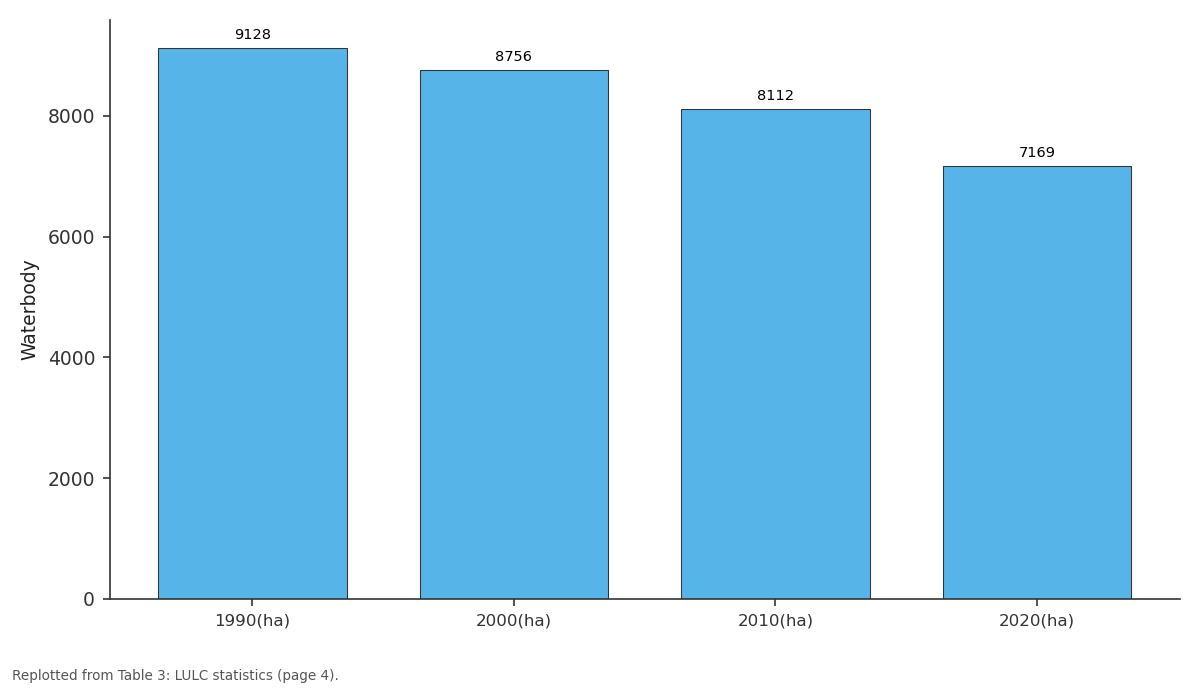
Waterbody: 1990(ha) vs 2000(ha) vs 2010(ha) vs 2020(ha)
Replotted from Table 3 (page 4) of the original paper. Every bar is the paper's own table value.
View source evidence ↗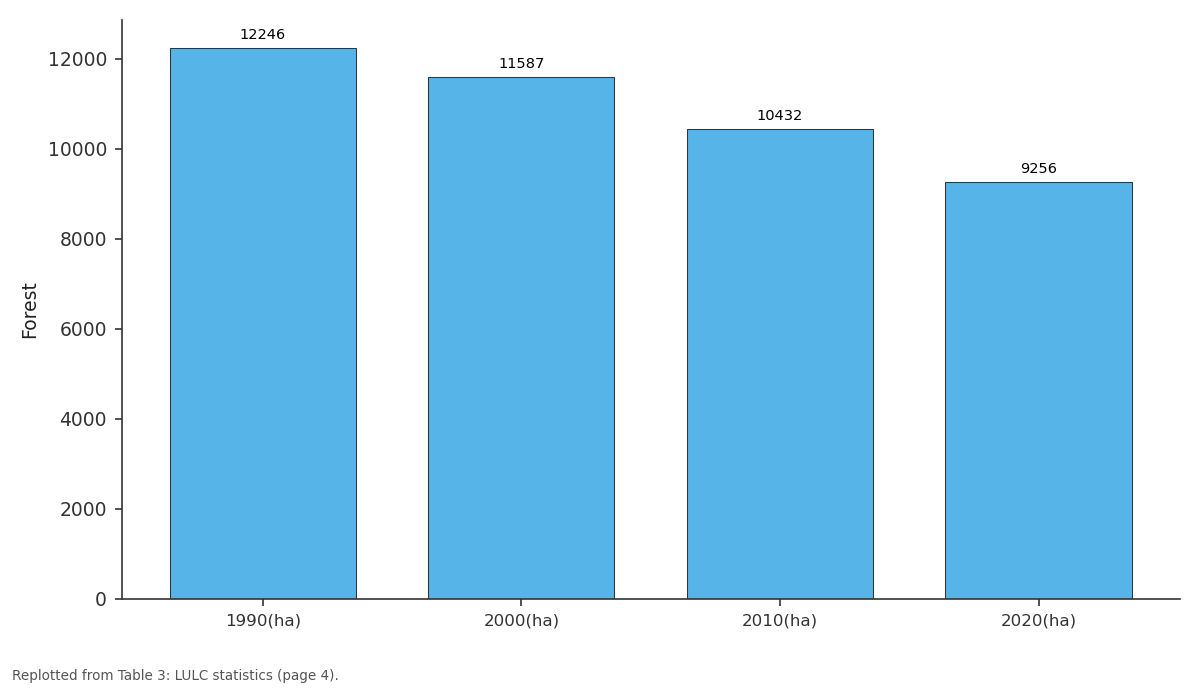
Forest: 1990(ha) vs 2000(ha) vs 2010(ha) vs 2020(ha)
Replotted from Table 3 (page 4) of the original paper. Every bar is the paper's own table value.
View source evidence ↗Figures & tables
From the original paper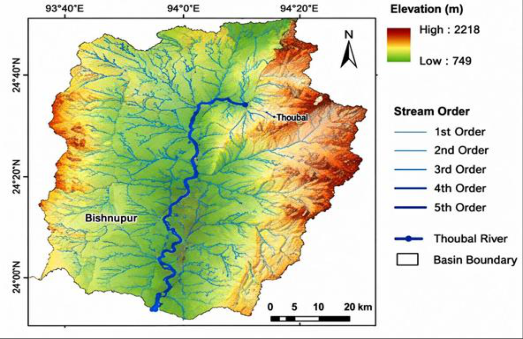 Figure 2Page 2
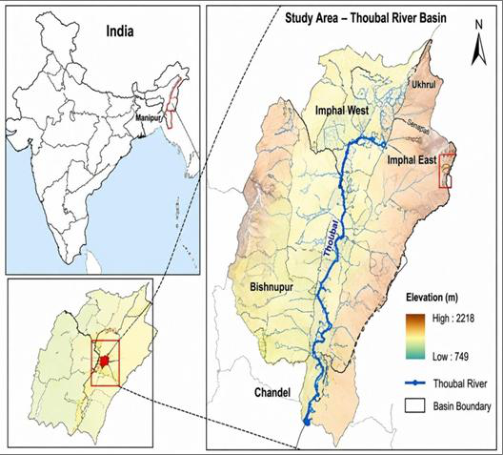 Figure 1Page 2
 Table 1Page 3
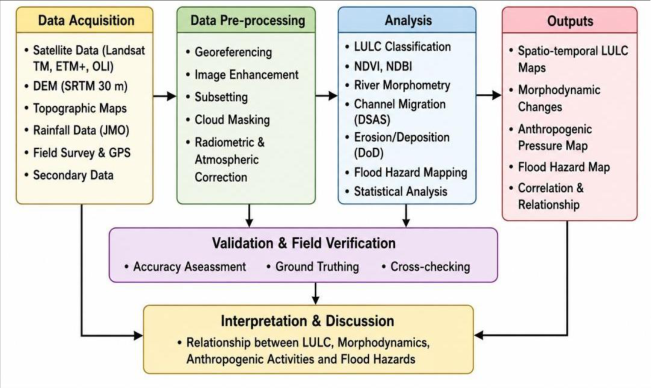 Figure 3Page 3
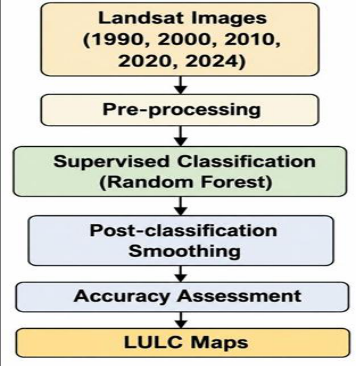 Figure 4Page 3
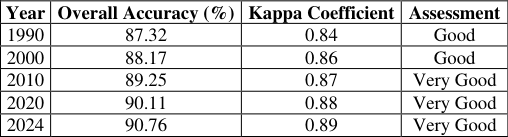 Table 2Page 4
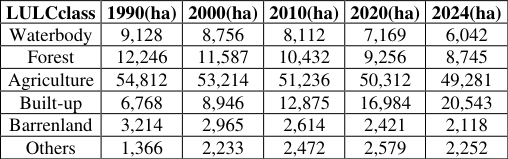 Table 3Page 4
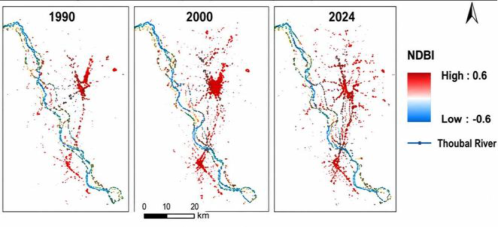 Figure 6Page 4
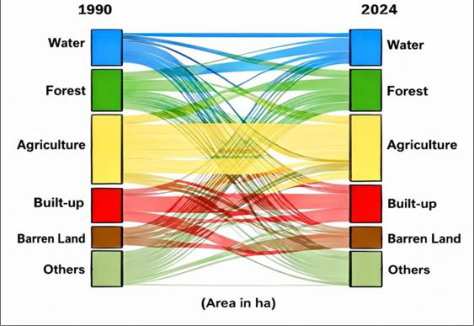 Figure 5Page 4
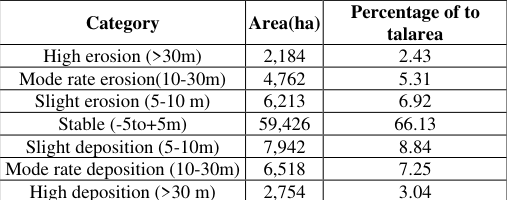 Table 5Page 5
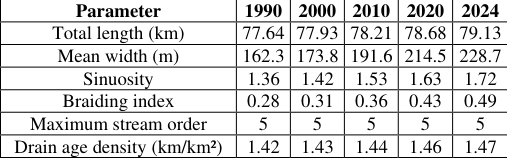 Table 4Page 5
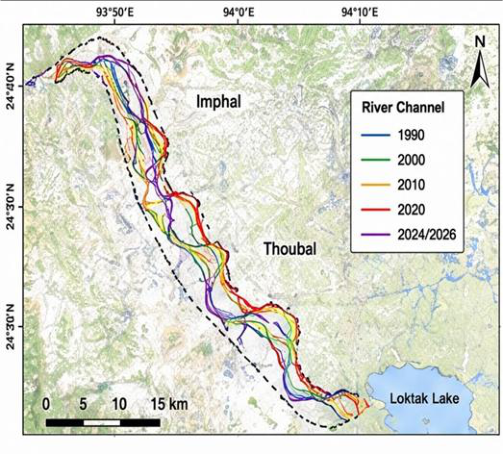 Figure 7Page 5
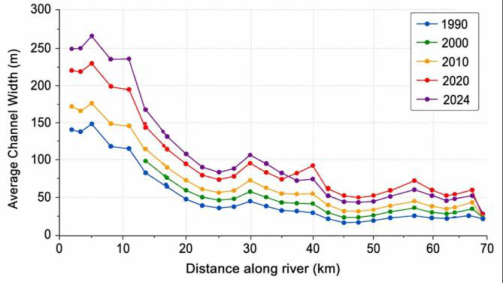 Figure 8Page 5
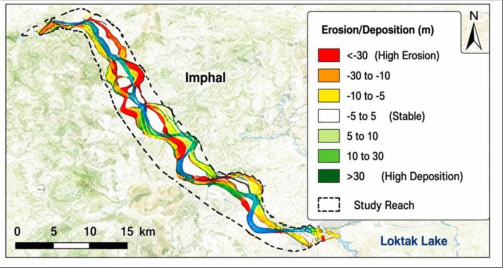 Figure 9Page 5
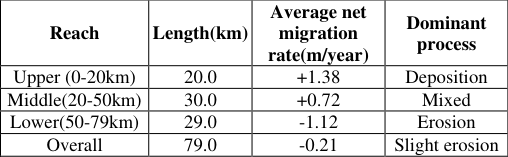 Table 6Page 6
 Table 7Page 6
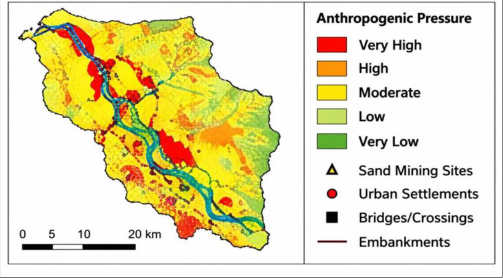 Figure 11Page 6
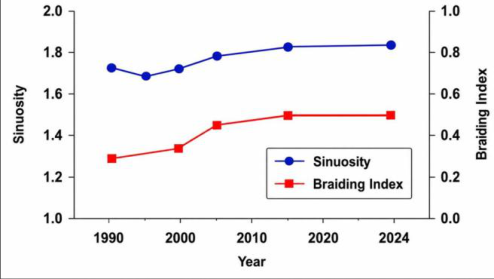 Figure 10Page 6
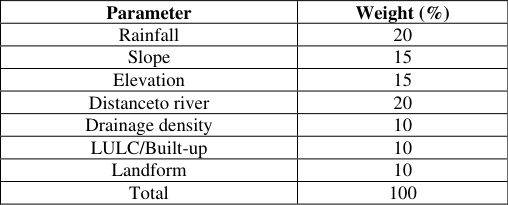 Table 8Page 7
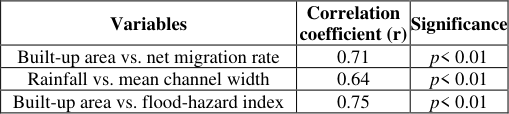 Table 10Page 7
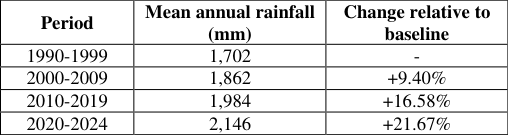 Table 9Page 7
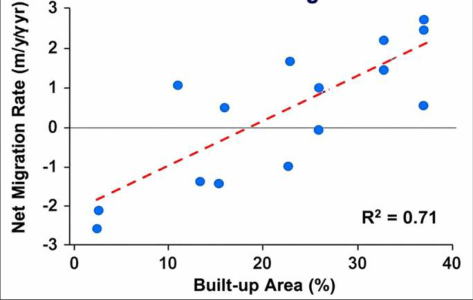 Figure 13Page 7
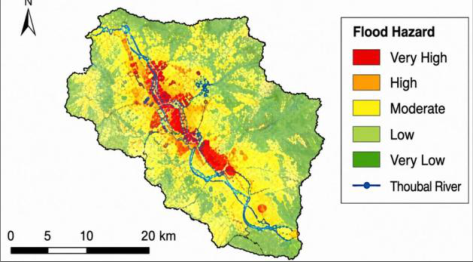 Figure 12Page 7
Introduction
Rivers are among the most dynamic components of the Earth's surface system. Their channels continuously adjust their plan form, width, depth, sinuosity and sediment distribution in response to variations in discharge, sediment load, valley slope, bank material, vegetation and human intervention.
Changes in river morphology can generate significant environmental and socioeconomic consequences, particularly in densely settled floodplains where agricultural land, roads, bridges and settlements are concentrated along river corridors. During the last several decades, rapid population growth, urban expansion, agricultural intensification, deforestation, sand extraction, riverbank modification and construction of embankments have altered many river systems throughout India. These anthropogenic activities modify run off generation, sediment availability, bank stability and flood conveyance capacity. At the same time, changes in rainfall intensity and seasonal precipitation associated with climatic variability may amplify the magnitude and frequency of floods. Remote sensing and GIS provide effective techniques for analysing river dynamics over long periods because historical satellite imagery permits reconstruction of channel positions and surrounding land-use patterns. Multi-temporal Landsat data are particularly useful because of their long temporal coverage and moderate spatial resolution. Integration of satellite-based LULC classification with river channel extraction, GIS-based morphometric analysis and flood hazard modelling provides an effective framework for understanding interactions between environmental change and river dynamics. The Thoubal River Basin of Manipur represents an important case for such an investigation. The river passes through areas experiencing agricultural development, urbanization and increasing infrastructure pressure. Changes in river channel position and width have implications for agriculture, settlements, roads, bridges, floodplain management and ecological stability. The present study therefore focuses on the spatial and temporal evolution of the Thoubal River from1990 to 2024 and examines the relationships between river morphodynamics, LULCchange, rainfall variability, anthropogenic activities and flood hazards. The Thoubal River Basin is situated in Manipur, northeastern India, and forms an important component of the drainage network of the Manipur Valley. The river drains a heterogeneous landscape comprising upland/hilly terrain, agricultural areas, settlements, forested regions and low-lying floodplains. Figure 1 shows the study-area setting and basin extent. The study-area map indicates an elevation range of approximately 749-2,218 m, reflecting considerable topographic variability within the basin. The river flows through the Thoubal region and ultimately contributes to the lowland drainage system associated with Loktak Lake.
Study area Location and physiographic setting
Study area Location and physiographic setting
Materials and Methods
Materials and Methods
Data sources
The overall analytical workflow is summarized in Figure 3.
The analysis was based mainly on multi-temporal satellite imagery, DEM data, topographic information, rainfall records and field observations. The images were projected into a common coordinate reference system to ensure accurate overlay and change detection.
LULC classification
A supervised classification approach using the Random Forest algorithm (Breiman, 2001) [2] was applied to classify the basin into the following principal land-use/land-cover classes:
1. Waterbody 2. Forest 3. Agriculture 4. Built-up 5. Barrenland 6. Others
Training samples were developed using satellite-image interpretation, ancillary maps and field observations. Postclassification smoothing and editing were performed to remove isolated pixels and improve thematic consistency. Figure 4 shows the classification framework shows the sequence from multi-temporal Landsat imagery through preprocessing and supervised Random Forest classification to post-classification smoothing, accuracyassessment and final LULC maps. This workflow provides the basis for the subsequent LULC change analysis.
Classification accuracy
The classification results showed overall accuracies ranging from 87.32% to 90.76%, with corresponding kappa coefficients of 0.84-0.89. The overall classification accuracies exceed 87%, indicating acceptable thematic performance for the subsequent changedetection analysis (Congalton & Green, 2019) [4] .
LULC change analysis
The LULC transition pattern is illustrated in Figure 5.The LULC results demonstrate substantial transformation of the Thoubal River Basin during 1990-2024. The most prominent change is the expansion of built-up land. Built-up area increased from 6,768 ha in 1990 to 20,543 ha in 2024, representing an increase of approximately 203.6%. Because the classified-area totals vary among observation years, the reported class areas should be interpreted as year-specific classified areas rather than as a perfectly constant-area accounting framework.
Built-up expansion and NDBI analysis
The Normalized Difference Built-up Index (NDBI) was used to identify spatial patterns of built-up expansion.
The spatial pattern of built-up expansion is shown in Figure 6. The NDBI results demonstrate a progressive concentration of built-up surfaces along major transportation corridors, settlements and river-adjacent areas. The spatial expansion is particularly evident between 2000 and 2024. The spatial coincidence between built-up expansion and zones of channel migration suggests an important anthropogenic association with contemporary river dynamics; however, the observed relationships should not be interpreted as proof of direct causation.
River-channel extraction and morphometric analysis
River-channel extraction and morphometric analysis
Multi-temporal channel migration
The channel positions for 1990, 2000, 2010, 2020 and 2024 were superimposed to identify zones of lateral migration.
The results indicate that channel movement is spatially heterogeneous. Some reaches exhibit substantial lateral displacement, whereas other sections remain relatively stable. The spatial pattern of erosion and deposition is shown in Figure 9. Approximately two-thirds of the basin remained within the stable category, whereas considerable portions experienced erosion or deposition.
Sinuosity and braiding
Figure 10 shows the temporal increase in sinuosity and braiding. The increasing sinuosity and braiding index provide important evidence of channel instability. Sinuosity increased from 1.36 in 1990 to 1.72 in 2024. This increase suggests enhanced lateral migration and development of bends.
Similarly, the braiding index increased from 0.28 to 0.49. Increased braiding may result from changes in sediment supply, bank erosion, channel widening, variable discharge and local human disturbances. The simultaneous increase in sinuosity, braiding and channel width indicates that the Thoubal River has become morphologically more complex during the study period.
Anthropogenic activities
The spatial distribution of anthropogenic pressure is shown in Figure 11. The 2024 anthropogenic-pressure assessment identified several activities affecting the river system. Embankments may protect selected settlements but can also modify natural channel-floodplain connectivity and alter sediment deposition patterns.
Flood-hazard assessment
Flood hazard was assessed through a weighted multi-criteria GIS frame work. The selected parameters and their weights were: The flood hazard index can be expressed conceptually as:
Where: (FHI) =Flood Hazard Index, (W_i)=weight assigned to parameter(i), (R_i)=reclassified/ranked value of parameter(i).
The resulting flood hazard map categorized the basin into very low, low, moderate, high and very high hazard zones.
Rainfall trend
Rain fall data for 1990-2024 indicate an increasing trend in mean annual rainfall. Mean annual rainfall increased from 1,702mm during1990-1999 to 2,146mm during2020-2024. This increase is important for river morphodynamics because greater rainfall can generate higher runoff, particularly when associated with increasing impervious surfaces and declining vegetation cover. However, rainfall alone cannot explain channel change. River morphology responds to the combined influence of discharge, sediment supply, bank material, vegetation, floodplain confinement and human modification.
Relationship between LULC, rain fall and river morphodynamics
Figure 13 illustrates the relationship between built-up expansion and channel migration. Statistical analysis indicates significant relationships among several environmental variables. The correlation coefficient of 0.71 between built-up area and net channel migration indicates a strong positive association. This suggests that increasing urban development is closely associated with increasing channel mobility.
The correlation between rainfall and mean channel width (r = 0.64) suggests that increased rainfall may contribute to channel widening through increased runoff and discharge. Thestrongpositivecorrelationbetweenbuiltupareaandfloodhazard(r=0.75) demonstrates the important role of urbanization in increasing flood vulnerability.
The study findings support the importance of conserving forest and riparian vegetation because vegetation can contribute to bank stability and reduced sediment mobilisation. The reported statistical relationships should be interpreted as associations rather than evidence of direct causation
Discussion
Discussion
River morphodynamic evolution
The Thoubal River has undergone substantial morphological adjustment between 1990 and 2024. The increase in channel length, width, sinuosity and braiding index demonstrates that the river has become progressively more laterally complex.
The approximately 41% increase in mean channel width is particularly significant. Channel widening may result from increased peak discharge, bank erosion, sediment redistribution and removal of bank vegetation. Human activities can accelerate these processes by weakening bank resistance and modifying flow.
The increase in sinuosity from 1.36 to 1.72 in dictates progressive lateral development of channel bends. Meander migration can occur naturally, but accelerated migration near settlements and infrastructure represents a significant management concern.
LULC transformation
The most important landscape transformation is the rapid expansion of built-up land. Built-up area increased more than three fold in relative terms between1990 and 2024, while forest cover declined. Urbanisation has several consequences for river systems: 1. Increased impervious surface area; 2. Reduced infiltration; 3. Increased surface run off; 4. Rapid delivery of storm water to drainage channels; 5. Increased flood peaks; 6. Increased pressure on floodplains; and 7. Increased exposure of people and infrastructure to river hazards.
Thus, LULC transformation provides an important anthropogenic context for interpreting the observed river changes.
Erosion and Deposition
The erosion/deposition analysis shows that the Thoubal River is characterized by spatially variable geomorphic activity.
The lower reach has the strongest erosional tendency. This may be associated with increased flow concentration, channel adjustment, bank-material properties and human interventions.
Conversely, depositional zones occur where velocity decreases flow and sediment is stored within the floodplain or channel. The coexistence of erosion and deposition demonstrates that the river is responding dynamically rather than undergoing uniform channel migration. The weighted flood hazard approach therefore provides a more realistic representation than rainfall alone.
Role of anthropogenic activities
Role of anthropogenic activities
Conceptual model of thoubal river morphodynamics
The results support a conceptual model in which natural and anthropogenic factors interactto control channel evolution.
Major driving factors
Major driving factors
Implications for river-basin management
The findings have important implications for sustainable management of the Thoubal River.
Riparian buffer protection
Vegetated riparian zones should be maintained along vulnerable riverbanks. Riparian vegetation increases bank resistance, reduces erosion and provides ecological habitat.
Regulation of sand mining
Sand extraction should be scientifically regulated, particularly in reaches showing high erosion and channel instability. Extraction should not be permitted in sensitive zones immediately adjacent to unstable banks, bridges and important infrastructure.
Flood plain zoning
High-and very-high-hazard areas should be identified as restricted-development zones. New settlements and critical infrastructure should be discouraged in active floodplains.
Sustainable urban planning
Sustainable urban planning
Conclusions
The present study demonstrates significant spatio-temporal changes in the morphology and environmental setting of the Thoubal River during 1990-2024. The major conclusions are: 1. The Thoubal River channel length increased from77.64 km in1990 to79.13km in 2024.
2. Mean channel width increased from162.3mto228.7m, indicating ubstantial channel widening. 3. Sinuosity increased from1.36 to1.72, demonstrating increasing plan form complexity. 4. The braiding index increased from 0.28 to 0.49, indicating increasing channel segmentation and morphological instability. 5. Built-upland increased from 6,768 ha in 1990 to 20,543ha in2024. 6. Forest cover decreased from 12,246 ha to 8,745 ha during the same period. 7. Agricultural land declined from 54,812ha to 49,281ha. 8. Approximately 66.13% of the analyzed area was classified as relatively stable with respect to erosion/deposition. 9. The upper reach recorded an average migrationrateof+1.38m/year, while the lower reach showed-1.12 m/year and a dominant erosional tendency. 10. Mean annual rainfall increased from 1,702 mm during 1990-1999 to 2,146mm during 2020-2024. 11. Built-upexpansion was strongly positively correlated with net channel migration (r =0.71, p< 0.01). 12. Built-upexpansion was also strongly correlated with flood hazard(r =0.75, p<0.01). 13. Rainfall showed a positive relationship with mean channel width(r =0.64, p<0.01). 14. Forest and riparian vegetation conservation is important for reducing bank instability and sediment mobilisation. 15. Increasing urbanization, sand mining, infrastructure development and floodplain modification appear to be important anthropogenic controls on river instability.
Overall, the Thoubal River represents a dynamic fluvial system undergoing significant adjustment under the combined influence of monsoonal forcing, changing land cover and anthropogenic pressure. The results should be interpreted in light of the limitations associated with moderate-resolution satellite imagery, classification uncertainty, and the relative nature of the flood-hazard model. Effective management requires an integrated riverbasin approach combining remote sensing, GIS, hydrological monitoring, floodplain zoning, riparian conservation, regulated sand extraction and sustainable urban development.
Acknowledgement
AcknowledgementsThe author gratefully acknowledges Prof. H. Manoranjan Sharma, Principal, Waikhom Mani Girls' College, Thoubal, Manipur, India, for his support and encouragement.
Figures and tables from the paper
| Dataset | Source | Year/Period | Spatial Resolution | MajorUse |
|---|---|---|---|---|
| Landsat 5TM | USGS | 1990,2000 | 30m | LULC and change detection |
| Landsat 7ETM+ | USGS | 2010 | 30m | LULC and NDBI |
| Landsat 8 OLI/TIRS | USGS | 2020 | 30m | LULC and NDBI |
| Landsat 9 OLI/TIRS | USGS | 2024 | 30m | LULC and NDBI |
| SRTMDEM | USGS | - | 30m | Slope, drainage and morphometry |
| SOI Topo sheets | Survey of India | - | 1:50,000 | Base map and drainage verification |
| Rainfall data | IMD, Manipur | 1990-2024 | Daily | Rainfall and flood analysis |
| Field survey/GPS | Primary | 2024 | - | Ground verification |
Table text extracted from the original PDF; superscript letters are shown inline. The original table image is below.
View original table image
| Year | Overall Accuracy (%) | Kappa Coefficient | Assessment |
|---|---|---|---|
| 1990 | 87.32 | 0.84 | Good |
| 2000 | 88.17 | 0.86 | Good |
| 2010 | 89.25 | 0.87 | Very Good |
| 2020 | 90.11 | 0.88 | Very Good |
| 2024 | 90.76 | 0.89 | Very Good |
Table text extracted from the original PDF; superscript letters are shown inline. The original table image is below.
View original table image
| LULCclass | 1990(ha) | 2000(ha) | 2010(ha) | 2020(ha) | 2024(ha) |
|---|---|---|---|---|---|
| Waterbody | 9,128 | 8,756 | 8,112 | 7,169 | 6,042 |
| Forest | 12,246 | 11,587 | 10,432 | 9,256 | 8,745 |
| Agriculture | 54,812 | 53,214 | 51,236 | 50,312 | 49,281 |
| Built-up | 6,768 | 8,946 | 12,875 | 16,984 | 20,543 |
| Barrenland | 3,214 | 2,965 | 2,614 | 2,421 | 2,118 |
| Others | 1,366 | 2,233 | 2,472 | 2,579 | 2,252 |
Table text extracted from the original PDF; superscript letters are shown inline. The original table image is below.
View original table image
| Category | Area(ha) | Percentage of to talarea |
|---|---|---|
| High erosion (>30m) | 2,184 | 2.43 |
| Mode rate erosion(10-30m) | 4,762 | 5.31 |
| Slight erosion (5-10 m) | 6,213 | 6.92 |
| Stable (-5to+5m) | 59,426 | 66.13 |
| Slight deposition (5-10m) | 7,942 | 8.84 |
| Mode rate deposition (10-30m) | 6,518 | 7.25 |
| High deposition (>30 m) | 2,754 | 3.04 |
Table text extracted from the original PDF; superscript letters are shown inline. The original table image is below.
View original table image
| Parameter | 1990 | 2000 | 2010 | 2020 | 2024 |
|---|---|---|---|---|---|
| Total length (km) | 77.64 | 77.93 | 78.21 | 78.68 | 79.13 |
| Mean width (m) | 162.3 | 173.8 | 191.6 | 214.5 | 228.7 |
| Sinuosity | 1.36 | 1.42 | 1.53 | 1.63 | 1.72 |
| Braiding index | 0.28 | 0.31 | 0.36 | 0.43 | 0.49 |
| Maximum stream order | 5 | 5 | 5 | 5 | 5 |
| Drain age density (km/km²) | 1.42 | 1.43 | 1.44 | 1.46 | 1.47 |
Table text extracted from the original PDF; superscript letters are shown inline. The original table image is below.
View original table image
| Activity | Major locations | Intensity | Major impact |
|---|---|---|---|
| Sand mining | Middle and lower reaches | High | Channel incision and bank erosion |
| Urban isation | Basin-edge and settlement areas | High | Increased runoff and flood risk |
| Agricultural expansion | Basin fringe | Moderate | Land clearing and sediment yield |
| Embankments/check dams | Middle and lower reaches | Moderate | Flow alteration and siltation |
| Road sand bridges | Through out the basin | Moderate | Obstruction and local erosion |
| Waste disposal | Near urban areas | High | Water-quality degradation |
Table text extracted from the original PDF; superscript letters are shown inline. The original table image is below.
View original table image
| Parameter | Weight (%) |
|---|---|
| Rainfall | 20 |
| Slope | 15 |
| Elevation | 15 |
| Distanceto river | 20 |
| Drainage density | 10 |
| LULC/Built-up | 10 |
| Landform | 10 |
| Total | 100 |
Table text extracted from the original PDF; superscript letters are shown inline. The original table image is below.
View original table image
| Variables | Correlation coefficient (r) | Significance |
|---|---|---|
| Built-up area vs. net migration rate | 0.71 | p< 0.01 |
| Rainfall vs. mean channel width | 0.64 | p< 0.01 |
| Built-up area vs. flood-hazard index | 0.75 | p< 0.01 |
Table text extracted from the original PDF; superscript letters are shown inline. The original table image is below.
View original table image
References
22 in the original paper- Brierley GJ, Fryirs KA. Geomorphology and river management: Applications of the River Styles Framework. Oxford: Blackwell Publishing; 2005.
- Breiman L. Random forests. Machine Learning. 2001;45:5-32.
- Congalton RG. A review of assessing the accuracy of classifications of remotely sensed data. Remote Sensing of Environment. 1991;37:35-46.
- Congalton RG, Green K. Assessing the accuracy of remotely sensed data: Principles and practices. CRC Press; 2019.
- Elvidge CD, Baugh KE, Dietz JB, Bland T, Sutton PC, Krug T. DMSP-OLS calibration using cities as targets for stability. Remote Sensing of Environment. 2001;77:109-121.
- Friend PF, Sinha R. Braiding and meandering parameters. In: Best JL, Bristow CS, editors. Braided rivers. London: Geological Society; 1993.
- Gao BC. NDWI-A normalized difference water index for remote sensing of vegetation liquid water from space. Remote Sensing of Environment. 1996;58:257266.
- Jensen JR. Introductory digital image processing: A remote sensing perspective. Pearson; 2015.
- Mann HB. Nonparametric tests against trend. Econometrica. 1945;13:245-259.
- McFeeters SK. The use of the Normalized Difference Water Index in the delineation of open water features. International Journal of Remote Sensing. 1996;17:1425-1432.
- Miller JR. The response of fluvial systems to land-use change. Catena. 1995;24:141-156.
- O'Neill RV, DeAngelis DL, Waide JB, Allen TFH. A hierarchical concept of ecosystems. Princeton: Princeton University Press; 1986.
- Ouma YO, Tateishi R. A water index for rapid mapping of shoreline changes of five East African Rift Valley lakes. International Journal of Remote Sensing. 2006;27:3153-3171.
- Richards JA, Jia X. Remote sensing digital image analysis: An introduction. Springer; 2006.
- Saaty TL. The analytic hierarchy process. New York: McGraw-Hill; 1980.
- Schumm SA. Sinuosity of alluvial rivers on the Great Plains. Geological Society of America Bulletin. 1963;74:1089-1100.
- Sen PK. Estimates of the regression coefficient based on Kendall's tau. Journal of the American Statistical Association. 1968;63:1379-1389.
- Thieler ER, Himmelstoss EA, Zichichi JL, Ergul A. The Digital Shoreline Analysis System (DSAS) Version 4.0-An ArcGIS extension for calculating shoreline change. U.S. Geological Survey Open-File Report 2008-1278. Reston (VA): U.S. Geological Survey; 2009.
- Tucker CJ. Red and photographic infrared linear combinations for monitoring vegetation. Remote Sensing of Environment. 1979;8:127-150.
- Weng Q. A remote sensing-GIS evaluation of urban expansion and its impact on surface temperature in the Zhujiang Delta, China. International Journal of Remote Sensing. 2001;22:1999-2014.
- Wolman MG, Miller JP. Magnitude and frequency of forces in geomorphic processes. Journal of Geology. 1960;68:54-74.
- Yang X, Lo CP. Using a time series of satellite imagery to detect land use and land cover changes in the Atlanta metropolitan area. International Journal of Remote Sensing. 2002;23:1775-1798.