
Research article · 2026 · Full text
International Journal of Agriculture and NutritionEvaluation of growth, yield and quality of sugarcane genotypes under varying fertilizer levels
Volume 8(9) · Pages 01–04 · DOI: 10.33545/26646064.2026.v8.i9a.743 ↗
Research areasSugarcane Cultivation and ProcessingAgricultural Science and FertilizationCrop Yield and Soil Fertility
Abstract
Author-writtenField experiment entitled “Evaluation of Growth, Yield and Quality of Sugarcane Genotypes under Varying Fertilizer Levels” was conducted at Vasantdada Sugar Institute, Pune under the AICRP programme during the year 2024-25, to evaluate the performance of promising sugarcane genotypes under different fertilizer levels. The experiment was laid out in a Factorial Randomized Block Design (FRBD) with three replications, comprising two fertilizer levels, viz., 100% RDF and 125% RDF, and twelve sugarcane genotypes. The results revealed that application of 125% RDF significantly improved tiller count, millable cane population, growth attributes and cane yield compared with 100% RDF. The highest cane yield (101.82 t ha⁻¹) was recorded with 125% RDF, while its effect on CCS yield and juice quality parameters was non-significant. Among genotypes, Co 18013 recorded the highest tiller count (117.00 thousand ha⁻¹), whereas Co 18003 recorded the highest millable cane population (87.75 thousand ha⁻¹). Co 18012 recorded the highest cane yield (115.50 t ha⁻¹), while Co 18003 recorded the highest CCS yield (16.90 t ha⁻¹). Co 18003 also recorded superior juice quality with respect to Brix (23.83°) and sucrose (22.39%). The highest benefit: cost ratio was recorded in CoVc 18061 (1.58). The interaction between fertilizer levels and genotypes was non-significant for all the parameters, indicating a uniform response of genotypes to fertilizer levels. Overall, 125% RDF improved cane productivity, while Co 18012 and Co 18003 were superior for cane yield and CCS yield, respectively, demonstrating the importance of suitable fertilizer management and genotype selection for enhancing sugarcane productivity and profitability.
Summary
Source-checkedPlain-language reading of the full paper, prepared with AI and checked against the text. Each point links to the authors' own words.
Why it matters
- Sugarcane is a globally significant commercial crop used for the production of bioenergy, ethanol, and sugar. View evidence ↗
- Because it produces high biomass over a long duration, sugarcane needs a steady supply of essential nutrients to optimize its growth and sugar yield. View evidence ↗
- Different sugarcane genotypes may have varying fertilizer requirements based on their specific growth potential and nutrient utilization efficiency. View evidence ↗
The question
- The study aimed to evaluate how different fertilizer levels affect the growth, quality, and yield of elite sugarcane genotypes. View evidence ↗
What they did
- The field experiment was conducted during 2024-25 at the Vasantdada Sugar Institute in Pune. View evidence ↗
- The researchers used a Factorial Randomized Block Design with three replications, testing twelve genotypes across two fertilizer levels. View evidence ↗
- The two fertilizer treatments tested were 100% of the Recommended Dose of Fertilizer (RDF) and 125% RDF. View evidence ↗
- The base recommended dose of fertilizer was 250:115:115 kg N:P₂O₅:K₂O per hectare. View evidence ↗
What they found
- Applying 125% RDF significantly increased the millable cane population to 77.21 thousand ha⁻¹ and the tiller count to 97.67 thousand ha⁻¹ at 120 days after planting (DAP) compared to 100% RDF. View evidence ↗
- Cane yield was significantly higher under 125% RDF, reaching 101.82 t ha⁻¹. View evidence ↗
- While 125% RDF produced the highest CCS yield (14.98 t ha⁻¹), the effect of fertilizer levels on juice quality and CCS yield was not statistically significant. View evidence ↗
- Among the genotypes, Co 18013 had the highest tiller count at 120 DAP (117.00 thousand ha⁻¹), performing similarly to Co 18003 (112.25 thousand ha⁻¹). View evidence ↗
- Genotype Co 18012 achieved the highest cane yield at 115.50 t ha⁻¹, followed closely by CoVc 18061 (113.13 t ha⁻¹). View evidence ↗
- Co 18003 recorded the highest CCS yield at 16.90 t ha⁻¹, with Co 18012 following at 16.62 t ha⁻¹. View evidence ↗
- Genotype Co 18003 showed the best juice quality, with the highest sucrose (22.39%), Brix (23.83°), and CCS (16.14%). View evidence ↗
- There was no significant interaction between genotypes and fertilizer levels, meaning all genotypes responded similarly to the different fertilizer doses. View evidence ↗
What it means
- The authors conclude that 125% RDF enhances productivity, and selecting genotypes like Co 18012 (for cane yield) and Co 18003 (for CCS yield) is key to improving sugarcane profitability. View evidence ↗
Visual summary
3 visualsIllustrations explain the paper; charts are replotted from the paper's own table values.
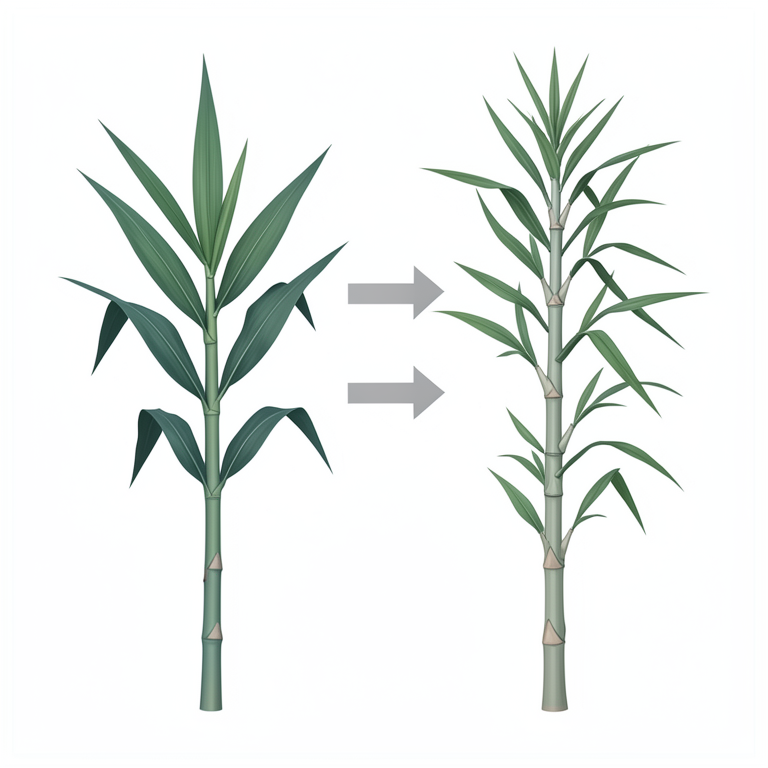
Fertilizer Impact Comparison
AI-generated conceptual illustration (sugarcane plants). It explains the idea and does not show study data.
View source evidence ↗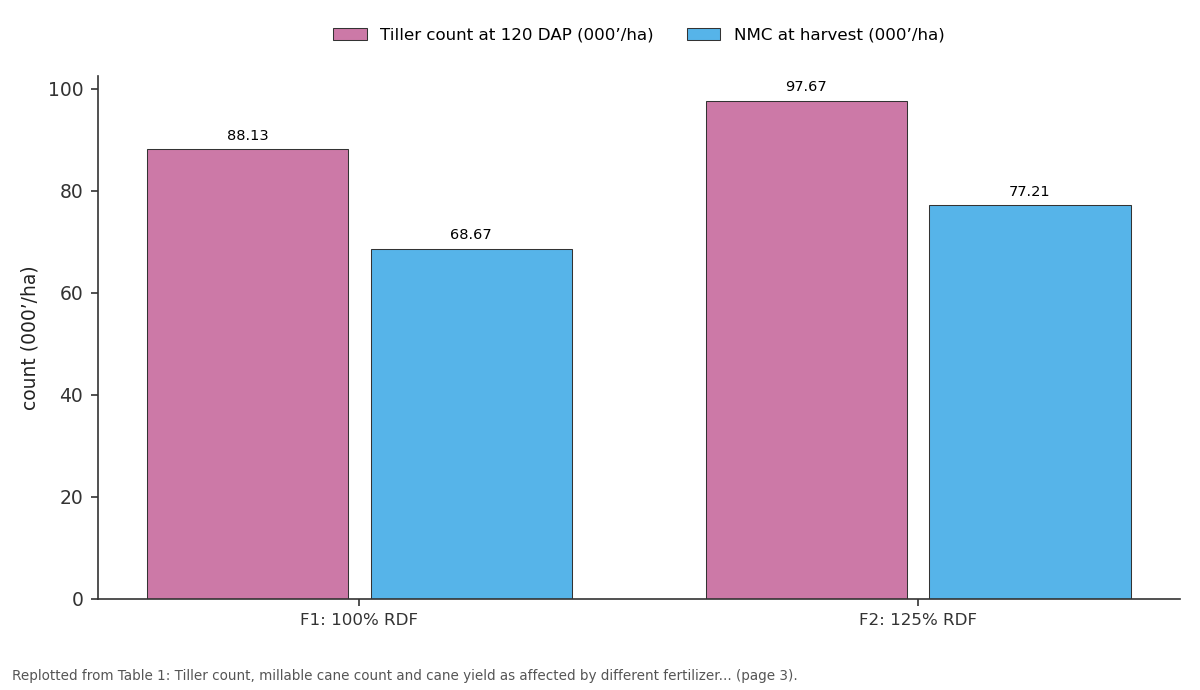
Tiller count at 120 DAP (000’/ha) and NMC at harvest (000’/ha): F1: 100% RDF vs F2: 125% RDF
Replotted from Table 1 (page 3) of the original paper. Every bar is the paper's own table value.
View source evidence ↗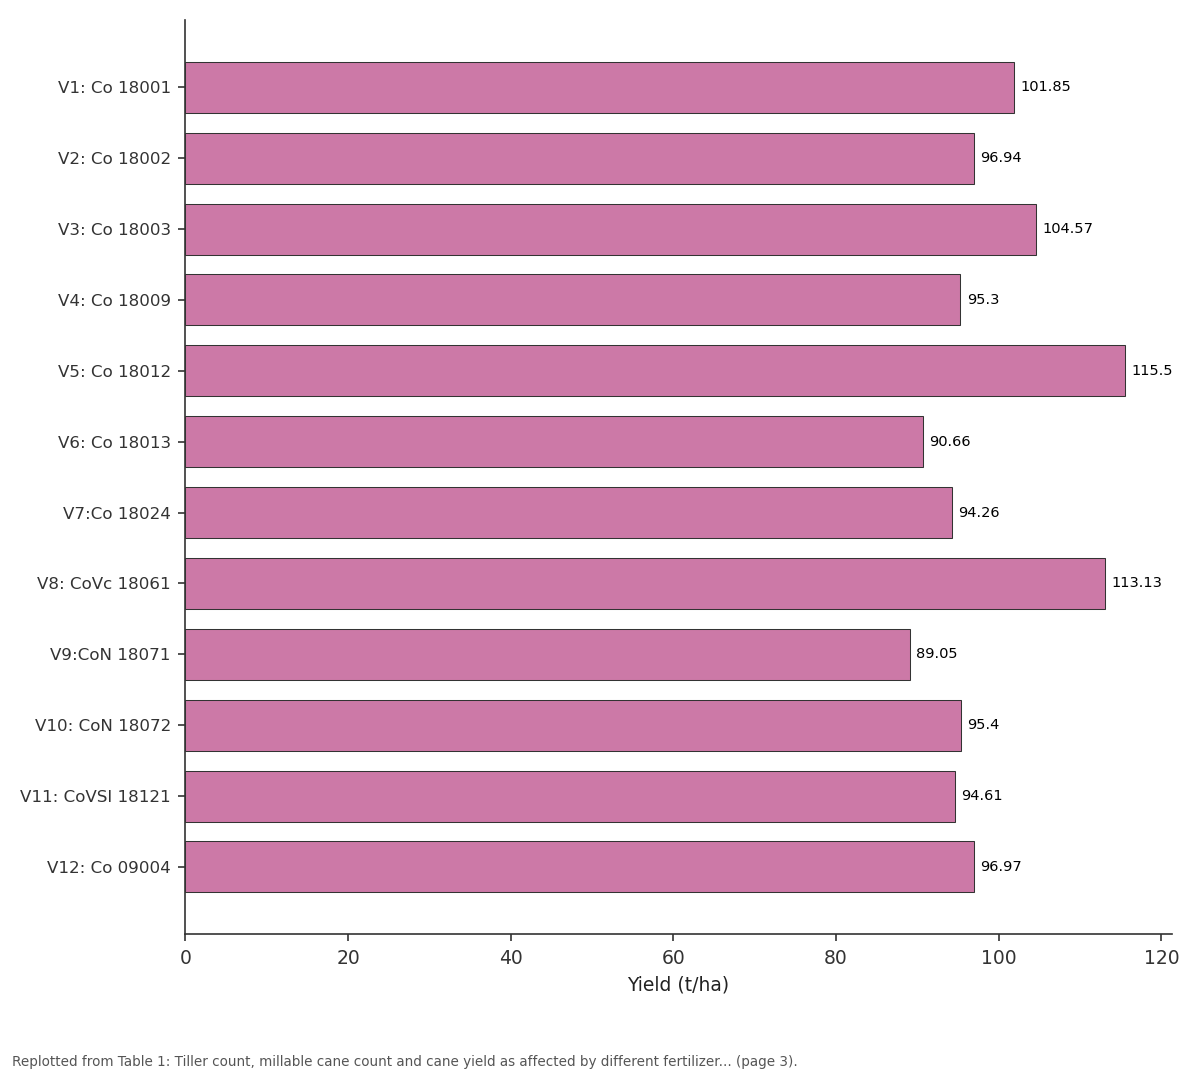
Yield (t/ha) / Cane: V1: Co 18001 vs V2: Co 18002 vs V3: Co 18003 vs V4: Co 18009 vs V5: Co 18012
Replotted from Table 1 (page 3) of the original paper. Every bar is the paper's own table value.
View source evidence ↗Figures & tables
From the original paper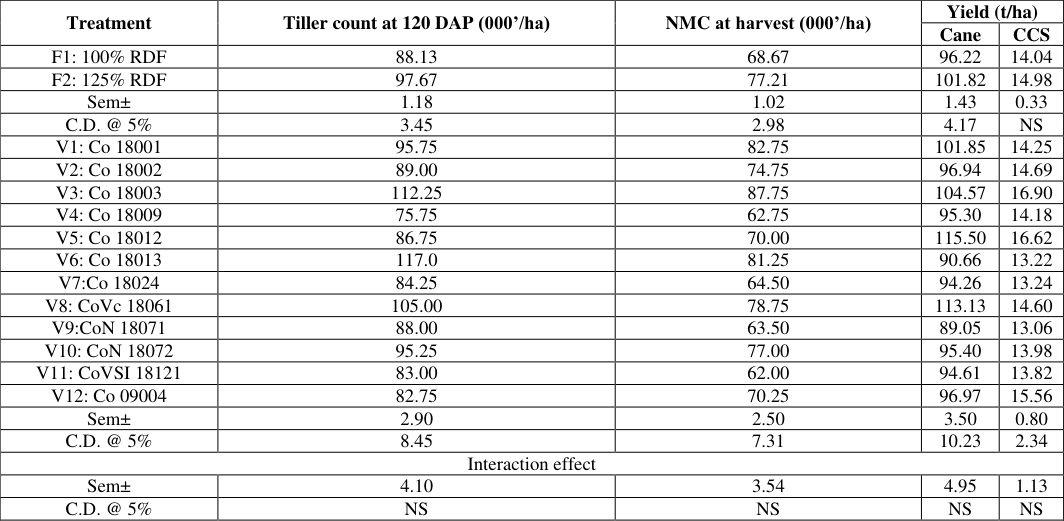 Table 1
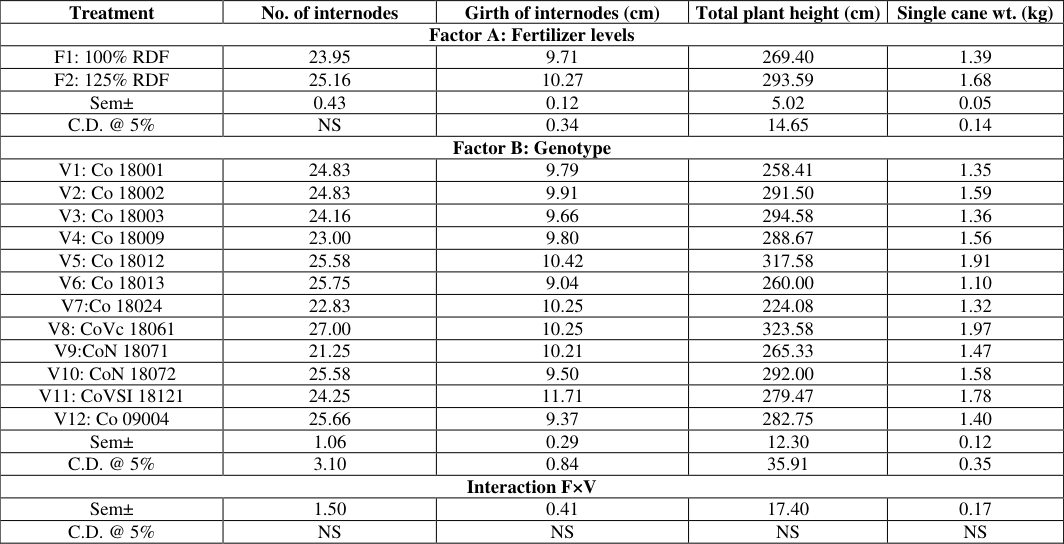 Table 2
 Table 3
Introduction
Sugarcane is one of the world's most important commercial crops, contributing significantly to sugar, ethanol, and bioenergy production. India is one of the leading sugarcane-producing countries and plays a vital role in the global sugar industry. Being a long-duration and high biomass-producing crop, sugarcane requires a continuous and adequate supply of essential plant nutrients for optimum growth, development, cane yield, and sugar production. Among the major nutrients, nitrogen, phosphorus, and potassium play a crucial role in regulating vegetative growth, root development, tillering, photosynthetic activity, assimilate translocation, and overall crop productivity (Kumar et al., 2020). Fertilizer management is one of the important agronomic practices for enhancing sugarcane productivity and maintaining efficient nutrient utilization. Imbalanced or inadequate nutrient supply can adversely affect crop growth and yield, while excessive application of fertilizers may reduce nutrient-use efficiency and increase production costs. Therefore, application of fertilizers at optimum levels according to crop requirement is essential for achieving higher cane and sugar productivity. The fertilizer requirement of sugarcane may also vary among genotypes due to differences in nutrient uptake, utilization efficiency, growth potential, and yield response. Evaluation of elite sugarcane genotypes under different fertilizer levels is therefore important for identifying genotypes with superior nutrient responsiveness and yield potential (Tayade et al., 2024) [8] . Different fertilizer levels can influence important agronomic traits such as tiller production, millable cane population, cane yield, sugar yield, and quality attributes. The interaction between genotype and fertilizer level is particularly important because superior genotypes may respond differently to increased nutrient availability. Hence, selection of suitable genotypes along with an appropriate fertilizer level can contribute to improved resource-use efficiency and sustainable sugarcane production. Therefore, the present study was undertaken to evaluate the elite sugarcane genotypes under different fertilizer levels by assessing their growth, yield, and quality attributes. The findings will aid in identifying promising genotype × fertilizer combinations for enhancing cane and sugar productivity under the prevailing agro-climatic conditions.
Materials and Methods
Materials and Methods
Results
Results
Effect of Fertilizer Levels
The results presented in Tables 1 to 3 revealed that fertilizer levels significantly influenced the growth and yield performance of sugarcane. Application of 125% RDF recorded significantly higher tiller count (97.67 thousand ha⁻¹) at 120 DAP and millable cane population (77.21 thousand ha⁻¹) compared with 100% RDF. The higher tillering and millable cane population under 125% RDF could be attributed to improved nutrient availability, which promoted vigorous vegetative growth and better tiller establishment and survival. Similar findings were reported by Shukla (2010) [6] and Kumar et al. (2014) [4] , who observed improved tillering and millable cane population with higher fertility levels. [4] and Singh et al. (2014) [7] . The number of internodes was not significantly influenced by fertilizer levels, indicating that this trait may be comparatively less responsive to nutrient application and more influenced by genetic and environmental factors. Although the highest CCS yield (14.98 t ha⁻¹) was recorded with 125% RDF, the differences among fertilizer levels were non-significant. Similarly, fertilizer levels did not significantly influence juice-quality parameters, suggesting that quality traits were relatively less responsive to increased fertilizer application under the present conditions. Singh et al. (2014) [7] and Tayade et al.
(2024) [8] also reported non-significant effects of fertility levels on major juice-quality parameters of sugarcane. The higher cane yield obtained with 125% RDF resulted in the highest benefit:cost ratio (1.38), indicating that the additional fertilizer investment was economically compensated through increased productivity. Overall, application of 125% RDF proved superior to 100% RDF by improving tillering, millable cane population, growth attributes, cane yield and economic returns, without causing a significant change in juice quality.
Effect of Genotypes
The data presented in Tables 1 (2024) [5] and Nirmal et al. (2022) [2] . [8] . The economic analysis revealed that CoVc 18061 recorded the highest benefit: cost ratio (1.58) followed by Co 18012 (1.55), which may be associated with their favorable cane yield and yieldcontributing characters. Overall, Co 18012 was superior for cane yield, Co 18003 for CCS yield and juice quality, while
CoVc 18061 recorded the highest benefit: cost ratio, indicating the importance of genotype selection for improving sugarcane productivity, sugar recovery and economic returns under the prevailing conditions.
Acknowledgement
AcknowledgementWe are thankful to Mr. Sambhaji Kadupatil, Director General, Vasantdada Sugar Institute, Pune for his encouragement during this research work and giving permission to publish this article. Authors are also thankful to scientists and supporting staff of crop production division for their help during the field experimentation
Figures and tables from the paper
| Treatment | Tiller count at 120 DAP (000’/ha) | NMC at harvest (000’/ha) | Yield (t/ha) | — |
|---|---|---|---|---|
| Cane | CCS | |||
| F1: 100% RDF | 88.13 | 68.67 | 96.22 | 14.04 |
| F2: 125% RDF | 97.67 | 77.21 | 101.82 | 14.98 |
| Sem± | 1.18 | 1.02 | 1.43 | 0.33 |
| C.D. @ 5% | 3.45 | 2.98 | 4.17 | NS |
| V1: Co 18001 | 95.75 | 82.75 | 101.85 | 14.25 |
| V2: Co 18002 | 89.00 | 74.75 | 96.94 | 14.69 |
| V3: Co 18003 | 112.25 | 87.75 | 104.57 | 16.90 |
| V4: Co 18009 | 75.75 | 62.75 | 95.30 | 14.18 |
| V5: Co 18012 | 86.75 | 70.00 | 115.50 | 16.62 |
| V6: Co 18013 | 117.0 | 81.25 | 90.66 | 13.22 |
| V7:Co 18024 | 84.25 | 64.50 | 94.26 | 13.24 |
| V8: CoVc 18061 | 105.00 | 78.75 | 113.13 | 14.60 |
| V9:CoN 18071 | 88.00 | 63.50 | 89.05 | 13.06 |
| V10: CoN 18072 | 95.25 | 77.00 | 95.40 | 13.98 |
| V11: CoVSI 18121 | 83.00 | 62.00 | 94.61 | 13.82 |
| V12: Co 09004 | 82.75 | 70.25 | 96.97 | 15.56 |
| Sem± | 2.90 | 2.50 | 3.50 | 0.80 |
| C.D. @ 5% | 8.45 | 7.31 | 10.23 | 2.34 |
| Interaction effect | ||||
| Sem± | 4.10 | 3.54 | 4.95 | 1.13 |
| C.D. @ 5% | NS | NS | NS | NS |
Table text extracted from the original PDF; superscript letters are shown inline. The original table image is below.
View original table image
| Treatment | No. of internodes | Girth of internodes (cm) | Total plant height (cm) | Single cane wt. (kg) |
|---|---|---|---|---|
| Factor A: Fertilizer levels | ||||
| F1: 100% RDF | 23.95 | 9.71 | 269.40 | 1.39 |
| F2: 125% RDF | 25.16 | 10.27 | 293.59 | 1.68 |
| Sem± | 0.43 | 0.12 | 5.02 | 0.05 |
| C.D. @ 5% | NS | 0.34 | 14.65 | 0.14 |
| Factor B: Genotype | ||||
| V1: Co 18001 | 24.83 | 9.79 | 258.41 | 1.35 |
| V2: Co 18002 | 24.83 | 9.91 | 291.50 | 1.59 |
| V3: Co 18003 | 24.16 | 9.66 | 294.58 | 1.36 |
| V4: Co 18009 | 23.00 | 9.80 | 288.67 | 1.56 |
| V5: Co 18012 | 25.58 | 10.42 | 317.58 | 1.91 |
| V6: Co 18013 | 25.75 | 9.04 | 260.00 | 1.10 |
| V7:Co 18024 | 22.83 | 10.25 | 224.08 | 1.32 |
| V8: CoVc 18061 | 27.00 | 10.25 | 323.58 | 1.97 |
| V9:CoN 18071 | 21.25 | 10.21 | 265.33 | 1.47 |
| V10: CoN 18072 | 25.58 | 9.50 | 292.00 | 1.58 |
| V11: CoVSI 18121 | 24.25 | 11.71 | 279.47 | 1.78 |
| V12: Co 09004 | 25.66 | 9.37 | 282.75 | 1.40 |
| Sem± | 1.06 | 0.29 | 12.30 | 0.12 |
| C.D. @ 5% | 3.10 | 0.84 | 35.91 | 0.35 |
| Interaction F×V | ||||
| Sem± | 1.50 | 0.41 | 17.40 | 0.17 |
| C.D. @ 5% | NS | NS | NS | NS |
Table text extracted from the original PDF; superscript letters are shown inline. The original table image is below.
View original table image
| Treatment | Brix (%) | Sucrose (%) | CCS (%) | B: C ratio |
|---|---|---|---|---|
| Factor A: Fertilizer levels | ||||
| F1: 100% RDF | 22.36 | 20.50 | 14.62 | 1.33 |
| F2: 125% RDF | 22.80 | 20.73 | 14.72 | 1.38 |
| Sem± | 0.22 | 0.26 | 0.20 | - |
| C.D. @ 5% | NS | NS | NS | - |
| Factor B: Genotype | ||||
| V1: Co 18001 | 21.83 | 19.78 | 14.03 | 1.39 |
| V2: Co 18002 | 23.77 | 21.53 | 15.27 | 1.32 |
Table text extracted from the original PDF; superscript letters are shown inline. The original table image is below.
View original table image
References
8 in the original paper- Krishnapriya V, Manimekalai R, Gomathi R, Duong VH, Arunkumar R, Prathima PT, Devakumar K, Thamilarasi K, Mahadeva Swamy HK, Amaresh, Govindaraj P, Dash PK. Strategic considerations for nutrient use efficiency in sugarcane: Physiological, molecular and genetic perspectives. Plant Science. 2026;364:112940.
- Kumar D, Nirmal, Meena LR, Meena LK, Meena AL, Raghavendra KJ, Bhowmik A. Analysis of genetic diversity and correlation in sugarcane (Saccharum spp. L) clones in North-West zone of Uttar Pradesh. Journal of Sugarcane Research. 2022;12(1):63-74.
- Kumar N, Rana L, Singh AK, Pramanick B, Gaber A, Alsuhaibani AM, Skalicky M, Hossain A. Precise macronutrient application can improve cane yield and nutrient uptake in widely spaced plant-ratoon cycles in the Indo-Gangetic plains of India. Frontiers in Sustainable Food Systems. 2023;7:1223881.
- Kumar V, Kumar S, Kumar S, Singh O, Kumar V. Effect of fertility levels and weed-management practices on yield potential, nutrient uptake and economics of spring-planted sugarcane (Saccharum officinarum). Indian Journal of Agronomy. 2014;59(1):139-144.
- Pujer S, Sutagundi RB, Yekkeli NR, Khandagave RB. Performance of newly developed sugarcane genotypes for morphological and quality traits in North Karnataka. Journal of Sugarcane Research. 2025;13(1):83-90.
- Shukla SK. Growth, yield and quality of high sugarcane (Saccharum officinarum) genotypes as influenced by planting seasons and fertility levels. Indian Journal of Agricultural Sciences. 2010;80(6):523-528.
- Singh R, Mishra A, Godara AS. Growth, yield and quality of mid late and late varieties of sugarcane (Saccharum spp. complex hybrid) as influenced by row spacing and fertility levels. Indian Journal of Agricultural Sciences. 2014;84(10):1280-1283.
- Tayade AS, Ponnaiyan G, Anusha S, Palaniswami C, Govindaraj P. Agronomic evaluation of sugarcane (Saccharum spp. hybrid) genotypes for its cane yield and quality under different fertilizer levels. Journal of Sugarcane Research. 2024;12(2):186.