
Research article · 2026 · Full text
International Journal of Horticulture and Food SciencePlant growth regulator-mediated changes in phenology, canopy dynamics and physiological growth of Ashwagandha (Withania somnifera L. Dunal)
Volume 8(8) · Pages 106–115 · DOI: 10.33545/26631067.2026.v8.i8b.844 ↗
Research areasFlowering Plant Growth and CultivationPhytochemicals and Medicinal PlantsPlant Growth Enhancement Techniques
Abstract
Author-writtenAshwagandha (Withania somnifera L. Dunal) is an important medicinal crop whose growth and development can be influenced by plant growth regulators. A field experiment was conducted during 2017–18 at the Horticulture Research Farm, College of Horticulture, Mandsaur, Madhya Pradesh, India, to evaluate the effect of indole-3-butyric acid (IBA), 2,3,5-triiodobenzoic acid (TIBA) and chlormequat chloride (CCC) on phenological development and physiological growth characteristics of Ashwagandha. The experiment consisted of ten treatments comprising IBA at 100, 150 and 200 ppm; TIBA at 40, 50 and 60 ppm; CCC at 250, 500 and 750 ppm; and water spray as control, arranged in a randomized block design with three replications. Foliar applications were made at 30, 45 and 75 days after sowing. TIBA at 50 ppm accelerated phenological development and recorded the minimum number of days required for 50% germination, 50% flowering, physiological maturity and physical maturity. IBA at 100 ppm recorded the highest leaf area at 45 and 75 DAS and showed favourable canopy development and chlorophyll responses. CCC at 250 ppm recorded the highest leaf area at 105 DAS and the highest leaf area index and leaf area duration during the 75–105 DAS interval. Specific leaf area, crop growth rate and relative growth rate did not differ significantly among treatments. The results demonstrate that plant growth regulator responses in Ashwagandha were regulator-specific and growth-stage dependent.
Summary
Source-checkedPlain-language reading of the full paper, prepared with AI and checked against the text. Each point links to the authors' own words.
Why it matters
- Ashwagandha is a valuable medicinal crop grown for its roots, which contain bioactive constituents like withanolides. View evidence ↗
- Plant growth regulators (PGRs) can be used to modify a plant's development by altering hormonal balance and how nutrients are distributed. View evidence ↗
- Physiological growth analysis using metrics like leaf area and growth rates helps explain how treatments affect crop development before harvest. View evidence ↗
The question
- The study aimed to evaluate how different concentrations of IBA, TIBA, and CCC affect the phenological stages and physiological growth of Ashwagandha cv. RVA-100. View evidence ↗
What they did
- Ten treatments were tested in a randomized block design with three replications: IBA (100, 150, 200 ppm), TIBA (40, 50, 60 ppm), CCC (250, 500, 750 ppm), and a water spray control. View evidence ↗
- The growth regulators were applied as foliar sprays at 30, 45, and 75 days after sowing. View evidence ↗
What they found
- TIBA at 50 ppm accelerated crop development, resulting in the shortest time to reach 50% germination, 50% flowering, and both physiological and physical maturity. View evidence ↗
- IBA at 100 ppm led to the largest leaf area in early growth, while CCC at 250 ppm resulted in the highest leaf area at 105 days after sowing (DAS). View evidence ↗
- Leaf Area Index (LAI) was highest with IBA at 100 ppm during the 45–75 and 105–135 DAS intervals, but CCC at 250 ppm was most effective during the 75–105 DAS interval. View evidence ↗
- IBA at 100 ppm consistently maintained the highest chlorophyll levels (measured as SPAD values) from 75 DAS until harvest. View evidence ↗
- IBA at 100 ppm provided superior leaf area duration (LAD) in early growth stages, though this advantage changed as the crop matured. View evidence ↗
What it means
- The authors conclude that TIBA at 50 ppm is best for accelerating development, while IBA at 100 ppm is most effective for improving canopy and leaf physiological status. View evidence ↗
- The authors note that future research should combine chlorophyll measurements with gas exchange or fluorescence to better understand the mechanisms involved. View evidence ↗
Visual summary
1 visualsIllustrations explain the paper; charts are replotted from the paper's own table values.
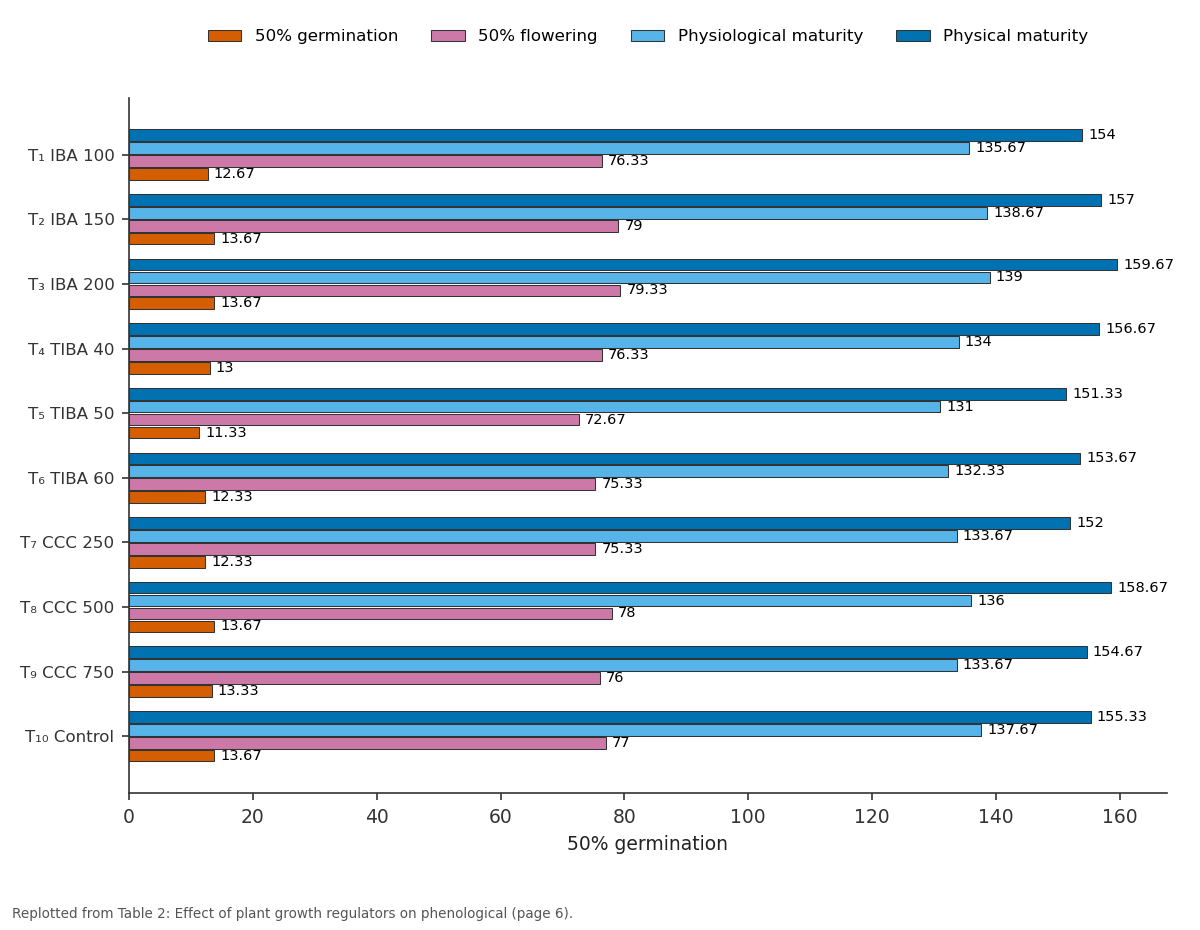
50% germination and 50% flowering and more: T₁ IBA 100 vs T₂ IBA 150 vs T₃ IBA 200 vs T₄ TIBA 40 vs T₅ TIBA 50
Replotted from Table 2 (page 6) of the original paper. Every bar is the paper's own table value.
View source evidence ↗Figures & tables
From the original paper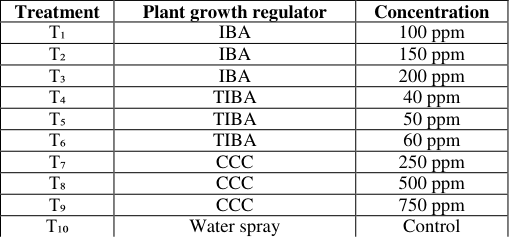 Table 1
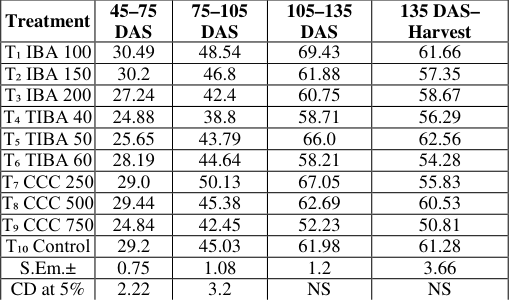 Table 5
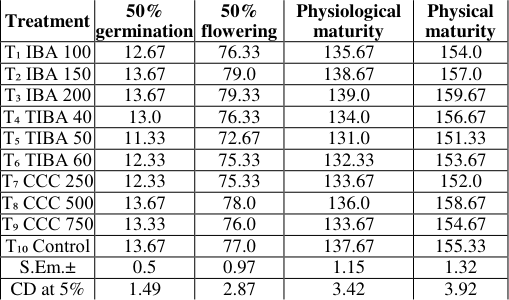 Table 2
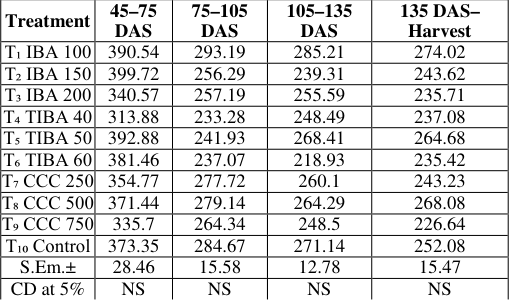 Table 6
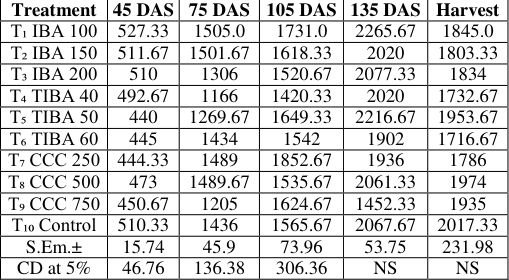 Table 3
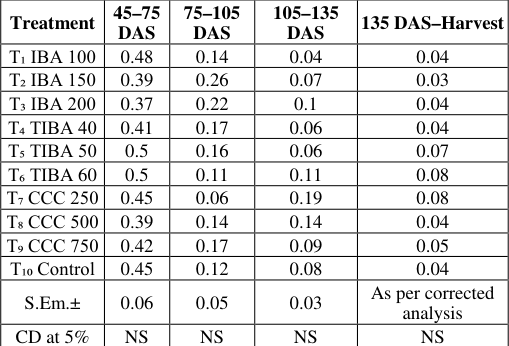 Table 7
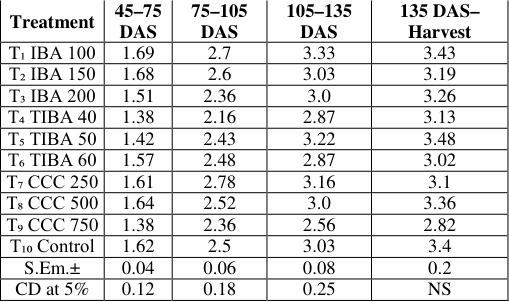 Table 4
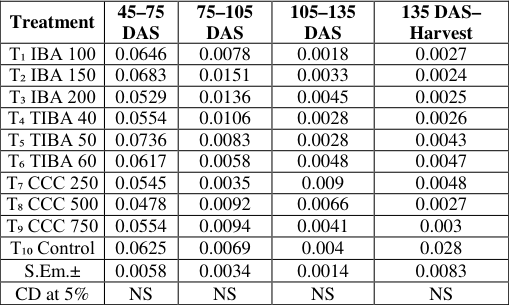 Table 8
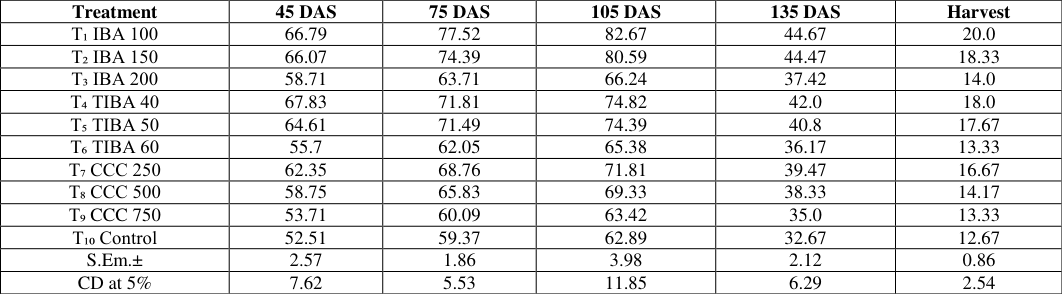 Table 9
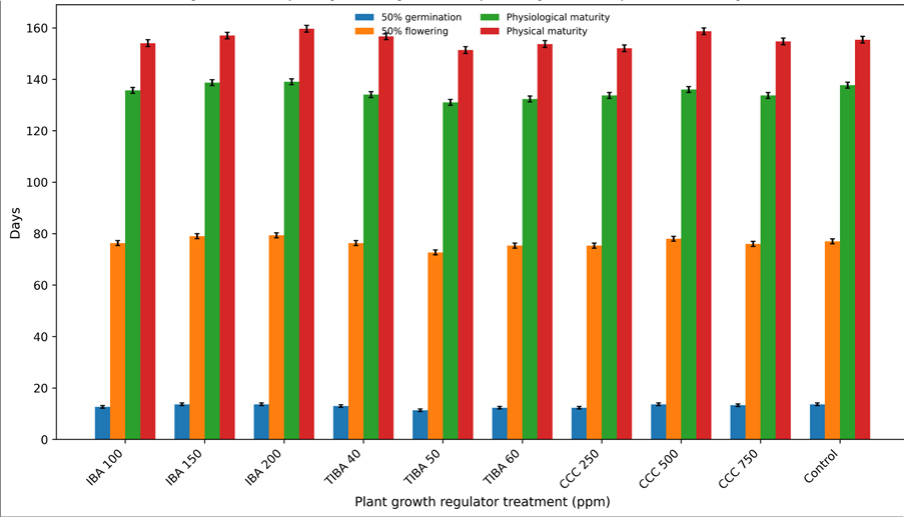 Figure 1
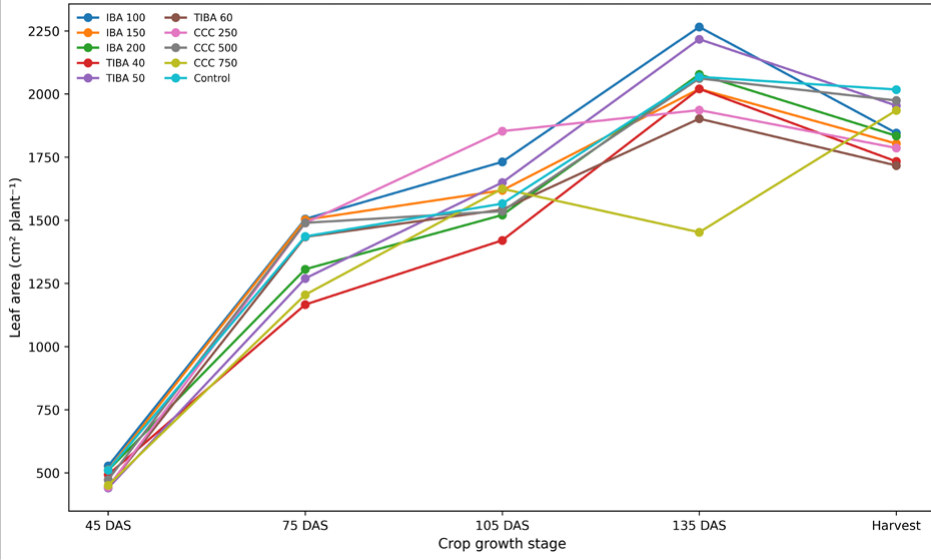 Figure 2
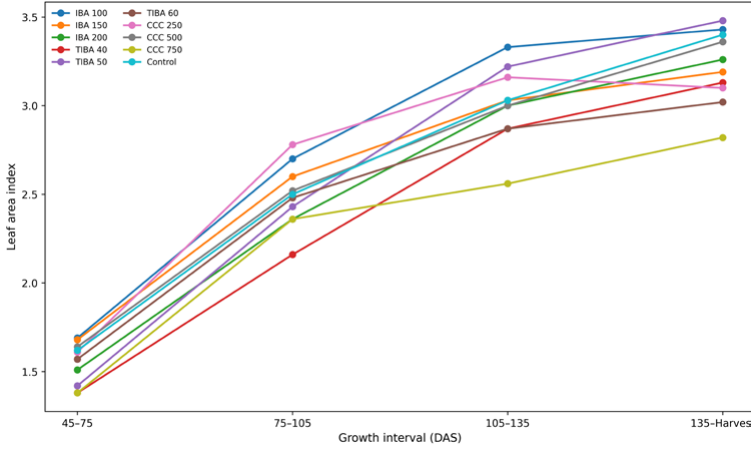 Figure 3
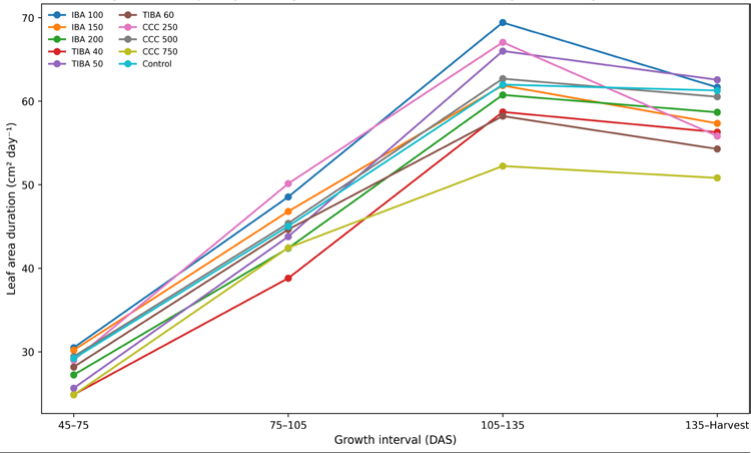 Figure 4
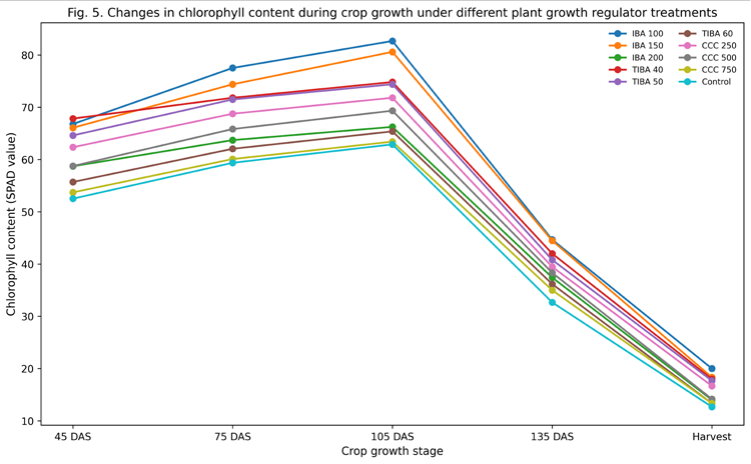 Figure 5
Introduction
Ashwagandha (Withania somnifera L. Dunal) is an important medicinal crop cultivated for its roots and bioactive constituents. Plant growth regulators can influence developmental progression, canopy development and physiological activity. Growth-analysis parameters such as leaf area, leaf area index (LAI), leaf area duration (LAD), specific leaf area (SLA), crop growth rate (CGR), relative growth rate (RGR) and chlorophyll content provide a useful framework for evaluating treatment responses over successive crop-growth stages. A previous publication from the same experiment reported growth and yield attributes. Therefore, the present manuscript is restricted to the phenological and physiological growthanalysis dataset and does not reproduce the previously reported growth and yield results. The objective was to evaluate the influence of different concentrations of IBA, TIBA and CCC on phenological development and physiological growth characteristics of Ashwagandha.
Agronomic and physiological importance of Ashwagandha
Ashwagandha (Withania somnifera L. Dunal) is an economically important medicinal crop cultivated primarily for its roots, which are valued as a source of withanolides and other bioactive constituents. Its commercial importance has stimulated research on crop establishment, genotype selection, plant density, tillage, nutrient management and physiological regulation. Agronomic studies have shown that changes in crop management can substantially influence plant morphology, biomass production, root yield and quality, demonstrating the close relationship between crop growth and final medicinal raw-material production [1,2,16,17] . The crop is commonly grown under relatively dry and subtropical to semi-arid conditions, and its performance is influenced by soil properties, season and genotype. Field studies have demonstrated substantial variation among Ashwagandha genotypes for morphological, chemical and yield-related traits, indicating that crop productivity is governed by both genetic constitution and the production environment [18,19] . Consequently, physiological measurements are useful because they help explain how a treatment modifies crop development before differences become visible at final harvest.
Plant growth regulators and developmental regulation
Plant growth regulators provide an experimental means of modifying plant development through changes in endogenous hormonal balance, organ growth and assimilate distribution. Auxin-related compounds, including indole-3butyric acid (IBA), are widely associated with root development and growth regulation, while TIBA can interfere with polar auxin transport and thereby alter developmental responses. CCC is commonly used as a growth-regulating compound capable of modifying vegetative growth and plant architecture [3,5,20] . The magnitude and direction of these responses, however, depend on the compound, concentration, application timing and crop growth stage. Studies conducted specifically on Ashwagandha support the relevance of growth-regulator research. Kukreti et al. reported that growth regulators influenced growth, biomass and reproductive development of Withania somnifera, while the field experiment previously published from the present treatment series showed differential effects of IBA, TIBA and CCC on growth and yield attributes [21,22] . Additional work combining biofertilizers with PGRs also demonstrated that regulator treatments can modify growth, root yield and alkaloid-related traits [23] . These studies establish that Ashwagandha responds to growth regulation, but they also show that responses cannot be generalized from one concentration or production environment to another.
Need for physiological growth analysis
Measurements such as leaf area, leaf area index (LAI), leaf area duration (LAD), specific leaf area (SLA), crop growth rate (CGR) and relative growth rate (RGR) provide complementary information about crop performance. Classical growth analysis emphasizes that final biomass is the integrated outcome of canopy development and the rate at which assimilates are accumulated over time [6,8,10,11] . A treatment may therefore influence one component of growth, such as leaf expansion or canopy persistence, without producing a statistically significant response in every composite growth index. This distinction is particularly relevant for medicinal crops, where the production objective is not simply maximum vegetative biomass. The timing of canopy development, duration of physiological activity and progression toward maturity can influence the period during which assimilates are produced and subsequently partitioned to economically important organs. A field study of Ashwagandha that evaluated physiological parameters at successive stages demonstrated measurable differences in total leaf area, LAI, CGR, LAD, RGR and photosynthetic pigments under contrasting management practices [24] . These observations provide a useful framework for interpreting the present physiological dataset.
Rationale and objective of the present study
The present manuscript was developed to provide a focused analysis of the phenological and physiological observations generated from the field experiment. A separate publication from the same treatment series has already reported major growth and yield attributes; therefore, those previously published variables are not reproduced as primary results here [22] . Instead, the present study examines how IBA, TIBA and CCC at different concentrations influenced developmental timing, canopy establishment, canopy persistence and physiological growth indices. This approach provides an independent interpretation of the dataset and contributes to a more complete understanding of plant growth regulator responses in Ashwagandha. The specific objective was to evaluate the effects of different concentrations of IBA, TIBA and CCC on days to major phenological stages, leaf area, LAI, LAD, SLA, CGR, RGR and chlorophyll status of Ashwagandha cv. RVA-100 under field conditions.
Materials and Methods
Materials and Methods
Experimental site
The field experiment was conducted during the late Kharif season of 2017-18 at the Research Field of the Department of Plantation, Spices, Medicinal and Aromatic Crops, College of Horticulture, Mandsaur, Rajmata Vijayaraje Scindia Krishi Vishwavidyalaya (RVSKVV), Gwalior, Madhya Pradesh, India. The experimental period extended from October 2017 to March 2018. Mandsaur is located on the Malwa Plateau in the western part of Madhya Pradesh, between 23.45° and 24.13° N latitude and 74.44° and 75.18° E longitude, at an altitude of 435.02 m above mean sea level. The experimental soil was light black and loamy in texture, with low available nitrogen (192 kg ha⁻¹), low available phosphorus (7.6 kg ha⁻¹), medium available potassium (145.0 kg ha⁻¹), pH 8.36 and electrical conductivity of 0.18 dS m⁻¹.
Experimental material, design and crop management
Ashwagandha (Withania somnifera L. Dunal) cv. RVA-100 was used as the experimental material. The crop was sown at a spacing of 30 × 20 cm using a seed rate of 5-7 kg ha⁻¹. The experiment comprised ten treatments and three replications and was laid out in a Randomized Block Design (RBD). The treatments consisted of foliar application of indole-3-butyric acid (IBA), 2,3,5-triiodobenzoic acid (TIBA), and cycocel/chlormequat chloride (CCC) at different concentrations. Foliar sprays were applied at 30, 45 and 75 days after sowing (DAS). The untreated control received water spray.
Treatment details
T₁: IBA 100 ppm; T₂: IBA 150 ppm; T₃: IBA 200 ppm; T₄: TIBA 40 ppm; T₅: TIBA 50 ppm; T₆: TIBA 60 ppm; T₇: CCC 250 ppm; T₈: CCC 500 ppm; T₉: CCC 750 ppm; T₁₀: water spray (control).
Observations and physiological growth analysis
Phenological observations included days to 50% germination, 50% flowering, physiological maturity and physical maturity. Physiological growth observations included leaf area, leaf area index (LAI), leaf area duration (LAD), specific leaf area (SLA), crop growth rate (CGR), relative growth rate (RGR) and chlorophyll content. Observations were recorded at successive crop-growth stages, as applicable. The growth-analysis indices were calculated using standard procedures described in classical crop growth analysis [6,8] . The following formulae were used:
Leaf area index (LAI)
LAI = Total leaf area / Land area For successive observations: LAI = (LA₂ + LA₁) / 2P
where LA₁ and LA₂ are leaf areas at two consecutive observations and P is the land area occupied by the plant [6] .
Leaf area duration (LAD)
where LA₁ and LA₂ represent leaf area at two successive time intervals (t₁ and t₂) [7] .
Specific leaf area (SLA)
Specific leaf area (SLA)
where LA₁ and LA₂ are leaf areas and LW₁ and LW₂ are the corresponding leaf dry weights at the two observations.
Crop growth rate (CGR)
Crop growth rate (CGR)
where W₁ and W₂ are the dry weights of plants at times t₁ and t₂, respectively, and P is the land area [6-8].
Relative growth rate (RGR)
where W₁ and W₂ are the plant dry weights at times t₁ and t₂, respectively.
Statistical analysis
The data were analysed according to the analysis of variance (ANOVA) procedure appropriate for a Randomized Block Design. Treatment means were compared using the critical difference (CD) at the 5% level of significance. Statistical analysis was carried out following the procedures described by Panse and Sukhatme [9] .
Results and Discussion
Results and Discussion
Integrated interpretation of phenological responses
The phenological observations showed a clear regulatorspecific response. TIBA at 50 ppm required the minimum number of days for 50% germination, 50% flowering, physiological maturity and physical maturity, indicating a consistent acceleration of crop development. In contrast, the higher IBA concentration tended to prolong the duration required to attain comparable phenological stages. The response is consistent with the role of TIBA as an inhibitor of polar auxin transport, through which developmental balance and the relative expression of vegetative and reproductive growth may be altered [11,12] . Earlier work cited in Ashwagandha also reported that plant growth regulators can modify floral initiation and maturity-related events [18,21] . An important feature of the present data is that the intermediate TIBA concentration was more effective than both the lower and higher concentrations. This concentration-dependent pattern suggests that the response was not simply proportional to the amount of regulator applied. Plant growth regulators frequently produce optimum responses within a restricted concentration range, beyond which stimulation may decline or inhibitory effects may become dominant [3,11] . Therefore, the present findings support the identification of an effective physiological dose rather than the assumption that a higher concentration necessarily produces a stronger response.
Leaf area development and canopy expansion
Leaf area is a major determinant of the assimilatory surface available for interception of solar radiation and subsequent dry-matter production. Significant treatment differences were evident during the early and middle stages of crop development, while differences became non-significant at 135 DAS and harvest. IBA at 100 ppm produced the greatest leaf area during the early stages, whereas CCC at 250 ppm produced the highest value at 105 DAS. The disappearance of statistical differences toward maturity indicates convergence of canopy size among treatments during the final phase of crop development. The superiority of IBA at 100 ppm during the early growth period agrees with the established developmental role of IBA-derived auxin in plant growth and organ development [3,4] . Earlier studies on Ashwagandha and other crops have also reported growth stimulation and improved vegetative development under appropriate concentrations of IBA [17,18,21] . In the present experiment, however, increasing IBA concentration from 100 to 150 or 200 ppm did not improve canopy development, again demonstrating that the response was concentration dependent. The mid-season advantage of CCC at 250 ppm suggests a different physiological mode of action. CCC is widely used as a growth regulator that modifies vegetative development and can alter stem elongation, canopy architecture and chlorophyll status [5,14] . The present response indicates that moderate CCC concentration may have supported canopy maintenance during the period of maximum vegetative activity without producing the stronger growth restriction expected at excessive doses.
Leaf area index and canopy-level response
The LAI results closely complemented the leaf-area response but provided a canopy-level interpretation by relating assimilatory surface to the ground area occupied by the crop. Significant treatment differences were observed during the first three growth intervals. IBA at 100 ppm produced the highest LAI during 45-75 and 105-135 DAS, while CCC at 250 ppm was superior during 75-105 DAS. The final interval showed no significant difference among treatments. The changing treatment ranking across growth stages is particularly important. It indicates that no single regulator dominated canopy performance throughout the complete crop cycle. Instead, IBA at 100 ppm was more closely associated with rapid establishment and later canopy persistence, whereas CCC at 250 ppm expressed its strongest response during the active middle phase. Similar growth-stage dependence has been recognized in crop growth analysis, where leaf development and assimilatory performance are influenced by both developmental age and environmental conditions [6][7][8] .
Leaf area duration and persistence of the assimilatory surface
Leaf area duration integrates canopy magnitude with the length of time over which the leaf surface is maintained. Thus, LAD provides a useful indication of the persistence of the photosynthetically active canopy [6,7] . In the present study, IBA at 100 ppm recorded superior LAD during the early intervals, whereas the treatment advantage shifted during later stages. TIBA at 50 ppm recorded the highest numerical LAD during 135 DAS to harvest, although the final-stage differences were non-significant. The increase in LAD up to the middle-to-late crop period followed by a decline toward harvest corresponds to the normal sequence of canopy establishment, maximum persistence and progressive senescence. Since the treatment differences were strongest before maturity, the results suggest that plant growth regulators primarily altered the timing and persistence of canopy development rather than maintaining a permanent separation among treatments until harvest.
Specific leaf area, crop growth rate and relative growth rate
Specific leaf area, crop growth rate and relative growth rate did not differ significantly among treatments. These nonsignificant responses are important because they demonstrate that changes in visible canopy development and chlorophyll status were not necessarily accompanied by statistically detectable differences in all integrated growth indices. SLA reflects the relationship between leaf area and leaf dry matter, whereas CGR and RGR integrate the outcome of several simultaneous processes, including photosynthesis, respiration, dry-matter partitioning and developmental stage [6][7][8] . Accordingly, the absence of significant treatment effects for these indices should not be interpreted as evidence that the regulators had no physiological effect. Rather, it indicates that treatmentinduced variation in canopy size and chlorophyll status was not sufficiently consistent to produce significant differences in integrated biomass accumulation rates under the experimental conditions. This distinction between component traits and composite growth indices is a central principle of classical growth analysis [6,7] . The control CGR value of 0.04 at 105-135 DAS has been retained in the final dataset as corrected by the authors.
Chlorophyll dynamics and physiological status
Chlorophyll content showed one of the clearest treatment responses. IBA at 100 ppm maintained the highest SPAD values from 75 DAS through harvest. Chlorophyll values generally increased from 45 DAS to a maximum around 105 DAS and then declined sharply at 135 DAS and harvest. The temporal pattern is consistent with progressive canopy development followed by physiological ageing and senescence. The sustained SPAD advantage under IBA at 100 ppm complements the favourable leaf-area and LAI responses under the same treatment. Together, these observations suggest that the treatment improved not only canopy size during key stages but also the physiological status of the leaves. Nevertheless, SPAD values are an indirect estimate of chlorophyll status and should not be interpreted as a direct measurement of photosynthetic rate. Future work combining chlorophyll estimation with gas exchange or chlorophyll fluorescence would provide a stronger mechanistic explanation. CCC also produced measurable chlorophyll responses, consistent with earlier reports that growth-regulating compounds can influence pigment status and vegetative development [5,14] . However, the present data indicate that IBA at 100 ppm was more consistently associated with high chlorophyll readings across successive observations.
Overall physiological interpretation
Taken together, the results reveal three distinct response patterns. TIBA at 50 ppm primarily accelerated phenological progression. IBA at 100 ppm promoted stronger canopy development and maintained comparatively high chlorophyll status. CCC at 250 ppm expressed its strongest influence during the middle phase of canopy development. These findings demonstrate that the three regulators should not be considered interchangeable; each altered a different dimension of crop development. The concentration effect was equally important. The lowest IBA concentration tested was generally more favourable for canopy-related traits than the higher IBA concentrations, while the intermediate TIBA concentration produced the strongest phenological acceleration. Likewise, CCC at 250 ppm was more favourable for selected physiological traits than higher CCC concentrations. Such patterns reinforce the importance of dose optimization in growth-regulator research. Because the present manuscript focuses specifically on phenology and physiological growth analysis, growth and yield attributes reported elsewhere from the same experiment are not reproduced as primary results here. The current interpretation therefore provides a distinct physiological perspective on the experiment and avoids duplication of previously reported outcome variables.
Relationship between canopy development and physiological activity
The combined behaviour of leaf area, LAI, LAD and SPAD values provides a more complete interpretation than any individual variable alone. Leaf area describes the size of the assimilatory surface at a particular observation, whereas LAI relates that surface to the land area occupied by the crop. LAD further incorporates the duration for which the canopy is maintained. Consequently, a treatment may exhibit an advantage in early leaf expansion but lose that advantage later, while another treatment may become more prominent during the period of maximum canopy activity. Such stage-dependent responses are consistent with the principles of crop growth analysis described by Watson and later growth-analysis literature [6,8,10,11] . In the present study, IBA at 100 ppm was consistently associated with favourable early canopy development and higher chlorophyll readings during much of the observation period. The relationship between these responses is physiologically plausible because leaf expansion determines the potential radiation-intercepting surface, while chlorophyll status provides an indication of the photosynthetic pigment environment within that canopy. Nevertheless, SPAD readings should be interpreted as an indirect estimate of chlorophyll status rather than as a direct measurement of photosynthetic rate. Studies of Ashwagandha under different management systems have similarly reported coordinated changes in leaf area, growth indices and pigment concentrations [24] .
Concentration-dependent response to plant growth regulators
A major outcome of the experiment is that the strongest response was not always obtained at the highest concentration. IBA at 100 ppm was generally more favourable for several canopy-related traits than the higher IBA concentrations, TIBA at 50 ppm was most consistently associated with accelerated phenological development, and CCC at 250 ppm showed its most distinct response during the active middle stage. This pattern supports the concept that plant growth regulation involves an optimum response range rather than a simple linear increase with dose [3,5,20] . Comparable concentration-dependent responses have been reported in Ashwagandha and other crop systems. Kukreti et al. observed differential growth and biomass responses to growth-regulator treatments in Withania somnifera [21] , while Barathkumar and Manivannan reported that combinations of biofertilizers and PGRs could alter growth, yield and alkaloid content [23] . Recent field work has also continued to demonstrate that foliar PGR application can modify biomass, productivity and quality-related traits in Ashwagandha [25] . The present results therefore add physiological evidence to the broader observation that PGR responses are dependent on dose and developmental context.
Phenology in relation to the crop production cycle
The earlier attainment of phenological stages under TIBA at 50 ppm is important because the developmental calendar of Ashwagandha determines the duration available for vegetative growth, flowering and subsequent maturation. The consistent acceleration observed across several phenological events suggests that the treatment influenced the overall developmental progression rather than a single isolated stage. Research on Ashwagandha cultivation indicates that harvest maturity and crop duration are important considerations for root production and quality, while seasonal conditions can modify plant productivity and secondary-metabolite accumulation [17,26] . However, earlier phenological progression should not automatically be interpreted as superior for every production objective. A faster transition toward maturity may be desirable where crop duration is limiting, whereas prolonged vegetative activity may support greater biomass accumulation under other circumstances. The present experiment therefore demonstrates that PGR selection should be linked to the intended agronomic outcome. TIBA at 50 ppm showed the strongest phenological acceleration, whereas IBA at 100 ppm was more consistently associated with canopy development and chlorophyll status.
Interpretation of non-significant growth indices
The absence of significant treatment effects for SLA, CGR and RGR deserves particular attention. Growth indices are derived variables that integrate changes occurring over a defined time interval. As a result, variation in photosynthesis, respiration, dry-matter allocation and plant size can partially offset one another when expressed as a single composite index [6,8] . A non-significant CGR or RGR result does not therefore negate significant treatment effects on component traits such as leaf area or chlorophyll status. This interpretation is supported by physiological work in Ashwagandha, where management treatments have produced differential responses among individual growth indices and pigment variables [24] . In the present study, the significant responses in canopy traits occurred mainly during early and middle stages, while treatment differences became less distinct as the crop approached maturity. The convergence among treatments at later stages may have reduced the magnitude of differences expressed in intervalbased indices. Thus, repeated observations are essential for identifying the period during which physiological regulation is most pronounced.
Relevance to Ashwagandha improvement and future research
Ashwagandha improvement involves the simultaneous consideration of genotype, agronomy and physiological performance. Genetic studies have documented considerable variation in morphological and chemical traits, while multienvironment evaluations have demonstrated the importance of genotype × environment interaction for yield and quality [18, 19, 27] . Molecular and genetic-diversity studies further emphasize the availability of diverse germplasm that can be exploited for crop improvement [28,29] . The present results add a crop-management dimension by showing that physiological expression can also be modified through exogenous growth regulation. Future studies should integrate repeated physiological measurements with direct photosynthetic measurements, chlorophyll fluorescence, and nutrient status and validated biochemical estimation of withanolides. Such an approach would help determine whether treatments that improve canopy traits also produce consistent changes in medicinal quality. Recent studies have linked seasonal and developmental variation with changes in productivity, photosynthetic pigments, gene expression and withanolide accumulation [26,30] . Integrating these measurements under field conditions would provide a stronger mechanistic basis for developing precise PGR recommendations.
Practical interpretation
Under the conditions of the present experiment, the results suggest three practical response profiles. TIBA at 50 ppm was associated primarily with accelerated phenological progression. IBA at 100 ppm was associated with stronger canopy development and maintenance of higher chlorophyll status across important growth stages. CCC at 250 ppm was associated with favourable mid-season canopy performance. These findings should be considered treatment-specific responses under the soil, climate and management conditions of Mandsaur and should be validated across additional seasons and locations before being translated into broad agronomic recommendations.
Conclusion
The present study demonstrated that plant growth regulators produced distinct, concentration-dependent and growthstage-specific responses in Ashwagandha. TIBA at 50 ppm consistently accelerated phenological development and required the minimum number of days for major developmental stages. IBA at 100 ppm was particularly effective in promoting early canopy development and maintaining higher chlorophyll status, whereas CCC at 250 ppm produced favourable responses during the active middle phase of crop growth. Leaf area, LAI, LAD and chlorophyll content showed significant treatment responses at selected stages, while SLA, CGR and RGR remained statistically non-significant. Overall, TIBA at 50 ppm may be useful where accelerated crop development is desired, while IBA at 100 ppm showed the most consistent advantage for canopy development and physiological leaf status under the conditions of this experiment.
Acknowledgement
AcknowledgementThe authors sincerely acknowledge the Department of Plantation, Spices, Medicinal and Aromatic Crops, KNK College of Horticulture, Mandsaur, Rajmata Vijayaraje Scindia Krishi Vishwavidyalaya, Gwalior, Madhya Pradesh, India, for providing facilities and support for conducting the research. The authors also acknowledge the contribution of faculty members, technical staff and field personnel involved in the experiment.
Figures and tables from the paper
| Treatment | Plant growth regulator | Concentration |
|---|---|---|
| T₁ | IBA | 100 ppm |
| T₂ | IBA | 150 ppm |
| T₃ | IBA | 200 ppm |
| T₄ | TIBA | 40 ppm |
| T₅ | TIBA | 50 ppm |
| T₆ | TIBA | 60 ppm |
| T₇ | CCC | 250 ppm |
| T₈ | CCC | 500 ppm |
| T₉ | CCC | 750 ppm |
| T₁₀ | Water spray | Control |
Table text extracted from the original PDF; superscript letters are shown inline. The original table image is below.
View original table image
| Treatment | 45–75 DAS | 75–105 DAS | 105–135 DAS | 135 DAS– Harvest |
|---|---|---|---|---|
| T₁ IBA 100 | 30.49 | 48.54 | 69.43 | 61.66 |
| T₂ IBA 150 | 30.2 | 46.8 | 61.88 | 57.35 |
| T₃ IBA 200 | 27.24 | 42.4 | 60.75 | 58.67 |
| T₄ TIBA 40 | 24.88 | 38.8 | 58.71 | 56.29 |
| T₅ TIBA 50 | 25.65 | 43.79 | 66.0 | 62.56 |
| T₆ TIBA 60 | 28.19 | 44.64 | 58.21 | 54.28 |
| T₇ CCC 250 | 29.0 | 50.13 | 67.05 | 55.83 |
| T₈ CCC 500 | 29.44 | 45.38 | 62.69 | 60.53 |
| T₉ CCC 750 | 24.84 | 42.45 | 52.23 | 50.81 |
| T₁₀ Control | 29.2 | 45.03 | 61.98 | 61.28 |
| S.Em.± | 0.75 | 1.08 | 1.2 | 3.66 |
| CD at 5% | 2.22 | 3.2 | NS | NS |
Table text extracted from the original PDF; superscript letters are shown inline. The original table image is below.
View original table image
| Treatment | 50% germination | 50% flowering | Physiological maturity | Physical maturity |
|---|---|---|---|---|
| T₁ IBA 100 | 12.67 | 76.33 | 135.67 | 154.0 |
| T₂ IBA 150 | 13.67 | 79.0 | 138.67 | 157.0 |
| T₃ IBA 200 | 13.67 | 79.33 | 139.0 | 159.67 |
| T₄ TIBA 40 | 13.0 | 76.33 | 134.0 | 156.67 |
| T₅ TIBA 50 | 11.33 | 72.67 | 131.0 | 151.33 |
| T₆ TIBA 60 | 12.33 | 75.33 | 132.33 | 153.67 |
| T₇ CCC 250 | 12.33 | 75.33 | 133.67 | 152.0 |
| T₈ CCC 500 | 13.67 | 78.0 | 136.0 | 158.67 |
| T₉ CCC 750 | 13.33 | 76.0 | 133.67 | 154.67 |
| T₁₀ Control | 13.67 | 77.0 | 137.67 | 155.33 |
| S.Em.± | 0.5 | 0.97 | 1.15 | 1.32 |
| CD at 5% | 1.49 | 2.87 | 3.42 | 3.92 |
Table text extracted from the original PDF; superscript letters are shown inline. The original table image is below.
View original table image
| Treatment | 45–75 DAS | 75–105 DAS | 105–135 DAS | 135 DAS– Harvest |
|---|---|---|---|---|
| T₁ IBA 100 | 390.54 | 293.19 | 285.21 | 274.02 |
| T₂ IBA 150 | 399.72 | 256.29 | 239.31 | 243.62 |
| T₃ IBA 200 | 340.57 | 257.19 | 255.59 | 235.71 |
| T₄ TIBA 40 | 313.88 | 233.28 | 248.49 | 237.08 |
| T₅ TIBA 50 | 392.88 | 241.93 | 268.41 | 264.68 |
| T₆ TIBA 60 | 381.46 | 237.07 | 218.93 | 235.42 |
| T₇ CCC 250 | 354.77 | 277.72 | 260.1 | 243.23 |
| T₈ CCC 500 | 371.44 | 279.14 | 264.29 | 268.08 |
| T₉ CCC 750 | 335.7 | 264.34 | 248.5 | 226.64 |
| T₁₀ Control | 373.35 | 284.67 | 271.14 | 252.08 |
| S.Em.± | 28.46 | 15.58 | 12.78 | 15.47 |
| CD at 5% | NS | NS | NS | NS |
Table text extracted from the original PDF; superscript letters are shown inline. The original table image is below.
View original table image
| Treatment | 45 DAS | 75 DAS | 105 DAS | 135 DAS | Harvest |
|---|---|---|---|---|---|
| T₁ IBA 100 | 527.33 | 1505.0 | 1731.0 | 2265.67 | 1845.0 |
| T₂ IBA 150 | 511.67 | 1501.67 | 1618.33 | 2020 | 1803.33 |
| T₃ IBA 200 | 510 | 1306 | 1520.67 | 2077.33 | 1834 |
| T₄ TIBA 40 | 492.67 | 1166 | 1420.33 | 2020 | 1732.67 |
| T₅ TIBA 50 | 440 | 1269.67 | 1649.33 | 2216.67 | 1953.67 |
| T₆ TIBA 60 | 445 | 1434 | 1542 | 1902 | 1716.67 |
| T₇ CCC 250 | 444.33 | 1489 | 1852.67 | 1936 | 1786 |
| T₈ CCC 500 | 473 | 1489.67 | 1535.67 | 2061.33 | 1974 |
| T₉ CCC 750 | 450.67 | 1205 | 1624.67 | 1452.33 | 1935 |
| T₁₀ Control | 510.33 | 1436 | 1565.67 | 2067.67 | 2017.33 |
| S.Em.± | 15.74 | 45.9 | 73.96 | 53.75 | 231.98 |
| CD at 5% | 46.76 | 136.38 | 306.36 | NS | NS |
Table text extracted from the original PDF; superscript letters are shown inline. The original table image is below.
View original table image
| Treatment | 45–75 DAS | 75–105 DAS | 105–135 DAS | 135 DAS–Harvest |
|---|---|---|---|---|
| T₁ IBA 100 | 0.48 | 0.14 | 0.04 | 0.04 |
| T₂ IBA 150 | 0.39 | 0.26 | 0.07 | 0.03 |
| T₃ IBA 200 | 0.37 | 0.22 | 0.1 | 0.04 |
| T₄ TIBA 40 | 0.41 | 0.17 | 0.06 | 0.04 |
| T₅ TIBA 50 | 0.5 | 0.16 | 0.06 | 0.07 |
| T₆ TIBA 60 | 0.5 | 0.11 | 0.11 | 0.08 |
| T₇ CCC 250 | 0.45 | 0.06 | 0.19 | 0.08 |
| T₈ CCC 500 | 0.39 | 0.14 | 0.14 | 0.04 |
| T₉ CCC 750 | 0.42 | 0.17 | 0.09 | 0.05 |
| T₁₀ Control | 0.45 | 0.12 | 0.08 | 0.04 |
| S.Em.± | 0.06 | 0.05 | 0.03 | As per corrected analysis |
| CD at 5% | NS | NS | NS | NS |
Table text extracted from the original PDF; superscript letters are shown inline. The original table image is below.
View original table image
| Treatment | 45–75 DAS | 75–105 DAS | 105–135 DAS | 135 DAS– Harvest |
|---|---|---|---|---|
| T₁ IBA 100 | 1.69 | 2.7 | 3.33 | 3.43 |
| T₂ IBA 150 | 1.68 | 2.6 | 3.03 | 3.19 |
| T₃ IBA 200 | 1.51 | 2.36 | 3.0 | 3.26 |
| T₄ TIBA 40 | 1.38 | 2.16 | 2.87 | 3.13 |
| T₅ TIBA 50 | 1.42 | 2.43 | 3.22 | 3.48 |
| T₆ TIBA 60 | 1.57 | 2.48 | 2.87 | 3.02 |
| T₇ CCC 250 | 1.61 | 2.78 | 3.16 | 3.1 |
| T₈ CCC 500 | 1.64 | 2.52 | 3.0 | 3.36 |
| T₉ CCC 750 | 1.38 | 2.36 | 2.56 | 2.82 |
| T₁₀ Control | 1.62 | 2.5 | 3.03 | 3.4 |
| S.Em.± | 0.04 | 0.06 | 0.08 | 0.2 |
| CD at 5% | 0.12 | 0.18 | 0.25 | NS |
Table text extracted from the original PDF; superscript letters are shown inline. The original table image is below.
View original table image
| Treatment | 45–75 DAS | 75–105 DAS | 105–135 DAS | 135 DAS– Harvest |
|---|---|---|---|---|
| T₁ IBA 100 | 0.0646 | 0.0078 | 0.0018 | 0.0027 |
| T₂ IBA 150 | 0.0683 | 0.0151 | 0.0033 | 0.0024 |
| T₃ IBA 200 | 0.0529 | 0.0136 | 0.0045 | 0.0025 |
| T₄ TIBA 40 | 0.0554 | 0.0106 | 0.0028 | 0.0026 |
| T₅ TIBA 50 | 0.0736 | 0.0083 | 0.0028 | 0.0043 |
| T₆ TIBA 60 | 0.0617 | 0.0058 | 0.0048 | 0.0047 |
| T₇ CCC 250 | 0.0545 | 0.0035 | 0.009 | 0.0048 |
| T₈ CCC 500 | 0.0478 | 0.0092 | 0.0066 | 0.0027 |
| T₉ CCC 750 | 0.0554 | 0.0094 | 0.0041 | 0.003 |
| T₁₀ Control | 0.0625 | 0.0069 | 0.004 | 0.028 |
| S.Em.± | 0.0058 | 0.0034 | 0.0014 | 0.0083 |
| CD at 5% | NS | NS | NS | NS |
Table text extracted from the original PDF; superscript letters are shown inline. The original table image is below.
View original table image
| Treatment | 45 DAS | 75 DAS | 105 DAS | 135 DAS | Harvest |
|---|---|---|---|---|---|
| T₁ IBA 100 | 66.79 | 77.52 | 82.67 | 44.67 | 20.0 |
| T₂ IBA 150 | 66.07 | 74.39 | 80.59 | 44.47 | 18.33 |
| T₃ IBA 200 | 58.71 | 63.71 | 66.24 | 37.42 | 14.0 |
| T₄ TIBA 40 | 67.83 | 71.81 | 74.82 | 42.0 | 18.0 |
| T₅ TIBA 50 | 64.61 | 71.49 | 74.39 | 40.8 | 17.67 |
| T₆ TIBA 60 | 55.7 | 62.05 | 65.38 | 36.17 | 13.33 |
| T₇ CCC 250 | 62.35 | 68.76 | 71.81 | 39.47 | 16.67 |
| T₈ CCC 500 | 58.75 | 65.83 | 69.33 | 38.33 | 14.17 |
| T₉ CCC 750 | 53.71 | 60.09 | 63.42 | 35.0 | 13.33 |
| T₁₀ Control | 52.51 | 59.37 | 62.89 | 32.67 | 12.67 |
| S.Em.± | 2.57 | 1.86 | 3.98 | 2.12 | 0.86 |
| CD at 5% | 7.62 | 5.53 | 11.85 | 6.29 | 2.54 |
Table text extracted from the original PDF; superscript letters are shown inline. The original table image is below.
View original table image
References
30 in the original paper- Tripathi AK, Shukla YN, Kumar S. Ashwagandha (Withania somnifera Dunal): a status report. J Med Aromat Plant Sci. 1996;18(1):46-62.
- Sharma R. Agro-techniques of medicinal plants. New Delhi: Daya Publishing House; 2004.
- Frick EM, Strader LC. Roles for IBA-derived auxin in plant development. J Exp Bot. 2018;69(2):169-177.
- Zolman BK, Yoder A, Bartel B. Genetic analysis of indole-3-butyric acid responses in Arabidopsis thaliana. Genetics. 2000;156:1323-1337.
- Cathey HM, Stuart NW. Comparative plant growthretarding activity of Amo-1618, Phosfon, and CCC. Bot Gaz. 1961;123(1):51-57.
- Watson DJ. Comparative physiological studies on the growth of field crops. I. Variation in net assimilation rate and leaf area between species and varieties, and within and between years. Ann Bot. 1947;11(41):41-76.
- Watson DJ. The physiological basis of variation in yield. Adv Agron. 1952;4:101-145.
- Radford PJ. Growth analysis formulae-their use and abuse. Crop Sci. 1967;7:171-175.
- Panse VG, Sukhatme PV. Statistical methods for agricultural workers. New Delhi: Indian Council of Agricultural Research; 1985.
- Gardner FP, Pearce RB, Mitchell RL. Physiology of crop plants. Ames (IA): Iowa State University Press; 1985.
- Beadle CL. Plant growth analysis. In: Coombs J, Hall DO, Long SP, Scurlock JMO, editors. Techniques in bioproductivity and photosynthesis. Oxford: Pergamon Press; 1985.
- Azimi MH, Bakhteyari F, Khalaj MA, Basaki T. Influence of Cycocel and salicylic acid on morphological and physiological characteristics of bluegrass sport mixture. Agric Commun. 2014;2(1):4348.
- Bhattarai P. Effects of plant growth regulators on growth and yield of pre-basic seed potato production under glasshouse condition. SAARC J Agric. 2017;15(1):149-160.
- Baskaran V, Misra RL, Abirami K. Effect of plant growth regulators on corm production in gladiolus. J Hortic Sci. 2009;4(1):78-80.
- Bhagya HP, Lalithya KA, Bharathi K. Influence of growth hormones and nodal cuttings on rooting of Vitex negundo. Indian J Agric Res. 2015;48(2):81-88.
- Kothari SK, Singh CP, Vijay Kumar Y, Singh K. Morphology, yield and quality of ashwagandha (Withania somnifera L. Dunal) roots and its cultivation economics as influenced by tillage depth and plant population density. J Hortic Sci Biotechnol. 2003;78(3):422-425.
- Kumar A, Venugopal S, Jnanesha AC, Lal RK. Agricultural-based challenges, genetic enhancement, and obstacles to an industrially important medicinal plant, ashwagandha (Withania somnifera (L.) Dunal): a review. Ecol Genet Genomics. 2023;28:100183.
- Srivastava A, Gupta AK, Shanker K, Gupta MM, Mishra R, Lal RK. Genetic variability, associations, and path analysis of chemical and morphological traits in Indian ginseng [Withania somnifera (L.) Dunal] for selection of higher yielding genotypes. J Ginseng Res. 2018;42(2):158-164.
- Kumar M, Patel M, Chauhan R, Tank C, Solanki S, Patel P, et al. Elucidation of genotype-environment interactions and genetic stability parameters for yield, quality and agromorphological traits in ashwagandha (Withania somnifera (L.) Dunal). J Genet. 2020;99:59.
- Kumar R, Reddy LPA, Kumar JV, Komaraiah K, Purnanand S, Sastry KP. Multivariate analysis and genetic diversity for morphometric and root textural quality traits in ashwagandha (Withania somnifera Dunal). Ind Crops Prod. 2012;35(1):199-202.
- Kukreti C, Rajwar GS, Uniyal PL. Effect of growth regulators on growth and yield of Withania somnifera Dunal. Med Plants Int J Phytomed Relat Ind. 2013;5(2):66-70.
- Patidar S, Meena KC, Naruka IS, Haldar A. Effect of plant growth hormones on growth and yield of ashwagandha (Withania somnifera L. Dunal). Int J Chem Stud. 2019;7(3):3621-3624.
- Barathkumar TR, Manivannan K. Influence of biofertilizers and plant growth regulators on growth, yield and alkaloid content of ashwagandha (Withania somnifera Dunal). J Pharmacogn Phytochem. 2018;7(Spec Issue 1):3202-3205.
- Ankad GM, Hiremath J, Patil RT, Pramod HJ, Hegde HV. Evaluation of Kunapa jala and Pancha gavya on plant quality, physiology, biochemistry, yield and growth attributesssa case study of Withania somnifera Dun. J Ayurveda Integr Med. 2017;8(4):247-251.
- Goud P, Nagre SP, Tiwari A, Tiwari G. Spraying plant growth regulators alters morphological yield attributes, productivity and root withanolides in Withania somnifera (L.) Dunal. Int J Adv Biochem Res. 2025;9(7):1040-1043. doi:10.33545/26174693.2025.v9.i7m.4879.
- Mishra B, Bose SK, Sangwan NS. Comparative investigation of therapeutic plant Withania somnifera for yield, productivity, withanolide content, and expression of pathway genes during contrasting seasons. Ind Crops Prod. 2020;154:112508. doi:10.1016/j.indcrop.2020.112508.
- Shasmita, Rai MK, Naik SK. Exploring plant tissue culture in Withania somnifera (L.) Dunal: in vitro propagation and secondary metabolite production. Crit Rev Biotechnol. 2018;38(6):836-850.
- Khabiya R, Choudhary GP, Sairkar P, Silawat N, Jnanesha AC, Kumar A, et al. Unraveling genetic diversity analysis of Indian ginseng (Withania somnifera (Linn.) Dunal): insight from RAPD and ISSR markers and implications for crop improvement vital for pharmacological and industrial potential. Ind Crops Prod. 2024;218:118124.
- Kaur K, Rani G, Widholm JM. Influence of plant growth regulators on callus mediated regeneration and secondary metabolites synthesis in Withania somnifera (L.) Dunal. Plant Cell Tissue Organ Cult. 2013;115:153-164.
- Ankad GM, Hiremath J, Patil RT, Pramod HJ, Hegde HV. Nutrient analysis of Kunapa jala and Pancha gavya and their evaluation on germination of ashwagandha and Kalamegha seeds: a comparative study. J Ayurveda Integr Med. 2018;9(1):13-19.