
Research article · 2026 · Full text
International Journal of Biology SciencesSocio-economic analysis of fish farmers with special reference to constraints in aquaculture practices in Nuapada district, Odisha
Volume 8(9) · Pages 01–05 · DOI: 10.33545/26649926.2026.v8.i9a.983 ↗
Research areasFisheries and Aquaculture StudiesAgricultural Systems and PracticesAgricultural Economics and Practices
Abstract
Author-writtenA comprehensive socio-economic survey of 130 inland fish farmers was conducted in the drought-prone Nuapada district of Odisha, India, to evaluate their socio-economic profile, identify critical constraints hindering aquaculture expansion, and establish empirical relationships between socio-economic parameters and farm productivity. Primary data were gathered through a pre-tested structured interview schedule administered across three randomly selected blocks. Pearson correlation analysis indicated that training exposure (r = 0.62, p < 0.01), pond size (r = 0.58, p < 0.01), and institutional credit access (r = 0.53, p < 0.01) exhibited the strongest positive and statistically significant relationships with fish productivity. Garrett's ranking technique identified water scarcity (mean score: 82.40) as the paramount operational constraint, followed by high commercial feed costs (78.60), poor quality seed supply (72.30), lack of extension and technical guidance (69.50), and market price volatility (65.20). The empirical findings revealed a mean fish productivity of 2,850 kg/ha/year and a mean annual net income of rupees 1,85,000 per aquaculture household. The study demonstrates that multi-pronged institutional support focusing on water harvesting infrastructure, quality input delivery, capacity building, and institutional credit is indispensable for transforming smallholder aquaculture into a sustainable and resilient rural livelihood strategy in drought-vulnerable agro-ecosystems.
Summary
Source-checkedPlain-language reading of the full paper, prepared with AI and checked against the text. Each point links to the authors' own words.
Why it matters
- Aquaculture is a rapidly growing global food sector that is critical for reducing rural poverty and improving food security by providing high-quality animal protein. View evidence ↗
- The Nuapada district in Odisha is an ecologically vulnerable area marked by rain-dependent agriculture and frequent drought cycles. View evidence ↗
- Inland aquaculture is seen as a strategic way to build rural resilience in Nuapada, but its growth is hindered by various institutional, socio-economic, and environmental obstacles. View evidence ↗
The question
- The study aimed to evaluate the socio-economic profiles of fish farmers in Nuapada, identify the main constraints to aquaculture expansion, and determine how socio-economic factors relate to farm productivity. View evidence ↗
What they did
- The researchers randomly selected 130 active inland fish farmers using sampling frames from local fishery extension officers. View evidence ↗
- Data were collected through face-to-face personal interviews using a pre-tested, standardized structured interview schedule. View evidence ↗
- The analysis employed descriptive statistics for profiling and Pearson's correlation coefficients to assess the relationship between socio-economic variables and productivity. View evidence ↗
- Garrett's ranking technique was used to prioritize the operational constraints reported by the farmers. View evidence ↗
What they found
- The average fish productivity in the district was 2,850 kg/ha/year, resulting in a mean annual net income of ₹1,85,000 per household. View evidence ↗
- Training exposure had the strongest positive correlation with fish productivity (r = 0.62), suggesting that skill development improves pond management and health practices. View evidence ↗
- Pond size (r = 0.58) and institutional credit access (r = 0.53) also showed significant positive correlations with productivity, reflecting economies of scale and better input procurement. View evidence ↗
- Water scarcity was identified as the most severe operational constraint, with a Garrett score of 82.40. View evidence ↗
- Other major constraints included high feed costs (78.60), poor seed quality (72.30), lack of extension contact (69.50), and market price volatility (65.20). View evidence ↗
What it means
- The authors recommend that policy interventions focus on decentralized seed rearing, local feed formulations, and short-duration species to move from subsistence to climate-resilient commercial aquaculture. View evidence ↗
- The authors conclude that establishing strong institutional credit links and capacity-building for youth are essential for sustainable growth and livelihood security in the region. View evidence ↗
Visual summary
2 visualsIllustrations explain the paper; charts are replotted from the paper's own table values.
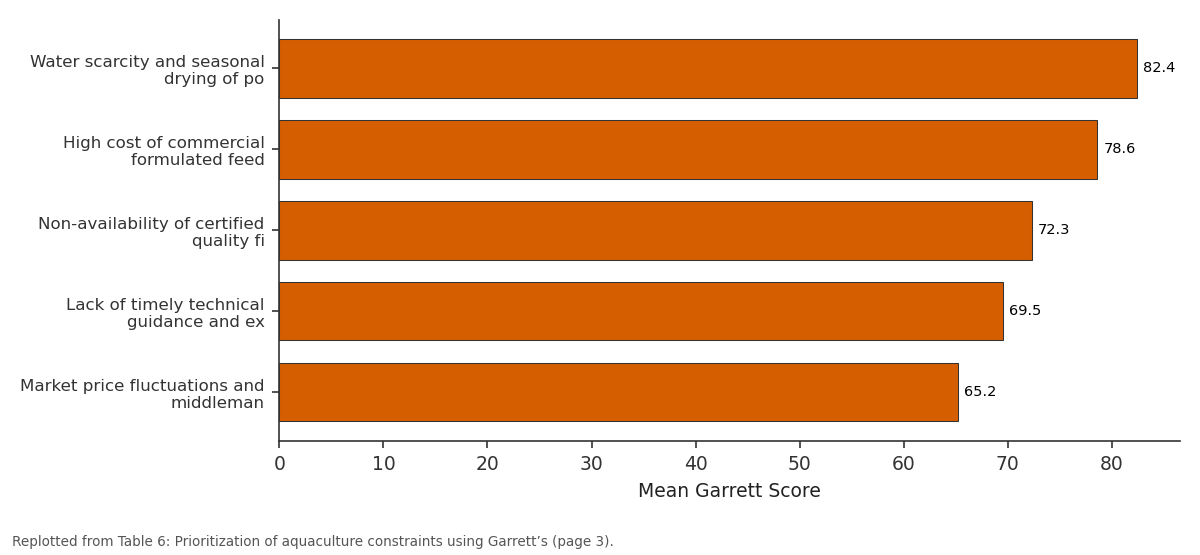
Mean Garrett Score: Water scarcity and... vs High cost of commercial... vs Non-availability of... vs Lack of timely... vs Market price...
Replotted from Table 6 (page 3) of the original paper. Every bar is the paper's own table value.
View source evidence ↗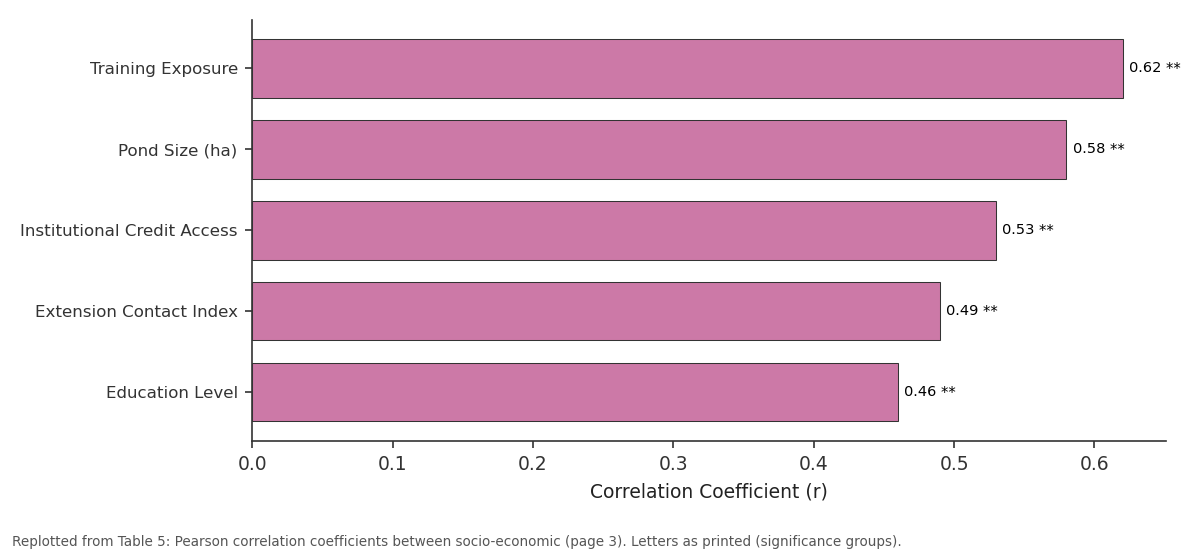
Correlation Coefficient (r): Training Exposure vs Pond Size (ha) vs Institutional Credit... vs Extension Contact Index vs Education Level
Replotted from Table 5 (page 3) of the original paper. Every bar is the paper's own table value.
View source evidence ↗Figures & tables
From the original paper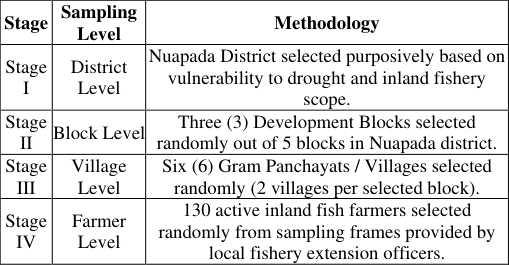 Table 1
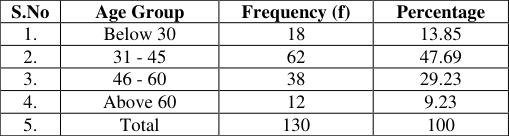 Table 2
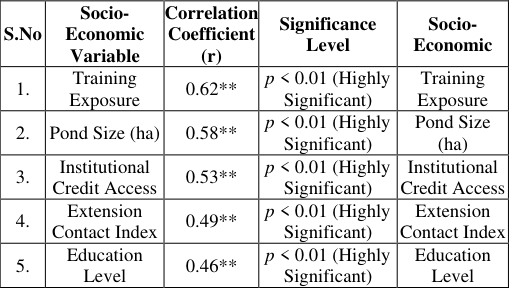 Table 5
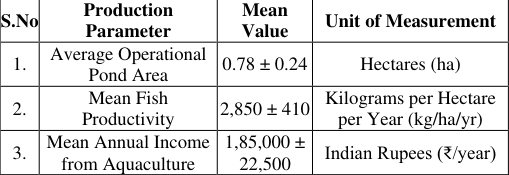 Table 3
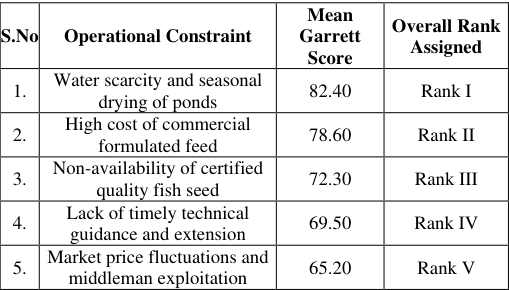 Table 6
Introduction
Aquaculture represents one of the fastest-growing food production sectors globally, playing a pivotal role in strengthening global food security, mitigating rural poverty, and offering highquality animal protein. According to the Food and Agriculture Organization (FAO, 2023) [14] , aquaculture currently supplies over 50% of the total fish destined for direct human consumption worldwide. In developing economies, small-scale freshwater fish farming provides vital opportunities for income diversification, employment generation, and socioeconomic empowerment among rural households (Ali & Hossain, 2022; Rahman et al., 2022) [3,30] . Because fish is exceptionally rich in bioavailable essential fatty acids, micronutrients, and essential amino acids, sustainable aquaculture development aligns directly with several United Nations Sustainable Development Goals (SDGs), notably SDG 1 (No Poverty), SDG 2 (Zero Hunger), and SDG 8 (Decent Work and Economic Growth) (Belton et al., 2020; Bene et al., 2021) [5,6] . India ranks second in global aquaculture production, with freshwater aquaculture constituting the major share of the inland sector (ICAR, 2022). Central government flagship programs, such as the Blue Revolution scheme and the Pradhan Mantri Matsya Sampada Yojana (PMMSY), have significantly propelled sector growth through capital subsidies, technological adoption, and infrastructure development. However, the spatial trajectory of aquaculture growth remains heterogeneous across states and ecological zones. Regionally backward, drought-prone, and rain-fed districts continue to face acute structural, socioeconomic, and environmental bottlenecks that hamper full realization of their aquaculture potential. Empirical literature underscores that socio-economic characteristics such as educational attainment, farming experience, land and pond holdings, credit accessibility, capacity building through training, and extension contact substantially dictate technology adoption, production efficiency, and overall farm profitability (Davis et al., 2021; Rao et al., 2021; Sharma et al., 2020) [11,31,33] . Smallholder farmers possessing enhanced institutional access are better positioned to adopt modern management practices and realize higher unit yields (Kumar et al., 2022; Singh et al., 2022b) [21,35] . Conversely, resource-poor farmers encounter persistent hurdles, including capital constraints, inflated input costs, poor quality seed stock, and weak market bargaining power (Nguyen & Nguyen, 2022; Sahoo & Jena, 2021) [26] . Superimposed on socio-economic vulnerabilities, climateinduced hazards pose severe threats to aquatic food production systems. Changing precipitation patterns, extended dry spells, and thermal stress severely disturb pond hydrodynamics, water quality, stocking densities, and fish growth rates (Campbell et [8,23] . Environmental stressors documented across freshwater aquatic ecosystems highlight that water quality degradation and water volume contraction lead to significant biological and productivity decline (Dar et al., 2022; Kassam, 2021; Tiwari & Singh, 2024) [9,20,37] . Odisha is recognized as one of India's primary fishproducing states; nevertheless, its western region including Nuapada district remains economically underdeveloped and ecologically vulnerable. Nuapada is characterized by frequent drought cycles, low irrigation coverage, and raindependent agriculture. While pond-based inland aquaculture has been identified as a strategic non-farm livelihood alternative for rural resilience in the district, its expansion is restricted by a complex web of environmental, socioeconomic, and institutional barriers (Das & Panda, 2023; Patel & Swain, 2023; Pradhan et al., 2024) [10,27,29] . Furthermore, modern intervention studies (e.g., biofloc technology and water conservation models) emphasize that intensive institutional handholding, structured training, and water management are critical to optimizing small-scale aquaculture operations (Ahmed & Thompson, 2019; Naylor et al., 2021 and World Bank, 2022) [2,25,39] .
Materials and Methods
Materials and Methods
Research Design
A combined descriptive and analytical cross-sectional research design was adopted. The descriptive framework was utilized to delineate the socio-demographic profile and operational practices of inland fish farmers, whereas the analytical component focused on evaluating bivariate correlations and ranking constraint severities using structured quantitative tools.
Study Area
The study was conducted in Nuapada district, situated in the western agro-climatic zone of Odisha, India. Nuapada lies between 20°0' N to 21°0' N latitude and 82°20' E to 82°53' E longitude. The district is characterized by a semi-arid, drought-prone climate, predominant reliance on monsoon rainfall, constrained irrigation networks, and marginal landholding patterns. Nuapada was purposively selected due to its high ecological vulnerability to drought and its promising, yet underutilized, potential for inland aquaculture development.
Sampling Procedure and Sample Size
A multi-stage random sampling strategy was implemented to select respondents across the administrative divisions of Nuapada district. The multi-stage sampling framework is detailed in Table 1.
Data Collection
Primary empirical data were gathered through face-to-face personal interviews using a standardized, pre-tested structured interview schedule. The schedule comprised distinct modules capturing socio-economic and demographic parameters, pond operational characteristics, production economics, institutional linkages, and operational constraints. Field pre-testing was conducted on 15 non-sample fish farmers to refine instrument clarity and construct validity. Secondary data were collated from official reports of the Department of Fisheries (Government of Odisha), District Statistical Handbooks, ICAR publications, and FAO reports.
Selection of Variables
The study incorporated key quantitative and categorical variables classified into independent and dependent parameters: first Independent Variables: Age (years), Education level (attainment categories), Family size (members), Landholding size (ha), Pond size (ha), Farming experience (years), Training exposure (days of formal training received), Extension contact index, and Access to institutional credit (dummy variable) and second is Dependent Variables: Annual fish productivity per unit area (kg/ha/year) and Net annual household income derived from aquaculture (rupees/year).
Statistical Analysis
Data were analyzed using descriptive statistics, means, and standard error for socio-economic profiling, Pearson's correlation coefficient to evaluate relationships with productivity.
Results and Discussion
Results and Discussion
Socio-Economic Profile of Inland Fish Farmers
Understanding the demographic composition of fish farmers is essential for designing targeted extension strategies. Table 2 presents the age distribution of the surveyed farmers. [16] , Biswas et al. (2018) [7] , and Adewuyi et al. (2010) [1] , who reported that the middle-aged cohort forms the dominant workforce in freshwater aquaculture due to their stability, risk-bearing capacity, and active decision-making authority in family enterprises. Similar demographic trends among inland fishers and farmers have also been documented by Moni and Khan (2014) [24] and Sujathkumar (1988) [36] . The relatively low participation of youth (13.85% below 30 years) indicates critical barriers to entry, such as limited access to capital, lack of independent land/water body ownership, and alternative preferences for immediate wage-earning opportunities or urban migration. As highlighted by Wetengere (2009) [38] , while younger individuals possess high energetic potential and innovativeness, structural constraints often impede their direct entrepreneurial involvement in farming The educational attainment level of respondents is summarized in Table 3. The educational profile indicates that 83.08% of fish farmers possessed formal literacy, with secondary education being the single largest category (35.38%), followed by primary schooling (30.77%). Higher secondary and tertiary educated farmers accounted for 16.92%, while 16.92% were illiterate. Operational parameters, productivity figures, and income realized from inland fish farming operations are summarized in Table 4. The mean operational pond size was 0.78 ha. The mean fish productivity achieved in the district stood at 2,850 kg/ha/year, yielding a mean annual net income of ₹1,85,000 per farming household. Farmers with access to formal training and institutional credit consistently achieved higher yields.
| S.No | Age Group | Frequency (f) | Percentage |
|---|---|---|---|
| 1. | Below 30 | 18 | 13.85 |
| 2. | 31 - 45 | 62 | 47.69 |
| 3. | 46 - 60 | 38 | 29.23 |
| 4. | Above 60 | 12 | 9.23 |
| 5. | Total | 130 | 100 |
Table text extracted from the original PDF; superscript letters are shown inline. The original table image is below.
View original table image
Correlation Analysis of Socio-Economic Determinants and Productivity
To evaluate the influence of socio-economic parameters on farm output, Pearson correlation coefficients were calculated between selected independent variables and fish productivity (kg/ha/year). Results are presented in Table 5.
Garrett's Constraint Ranking Analysis
Major operational, technical, and environmental constraints reported by respondents were prioritized using Henry Garrett's ranking technique (Table 6). [22] and Sathiadhas et al. (2003) [32] , demonstrating that institutional support and technical capacity are crucial drivers for enhancing yield and achieving economies of scale.
However, the realization of full production potential is severely impeded by seasonal water scarcity (Garrett score: 82.40) and escalating feed costs (78.60), which emerged as the topmost operational bottlenecks in Nuapada district. These constraints align with observations by Pradhan et al.
(2018) [28] and De et al. (2012) [12] who noted that climatic vulnerability, truncated culture cycles, and input inflation significantly compress farmer margins in rain-fed regions. Furthermore, high ranking of seed quality deficits and marketing exploitation (scores 72.30 and 65.20) mirrors the structural marketing and input-supply gaps reported by Aswathy et al. (2014) [4] . Addressing these interrelated constraints requires integrating short-duration culture species, localized feed formulations, and strengthened institutional extension linkages to optimize pond productivity under water-limited regimes.
Conclusion
The study demonstrates that inland fish farming in Nuapada district is predominantly sustained by middle-aged, economically active farmers whose productivity is significantly enhanced by training exposure, operational pond size, credit access, and extension contact. However, realizing the sector's full economic potential is severely constrained by seasonal water scarcity, high commercial feed costs, and inadequate supplies of certified seed stock.
To transition from subsistence to climate-resilient commercial aquaculture, policy interventions must prioritize developing decentralized seed rearing units, promoting costeffective local feed formulations, and introducing shortduration culture species. Additionally, establishing robust institutional credit links and youth-centric capacity-building initiatives will be vital to ensure long-term livelihood security and sustainable aquaculture growth in the region.
Acknowledgement
AcknowledgementsThe authors gratefully acknowledge the Department of Aquaculture, School of School, Sanjeev Agrawal Global Educational (SAGE) University Bhopal, India for providing the necessary facilities for conducting this research.
References
39 in the original paper- Adewuyi SA, Phillip BB, Ayinde IA, Akerele D. Analysis of profitability of fish farming in Ogun State, Nigeria. Journal of Human Ecology. 2010;31(3):179184. DOI:10.1080/09709274.2010.11906313.
- Ahmed N, Thompson S. The blue dimensions of aquaculture: Scale, intensification, and sustainability. Aquaculture International. 2019;27(1):1-20. DOI:10.1007/s10499-018-0318-x.
- Ali H, Hossain MA. Socio-economic factors affecting small-scale freshwater aquaculture in Bangladesh. Aquaculture Reports. 2022;23:101062. DOI:10.1016/j.aqrep.2022.101062.
- Aswathy N, Narayanakumar R, Sathiadhas R. Marketing costs, margins and efficiency of domestic marine fish marketing in Kerala. Indian Journal of Fisheries. 2014;61(2):97-102.
- Belton B, Bush SR, Little DC. Not just for the wealthy: Rethinking farmed fish consumption in the Global South. Global Food Security. 2020;26:100381. DOI:10.1016/j.gfs.2020.100381.
- Bene C, Arthur R, Norbury H, Allison EH, Beveridge M, Bush S, et al. Contribution of fisheries and aquaculture to food security and poverty reduction. World Development. 2021;79:177-196.
- Biswas B, Das SK, Mandal A. Socio-economic dimensions and their impacts upon productivity of composite fish farming in North 24 Parganas district, West Bengal. Journal of Interacademicia. 2018;22(1):41-49.
- Campbell BM, Thornton P, Zougmoré R. Climate-smart aquaculture and adaptive capacity building. Climate and Development. 2022;14(3):245-258.
- Dar RA, Dave K, Vyas V, Bhavsar A. Assessment of macrozoobenthic diversity in Parbati River, Madhya Pradesh, India. International Journal of Fauna and Biological Studies. 2022;9(3):35-40. DOI:10.22271/23940522.2022.v9.i3a.902.
- Das S, Panda D. Livelihood impacts of inland aquaculture on rural households in western Odisha, India. Journal of Rural Development. 2023;42(2):215228.
- Davis K, Ekboir J, Mekasha W. Strengthening agricultural extension systems: A review. Journal of Agricultural Education and Extension. 2021;27(2):123140.
- De HK, Saha GS, Radheyshyam. Constraints in aquaculture in Manipur. Journal of Community Mobilization and Sustainable Development. 2012;7(1):87-96.
- Dey MM, Rab MA, Jahan KM, Nisapa A, Kumar A, Ahmed M. Socioeconomic profile of fish farmers in Asia: Insights from household surveys. Aquaculture Economics & Management. 2005;9(1-2):65-88. DOI:10.1080/13657300590961528.
- Food and Agriculture Organization of the United Nations. The state of world fisheries and aquaculture 2023: Blue transformation in action. Rome: FAO; 2023.
- Garrett HE, Woodworth RS. Statistics in psychology and education. 6th ed. New York: David McKay Company; 1969.
- Gautam US, Pal PP, Arya HPS. Socio-economic profile of fish farmers and adoption of scientific fish culture practices in eastern Uttar Pradesh. Indian Research Journal of Extension Education. 2007;7(2-3):51-54.
- Goswami B, Choudhury H, Saikia P. Socio-economic status of fish farmers and adoption of aquaculture technologies in Assam. Journal of the Inland Fisheries Society of India. 2010;42(2):34-39.
- Indian Council of Agricultural Research. Handbook of inland fisheries and aquaculture development in India. New Delhi: ICAR; 2022.
- Intergovernmental Panel on Climate Change. Climate change 2023: Synthesis report. Contribution of Working Groups I, II and III to the Sixth Assessment Report of the Intergovernmental Panel on Climate Change. Geneva: IPCC; 2023.
- Kassam L. Water scarcity and inland fisheries productivity in Sub-Saharan Africa. Fisheries Management and Ecology. 2021;28(4):321-330.
- Kumar V, Jena JK, Sahoo SK. Technical efficiency in freshwater aquaculture: Evidence from eastern India. Aquaculture Economics & Management. 2022;26(4):402-417.
- Kumaran M, Ravichandran P, Gupta BP. Expert system for shrimp aquaculture: An ICT aided tool for knowledge management. Indian Journal of Fisheries. 2012;59(2):143-148.
- Mohanty SK, Behera BK, Rout SK. Climate variability and production risks in inland aquaculture systems of eastern India. Climate Risk Management. 2022;36:100421.
- Moni M, Khan MA. Socio-economic conditions of fishermen and fish farmers in Bangladesh. Asian Journal of Agricultural Extension, Economics & Sociology. 2014;3(5):450-461.
- Naylor RL, Hardy RW, Bureau DP. Feeding aquaculture in an era of finite resources. Proceedings of the National Academy of Sciences. 2021;118(1).
- Nguyen TT, Nguyen KA. Constraints and opportunities in freshwater aquaculture development in Vietnam. Aquaculture International. 2022;30(4):1849-1864.
- Patel D, Swain SK. Sustainability challenges of aquaculture practices in semi-arid regions of Odisha, India. Journal of Environmental Management. 2023;332:117370.
- Pradhan AK, Sarangi N, Mohapatra BC. Assessment of production and marketing constraints in freshwater aquaculture: A Garrett's ranking approach. Journal of Fisheries and Aquatic Science. 2018;13(2):85-92.
- Pradhan P, Sahoo S, Jena JK. Constraints in adoption of improved aquaculture practices in Odisha. Journal of Fisheries and Life Sciences. 2024;9(1):45-54.
- Rahman MM, Islam MS, Ahmed N. Livelihood vulnerability and resilience of inland fish farmers in South Asia. Aquaculture International. 2022;30(4):1779-1796.
- Rao BM, Reddy PV, Kumar KS. Determinants of aquaculture technology adoption in central India. Journal of Agricultural Extension and Rural Development. 2021;13(3):123-131.
- Sathiadhas R, Narayanakumar R, Aswathy N. Marine fish marketing in India: Key issues and strategies for development. Indian Journal of Agricultural Economics. 2003;58(3):583-592.
- Sharma R, Verma AK, Singh RK. Socio-economic status of inland fish farmers in eastern India. Journal of Fisheries Economics and Development. 2020;21(1):1-9.
- Singh A, Tiwari VK, Yadav DK. Assessment of smallholder aquaculture systems in eastern India. Aquaculture Studies. 2022;22(4).
- Singh P, Datta S, Sharma A. Institutional support and credit accessibility in small-scale aquaculture in India. Journal of Fisheries and Life Sciences. 2022;7(2):1524.
- Sujathkumar NV. Socio-economic condition of fish farmers and adoption of composite fish culture [master's thesis]. Coimbatore: Tamil Nadu Agricultural University; 1988.
- Tiwari R, Singh S. Climate-induced challenges and adaptation strategies in inland aquaculture systems of India. Environmental Challenges. 2024;14:100746.
- Wetengere K. Socio-economic factors affecting the adoption of fish farming in rural Tanzania. African Journal of Agricultural Research. 2009;4(4):312-322.
- World Bank. Blue economy for resilient growth in South Asia. Washington (DC): World Bank Publications; 2022.