
Research article · 2026 · Full text
International Journal of Geography Geology and EnvironmentSpatio-temporal dynamics of crop diversification in arid western Rajasthan, India: A district-level assessment
Volume 8(8) · Pages 146–156 · DOI: 10.22271/27067483.2026.v8.i8b.857 ↗
Research areasAgricultural Economics and PracticesClimate change impacts on agricultureAgriculture, Land Use, Rural Development
Abstract
Author-writtenArid western Rajasthan supports one of the most densely settled dryland farming populations in the world under severe moisture deficit and recurrent drought. Crop diversification is widely promoted across the region as an adaptation strategy, yet its recent spatial dynamics remain unquantified. This study assessed crop diversification across twelve arid districts using the Herfindahl Index computed from official crop-area statistics for 2012-13 and 2022-23, mapped within a geographic information system and analysed through correlation and multiple regression. The regional mean index was statistically unchanged, from 0.283 to 0.297, but dispersion widened sharply, with six districts diversifying and six concentrating. Growth in net irrigated area emerged as the strongest predictor of rising crop concentration, whereas rainfall showed no significant association. Irrigation expansion, particularly groundwater-based expansion, is therefore reorganising rather than diversifying arid cropping systems. Uniform diversification programmes should give way to district-specific strategies distinguishing mature canal commands from expanding groundwater frontiers.
Summary
Source-checkedPlain-language reading of the full paper, prepared with AI and checked against the text. Each point links to the authors' own words.
Why it matters
- Arid western Rajasthan is home to one of the world's most densely populated dryland farming communities, facing severe drought and moisture deficits. View evidence ↗
- While crop diversification is promoted as a way to adapt to these harsh conditions, the recent spatial changes in the region have not been quantified. View evidence ↗
- Diversifying crops helps buffer agricultural shocks because different species respond differently to heat, pests, and moisture deficits. View evidence ↗
The question
- The study aimed to quantify crop diversification across twelve arid districts of western Rajasthan for the years 2012-13 and 2022-23 using the Herfindahl Index. View evidence ↗
- The researchers sought to determine if changes in crop diversification were associated with rainfall variability or irrigation development. View evidence ↗
What they did
- The assessment was conducted across twelve specific districts in western Rajasthan, including Barmer, Bikaner, Churu, and others. View evidence ↗
- Data on crop area, net sown area, irrigation sources, and rainfall were sourced from the official Agricultural Statistics of Rajasthan for 2012-13 and 2022-23. View evidence ↗
- Diversification was categorized into five fixed classes, ranging from 'very high' (below 0.20) to 'very low' (0.40 and above). View evidence ↗
- The study used Pearson correlation and multiple linear regression to analyze the relationship between diversification changes and predictors like irrigation growth. View evidence ↗
What they found
- The regional mean diversification index remained statistically unchanged, moving only slightly from 0.283 to 0.297. View evidence ↗
- Despite a stable mean, the region polarized; the standard deviation increased by 39.3% and the variance nearly doubled, meaning districts became less alike. View evidence ↗
- The twelve districts split evenly, with six showing increased diversification and six showing increased crop concentration. View evidence ↗
- Irrigation expansion was positively correlated with rising crop concentration, explaining 36.2% of the variance in diversification changes. View evidence ↗
- Rainfall variables showed no significant association with either the final diversification index or the decadal change. View evidence ↗
- A combination of the baseline index and irrigation growth explained 66.4% of the variance in decadal diversification changes. View evidence ↗
What it means
- The authors conclude that irrigation and diversification policies must be integrated, as independent programs can work against each other. View evidence ↗
- The authors recommend that diversification programs be tailored to the specific trajectory of each district rather than applied uniformly. View evidence ↗
- Study limitations include a small sample size, the use of only two reference years, a lack of within-district resolution, and the correlational nature of the data. View evidence ↗
Visual summary
2 visualsIllustrations explain the paper; charts are replotted from the paper's own table values.
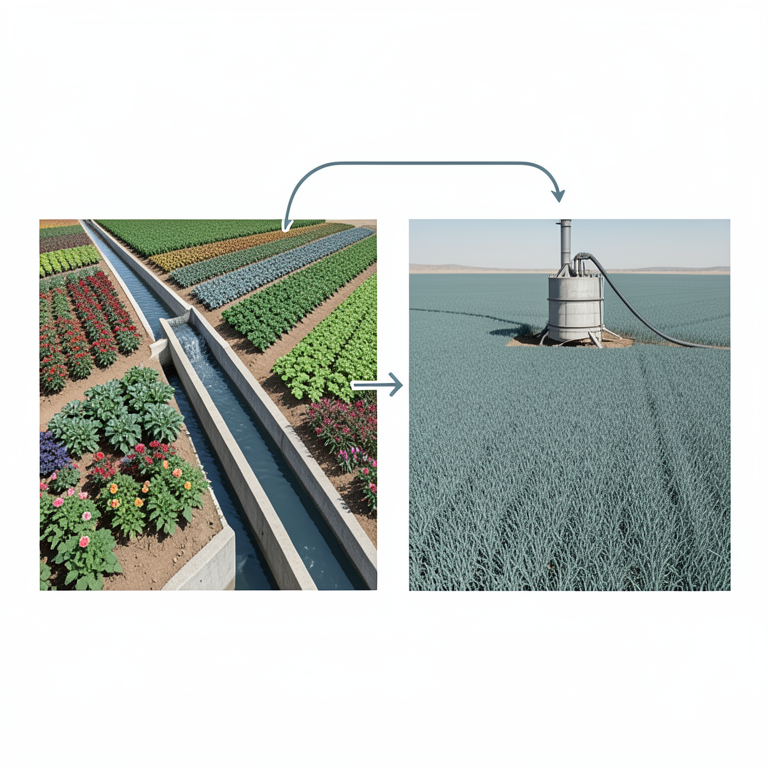
Irrigation Source vs. Diversification Trend
AI-generated conceptual illustration (Agricultural fields in arid western Rajasthan, India). It explains the idea and does not show study data.
View source evidence ↗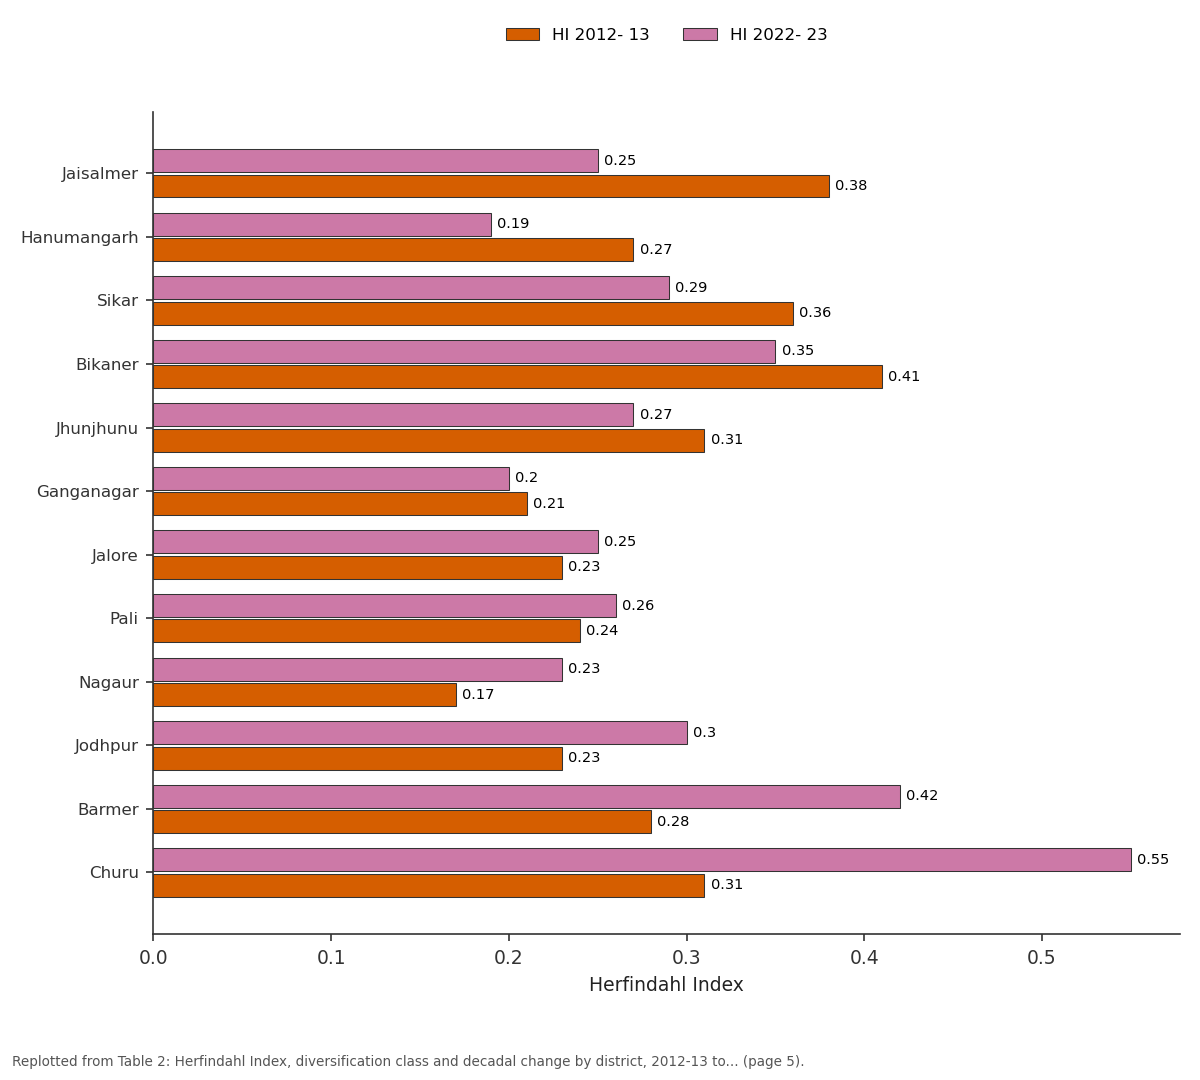
HI 2012- 13 and HI 2022- 23: Jaisalmer vs Hanumangarh vs Sikar vs Bikaner vs Jhunjhunu
Replotted from Table 2 (page 5) of the original paper. Every bar is the paper's own table value.
View source evidence ↗Figures & tables
From the original paper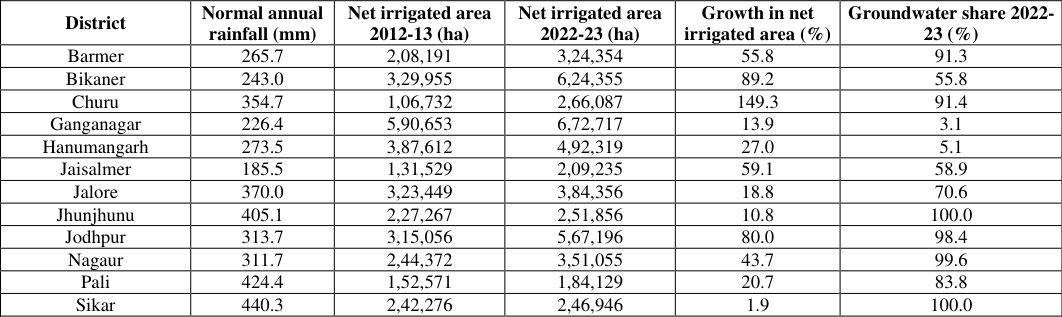 Table 1
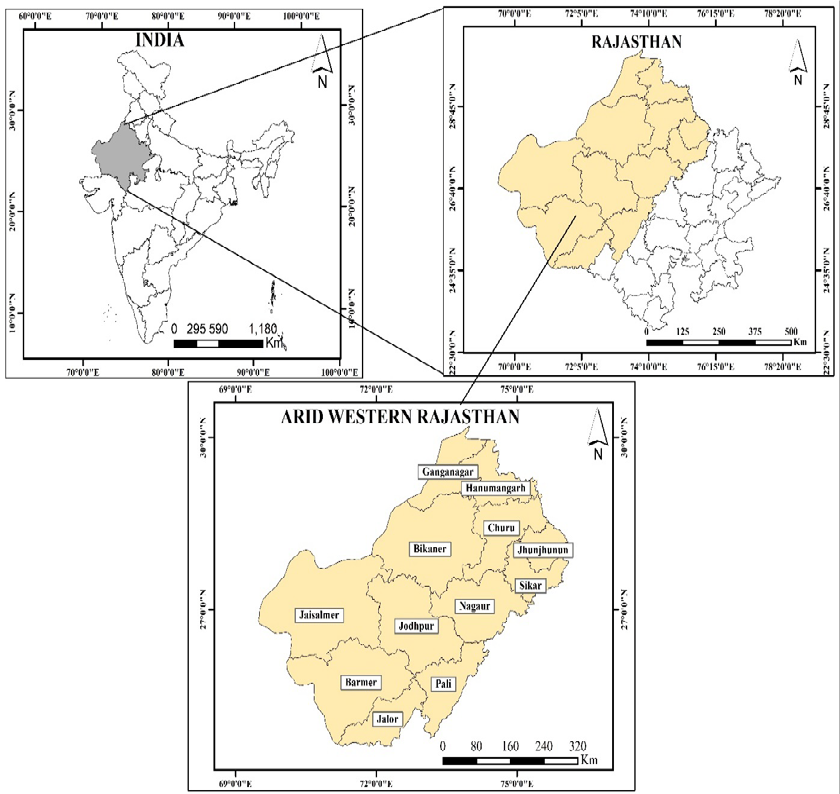 Figure 1
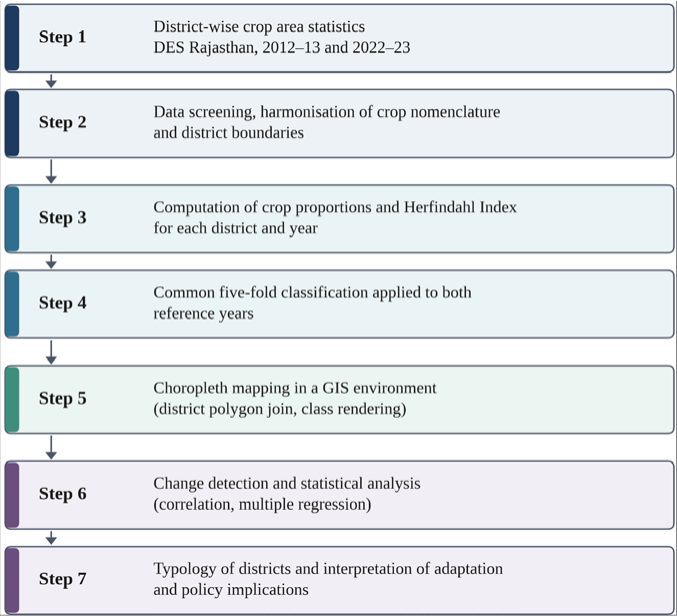 Figure 2
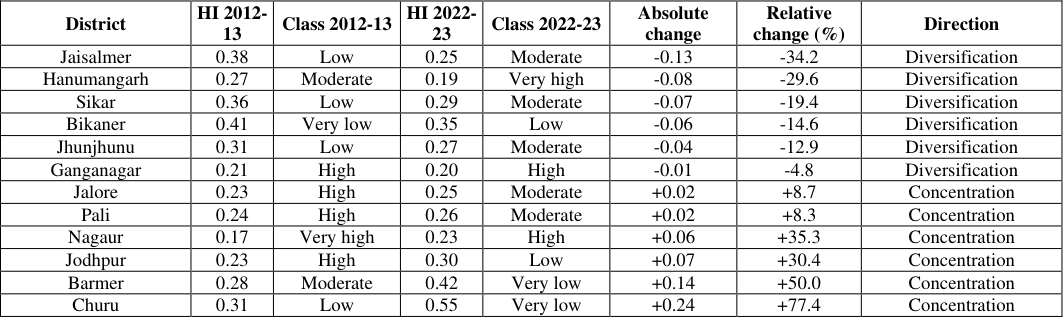 Table 2
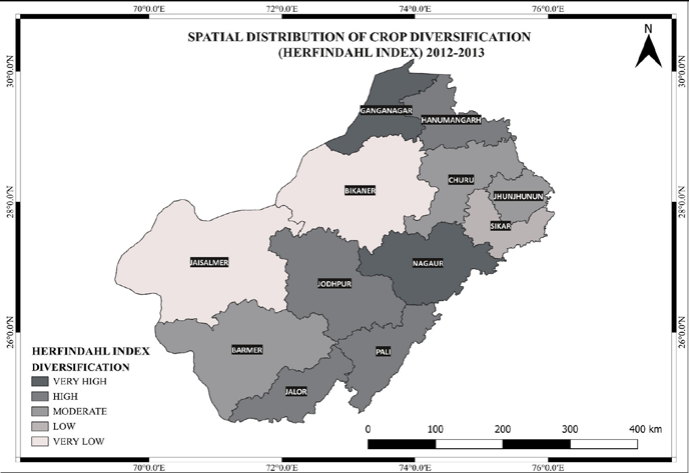 Figure 3
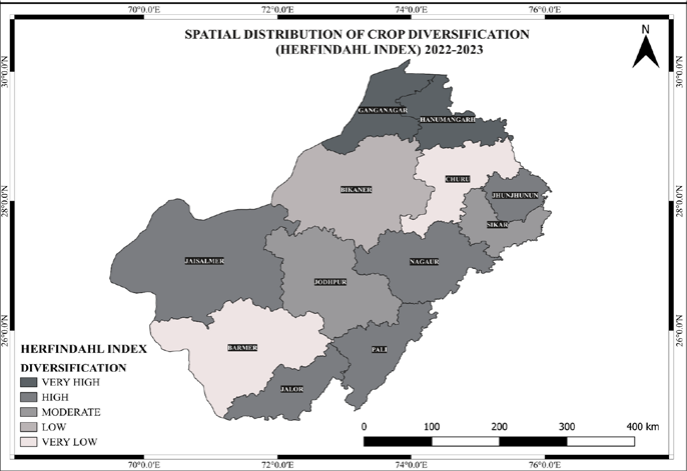 Figure 4
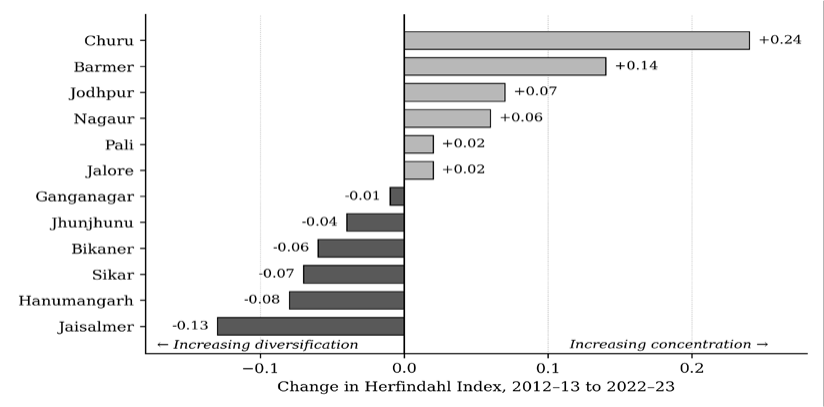 Figure 5
 Table 3
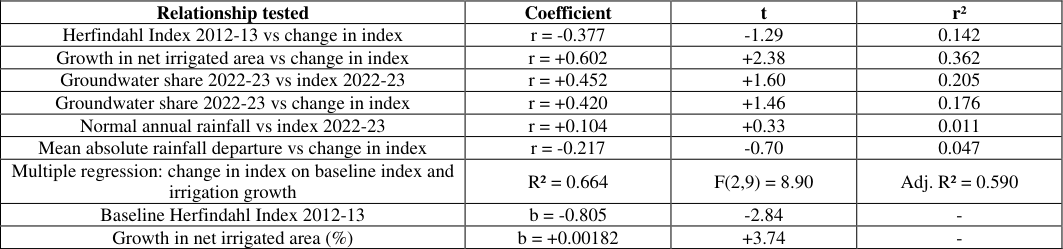 Table 4
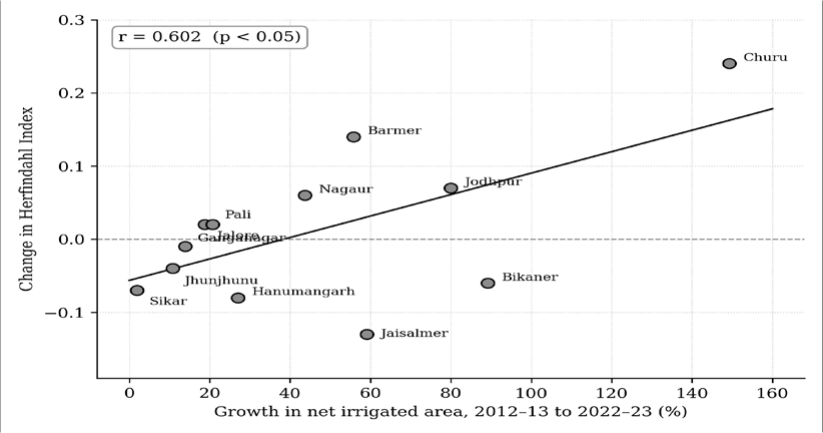 Figure 6
Introduction
Drylands occupy roughly two-fifths of the terrestrial surface and support a disproportionate share of the world's agriculturally dependent poor. Their defining constraint is not mean water availability but its variability, which rises as mean rainfall falls, so that the driest farming systems are also the least predictable. The Sixth Assessment Report of the Intergovernmental Panel on Climate Change (IPCC) [1] concludes with high confidence that warming has increased the frequency and intensity of agricultural drought in several regions, with South Asian systems facing compounding risks from heat extremes, altered monsoon behaviour and declining groundwater. For household's dependent on a single rainfed season, climate change is experienced as a rising probability of harvest failure rather than a gradual decline in expected yield. Crop diversification is among the most widely advocated responses to this risk. Distributing cultivated area among crops that differ in their sensitivity to heat, moisture deficit, pests and pathogens buffers shocks that would devastate any single species. Renard and Tilman [2] demonstrated across ninety-one nations that greater effective crop diversity yields markedly higher temporal stability of national harvests, and Bowles et al. [3] confirmed the same logic at field scale in long-term rotation trials, with the advantage of diversified systems widening as growing conditions deteriorate. Rasmussen et al. [4] further indicate that diversification delivers environmental and social benefits jointly rather than at each other's expense. The benefits are nonetheless conditional, and the global evidence base is unevenly distributed. Beillouin et al. [5] mapped the global evidence base systematically and found it strongly concentrated in temperate cereal systems, with arid small holder systems comparatively neglected. Where evidence from water-limited environments does exist, Gou et al. [6] show that diversified planting improves resource-use efficiency only where water delivery is reliable enough to sustain the additional crops. Diversification can also be carried too far: Adam and Abdulai [7] report that beyond an optimum, spreading scarce land, labour and capital across more crops raises rather than reduces income volatility. Blesh et al. [8] show that institutional and network position, rather than agronomic potential alone, determines whether diversification pathways open or close in a given locality. Diversification, in short, reflects resource endowment, infrastructure and market structure as much as adaptive intent. The literature on agricultural diversification began with the recognition by Joshi et al. [9] that liberalisation and rising incomes would shift resources from low-value staples toward high-value commodities. Barik and Bedamatta [10] show, from successive Agricultural Censuses, national crop concentration declined between 1990-91 and 2015-16 even as the number of states above the national average fell, indicating that aggregate diversification coexisted with intensifying regional specialisation. Chhatre et al. [11] demonstrate that diversification functions as an operational risk-management instrument in Indian agriculture, and Auffhammer and Carleton [12] show that it moderates the production consequences of weather shocks at district level. Birthal et al. [13] and Sharma and Shastri [14] converge on a common set of determinants irrigation access, market proximity, credit and institutional support rather than agroclimatic endowment alone, implying that diversification outcomes should track infrastructure more closely than climate. Arid western Rajasthan is an exacting setting in which to examine this proposition. Kumar et al. [15] note that the region carries a rural population density far above that of other hot deserts and operates under an evapotranspiration demand four to five times annual rainfall, against roughly twice in adjoining semi-arid tracts. Goyal et al. [16] model a one-degree rise in mean temperature as raising annual evapotranspiration demand by 35 to 96 mm across these districts, a 44 per cent increment in stress on utilisable groundwater at existing land use, while Kar [17] documents progressive conversion of grazing land to cultivation that has extended cropping onto marginal sandy substrates. Kaushik and Sharma [18] record that most agricultural households in the state's arid districts perceive long-term climatic change and report diversification, mixed cropping and rotation as their principal adaptive responses. Yet direct measurement of diversification remains sparse. Kaur and Singh [19] , in the closest antecedent study, applied concentration indices to oilseed crops across the same twelve districts to 2015-16, reporting moderate diversification with sustained rapeseed and mustard dominance, but were confined to a single crop group and interpreted spatial pattern visually rather than statistically. The decade since has seen substantial structural change: Kiran and Pramanik [20] record tubewell irrigation expanding faster than any other source in Rajasthan, with groundwater now supplying close to three-quarters of irrigated area; Moharana et al. [21] document irrigated rabi cropland in Jodhpur district rising from 7.6 to 21.3 per cent between 2000 and 2020 alongside groundwater declines of 11 to 45 metres; and Jain et al. [22] project that continued depletion will reduce cropping intensity even where irrigation infrastructure remains in place. Whether this transformation has widened or narrowed the regional crop portfolio has not been established, and the association between diversification and its presumed drivers has not been tested, with the result that irrigation expansion is treated as self-evidently adaptive. The present study addresses this gap through four objectives • To quantify crop diversification in each of the twelve arid districts of western Rajasthan for 2012-13 and 2022-23 using the Herfindahl Index. • To map and classify the resulting spatial patterns under a single classification scheme applicable to both years. • To measure the magnitude and direction of decadal change and identify the resulting district trajectories. • To test the association of that change with irrigation development and rainfall variability.
Materials and Methods
Materials and Methods
Study area
The study covers twelve districts of western Rajasthan Barmer, Bikaner, Churu, Ganganagar, Hanumangarh, Jaisalmer, Jalore, Jhunjhunu, Jodhpur, Nagaur, Pali and Sikar between approximately 24°-30°N latitude and 69°-76°E longitude (Fig. 1).
Data sources
Crop area, net sown area, source-wise net irrigated area and rainfall departure from normal were obtained for each district from the 2012-13 [23] and 2022-23 [24] volumes of Agricultural Statistics of Rajasthan (Directorate of Economics and Statistics, Government of Rajasthan), so that all quantities derive from one consistent statistical system. Nomenclature was harmonised across the two editions by combining finer categories where a heading in one year corresponded to two in the other, and crops recorded as nil in both years were excluded to prevent inflating the crop count. District boundaries were held at their shared pre-2023 configuration, unaffected by the subsequent reorganisation of Rajasthan.
Measurement of crop diversification
Crop diversification was measured using the Herfindahl Index [25] , computed for each district and year using Equation ( 1)
Where P i is the proportion of gross cropped area under the i th crop and N the number of crops. The index approaches zero as area is distributed evenly across many crops and reaches unity under complete specialisation. It is therefore inverse in direction: a rise between two dates denotes reduced diversification, not improvement. This convention is stated explicitly because misreading it reverses every substantive conclusion, and it is applied without exception throughout. The Herfindahl Index was preferred over entropy-based alternatives because it is the measure most widely used in the Indian diversification literature, is bounded and directly interpretable, and requires no weighting decision, making the computation fully reproducible from published area tables. Two limitations, common to all share-based concentration measures, are acknowledged: the index cannot attain its theoretical minimum for small crop counts, and it weights crops by area alone, so two districts may return identical values while differing in the agronomic character of their portfolios. Index values were assigned to five classes using a single fixed scheme applied identically to both years: very high diversification below 0.20, high from 0.20 to 0.249, moderate from 0.25 to 0.299, low from 0.30 to 0.399, and very low at 0.40 and above. Fixing class boundaries across time is a deliberate departure from common practice. Where classes are derived separately for each year, a district may change class without its index value changing at all, simply because the distribution around it has moved; a single absolute scheme ensures that any change in class reflects a change in the underlying cropping pattern.
Statistical and cartographic analysis
Change was computed as the arithmetic difference between the 2022-23 and 2012-13 index values. Convergence was assessed on two criteria [26] : sigma-convergence, from the standard deviation and coefficient of variation of the twelve district values in each year, and beta-convergence, from the correlation between the base-year index and subsequent change. Change in central tendency was tested using the paired-sample t test and the Wilcoxon signed-rank test, the latter because normality cannot be assumed at this sample size. Bivariate associations were quantified using the Pearson product-moment correlation coefficient, evaluated through the t statistic at ten degrees of freedom, for four explanatory variables: percentage growth in net irrigated area between the two dates; the share of net irrigated area supplied by wells and tubewells in 2022-23; normal annual rainfall; and mean absolute rainfall departure across the two reference years. Multiple linear regression was then estimated with change in the index as the dependent variable and the baseyear index and irrigation growth as predictors, evaluated through R², adjusted R², the F ratio and coefficient t statistics. Because a correlation computed on twelve observations is vulnerable to leverage, the irrigation relationship was additionally examined through a grouped comparison using the Mann-Whitney U test and Welch's unequal-variance t test. Given the sample size, results are interpreted as regional associations rather than causal estimates. Computation was performed in Python using the NumPy and SciPy libraries. District index values were joined to a district boundary layer and rendered as choropleth maps within a geographic information system using the fixed classification scheme, so that the two maps are directly comparable by colour class, with change symbolised on a diverging scheme centred on zero. Mapping was carried out in ArcMap 10.4 using a district boundary layer sourced from Survey of India and projected in GCS_WGS_1984. The complete analytical sequence is summarised in Fig. 2.
Source: Prepared by the authors
Decadal change and district trajectories
Six districts diversified and six concentrated over the decade, but the magnitudes were markedly asymmetric (Table 2, Fig. 5). The largest movement toward diversification occurred in Jaisalmer, whose index fell by 34.2 per cent of its base value, followed at decreasing magnitude by Hanumangarh, Sikar, Bikaner, Jhunjhunu and Ganganagar. The largest movement toward concentration occurred in Churu, where the index rose by 77.4 per cent by a considerable margin the most pronounced structural change recorded in the region followed by Barmer, Jodhpur, Nagaur, and Jalore and Pali. These trajectories support a four-fold classification of districts, proposed here from the observed decadal trajectories, carrying direct operational implications. Consolidated diversified systems, comprising the canalcommanded Ganganagar and Hanumangarh, remained in the two most diversified classes at both dates. Emerging diversifiers Jaisalmer, Bikaner, Sikar and Jhunjhunu began in the low or very low classes and moved toward the regional mean, through canal extension in the first two and stabilisation of a mature groundwater economy in the second two. Gradual concentrators, comprising Nagaur, Jodhpur, Jalore and Pali, began diversified and lost ground moderately as irrigation extended the rabi season. Rapid concentrators, Churu and Barmer, recorded the sharpest reduction in portfolio breadth in the region.
| District | HI 2012- 13 | Class 2012-13 | HI 2022- 23 | Class 2022-23 | Absolute change | Relative change (%) | Direction |
|---|---|---|---|---|---|---|---|
| Jaisalmer | 0.38 | Low | 0.25 | Moderate | -0.13 | -34.2 | Diversification |
| Hanumangarh | 0.27 | Moderate | 0.19 | Very high | -0.08 | -29.6 | Diversification |
| Sikar | 0.36 | Low | 0.29 | Moderate | -0.07 | -19.4 | Diversification |
| Bikaner | 0.41 | Very low | 0.35 | Low | -0.06 | -14.6 | Diversification |
| Jhunjhunu | 0.31 | Low | 0.27 | Moderate | -0.04 | -12.9 | Diversification |
| Ganganagar | 0.21 | High | 0.20 | High | -0.01 | -4.8 | Diversification |
| Jalore | 0.23 | High | 0.25 | Moderate | +0.02 | +8.7 | Concentration |
| Pali | 0.24 | High | 0.26 | Moderate | +0.02 | +8.3 | Concentration |
| Nagaur | 0.17 | Very high | 0.23 | High | +0.06 | +35.3 | Concentration |
| Jodhpur | 0.23 | High | 0.30 | Low | +0.07 | +30.4 | Concentration |
| Barmer | 0.28 | Moderate | 0.42 | Very low | +0.14 | +50.0 | Concentration |
| Churu | 0.31 | Low | 0.55 | Very low | +0.24 | +77.4 | Concentration |
Table text extracted from the original PDF; superscript letters are shown inline. The original table image is below.
View original table image
Regional polarisation beneath a stable mean
The distributional statistics clarify what happened at regional level (Table 3). The mean index rose only marginally, from 0.283 to 0.297, and neither the paired t test nor the Wilcoxon signed-rank test approaches significance. On the evidence of the mean alone, nothing of consequence occurred in arid western Rajasthan between 2012-13 and 2022-23. The dispersion statistics describe a different situation: the standard deviation rose by 39.3 per cent, the coefficient of variation from 25.78 to 34.30 per cent, and the observed range from 0.24 to 0.36, so that the variance very nearly doubled. On the sigma criterion the region diverged markedly; districts became substantially less alike in the structure of their cropping systems. The beta criterion returns a different signal. The correlation between the baseyear index and subsequent change was negative but short of conventional significance (Table 4), indicating a tendency for initially concentrated districts to diversify and initially diversified districts to concentrate. The 2012-13 pattern explains only about eleven per cent of the variance in the 2022-23 pattern, so regional structure was substantially reorganised rather than merely amplified. The coexistence of weak beta-convergence with strong sigma-divergence is explained by Churu and Barmer, both of which began near the regional mean and moved decisively toward concentration, widening dispersion without contradicting the general regression to the mean observed among the remaining districts. This structure has a direct precedent in the national findings of Barik and Bedamatta [10] , where the aggregate Herfindahl Index declined even as the number of states above the national average fell. The correspondence between a national-scale and a district-scale finding of this kind suggests that mean-based reporting systematically conceals divergence in Indian agricultural systems at whatever resolution it is applied. Had this study reported only the regional aggregate, it would have concluded that the decade was uneventful.
| Relationship tested | Coefficient | t | r² |
|---|---|---|---|
| Herfindahl Index 2012-13 vs change in index | r = -0.377 | -1.29 | 0.142 |
| Growth in net irrigated area vs change in index | r = +0.602 | +2.38 | 0.362 |
| Groundwater share 2022-23 vs index 2022-23 | r = +0.452 | +1.60 | 0.205 |
| Groundwater share 2022-23 vs change in index | r = +0.420 | +1.46 | 0.176 |
| Normal annual rainfall vs index 2022-23 | r = +0.104 | +0.33 | 0.011 |
| Mean absolute rainfall departure vs change in index | r = -0.217 | -0.70 | 0.047 |
| Multiple regression: change in index on baseline index and irrigation growth | R² = 0.664 | F(2,9) = 8.90 | Adj. R² = 0.590 |
| Baseline Herfindahl Index 2012-13 | b = -0.805 | -2.84 | - |
| Growth in net irrigated area (%) | b = +0.00182 | +3.74 | - |
Table text extracted from the original PDF; superscript letters are shown inline. The original table image is below.
View original table image
| Statistic | 2012-13 | 2022-23 | Change |
|---|---|---|---|
| Mean | 0.283 | 0.297 | +0.013 |
| Median | 0.275 | 0.265 | -0.010 |
| Standard deviation | 0.073 | 0.102 | +0.029 |
| Coefficient of variation (%) | 25.78 | 34.30 | +8.52 |
| Minimum | 0.17 (Nagaur) | 0.19 (Hanumangarh) | - |
| Maximum | 0.41 (Bikaner) | 0.55 (Churu) | - |
| Range | 0.24 | 0.36 | +0.12 |
| Variance ratio (2022-23 : 2012-13) | - | - | 1.94 |
Table text extracted from the original PDF; superscript letters are shown inline. The original table image is below.
View original table image
Irrigation expansion as the dominant correlate of change
Net irrigated area in the twelve districts expanded by 40.3 per cent over the decade, but very unevenly: Churu recorded the steepest expansion at 149.3 per cent, followed by Bikaner, Jodhpur, Jaisalmer and Barmer, while Sikar, Jhunjhunu and Ganganagar expanded by under 14 per cent, reflecting systems already close to their command or aquifer limits. The correlation between irrigation expansion and change in the Herfindahl Index is positive and statistically significant, explaining 36.2 per cent of the variance in decadal change (Table 4, Fig. 6). Districts that expanded irrigated area most rapidly were those in which crop concentration increased most sharply the opposite of the relationship assumed in most diversification policy, which treats irrigation as the enabling condition for a wider crop portfolio. The rank-order equivalent is weaker (rho = +0.364, p > 0.05), indicating that the linear coefficient is influenced appreciably by Churu, whose irrigation growth and index increase are both the largest in the dataset. The association is therefore carried substantially by districts at the upper end of the irrigation-growth distribution rather than representing a uniform gradient. A grouped comparison independent of any single district's position confirms the relationship: all four districts in which canal systems supplied forty per cent or more of net irrigated area in 2022-23 moved toward diversification (mean change -0.070), while the eight well and tubewell-dependent districts moved on average toward concentration (mean change +0.055), a difference significant on both tests applied (Mann-Whitney p = 0.028; Welch's t test p = 0.016). A parallel grouping by irrigation ratio rather than canal status produced a difference in the same direction but well short of significance (p = 0.149 and p = 0.130), indicating that what distinguishes the diversifying districts is an established surface command rather than the quantity of water applied. The share of net irrigated area drawn from wells and tubewells reinforces the finding without reaching significance, correlating positively with both the 2022-23 index and decadal change (Table 4). 4). Jaisalmer, the driest district, and Sikar, among the wettest, both diversified over the decade, while Barmer and Churu concentrated despite occupying different positions on the rainfall gradient. Barmer's case is particularly instructive: its index rose sharply even though rainfall moved from a 54.4 per cent deficit in 2012 to a 49.5 per cent surplus in 2022, so the change cannot be attributed to moisture conditions in the reference years. This negative result deserves interpretation rather than dismissal. Annual district rainfall totals suppress precisely those features of the monsoon that govern cropping decisions in arid systems onset date, within-season distribution and the length of dry spells during the critical growth window and a two-point design cannot detect a relationship operating over a moving multi-year window of accumulated experience. It is also possible that within an arid region the between-district range of long-run rainfall matters less for the crop portfolio than the presence or absence of irrigation infrastructure. The significant irrigation result taken together with the null rainfall result points toward this third reading, and is consistent with Birthal et al. [13] and Sharma and Shastri [14] , who identify infrastructure, credit and market access rather than climatic endowment as the operative constraints on diversification.
Multivariate explanation of decadal change
Regression of decadal change on the base-year index and irrigation growth together explains 66.4 per cent of the variance across the twelve districts, and both predictors are individually significant (Table 4). Two forces evidently acted simultaneously and in opposition. Districts beginning the decade with concentrated cropping systems tended to diversify, regression-to-the-mean effect implied by the negative base-year coefficient, while independently of starting position every ten percentage points of irrigation growth raised the concentration index by approximately 0.018. Where a district began highly concentrated and expanded irrigation moderately, as in Jaisalmer and Bikaner, the first effect prevailed; where a district began near the regional mean and expanded irrigation dramatically, as in Churu, the second prevailed and concentration accelerated.
A methodological caveat applies to this result. Because the baseline index is used both to define the outcome, change being the 2022-23 value minus the 2012-13 value, and as a predictor of that same outcome, part of the model's overall fit and the negative baseline coefficient reflect this structural, change-score relationship rather than a purely independent behavioural effect; the reported R² should therefore not be read as an independent causal explanatory power attributable to irrigation growth alone. The irrigationgrowth effect itself does not depend on this coupling: it is corroborated independently by the bivariate Pearson correlation (Table 4), by the canal-versus-groundwater grouped comparison using the Mann-Whitney U and Welch's t tests (Section 3.4), and by the qualitative contrast between mature canal commands and expanding groundwater frontiers developed below.
The mechanism linking irrigation expansion to crop concentration
The mechanism underlying this result is economic rather than agronomic. Under rainfed conditions the crop portfolio of an arid district is wide by necessity: pearl millet, moth bean, clusterbean, sesamum and fodder legumes are grown together because none is individually reliable, their differing responses to monsoon timing constituting a form of risk pooling. This is diversification as survival strategy rather than commercial choice. Assured irrigation removes that constraint. A farmer able to water a rabi crop faces a decisive comparison between the returns from mustard, wheat or cumin and those from the traditional kharif mixture, and area migrates toward whichever irrigated crop offers the best combination of price, procurement and agronomic fit. The portfolio contracts not because the cultivator has become less rational about risk but because irrigation has apparently reduced the risk that diversity previously managed.
The apparent quality of that reduction is the difficulty.
Where assurance derives from an aquifer drawn down faster than it recharges, the cultivator has substituted a diversified exposure to rainfall variability for a concentrated exposure to groundwater availability, commodity price and the energy cost of lifting water from increasing depth. Churu, which expanded net irrigated area by 149.3 per cent with 91.4 per cent of that area drawn from wells and tubewells, is the extreme case. Kiran and Pramanik [20] show that tubewell irrigation has faster than any other source in Rajasthan, with measurable water-table decline in highdensity districts; Moharana et al. [21] document groundwater declines of 11 to 45 metres in the Jodhpur tehsils where irrigated rabi area expanded most; and Jain et al. [22] project that continued depletion will reduce cropping intensity even where wells remain physically in place. The concentration documented here is therefore built on a resource base whose trajectory is known.
The contrast between the canal commands and the groundwater frontier clarifies that the relationship between irrigation and diversification is conditional on the stage and source of development rather than on its level. Ganganagar and Hanumangarh have the highest irrigation coverage in the region and the lowest concentration indices, yet their irrigated area grew comparatively little: their commands are essentially complete, water allocation is administratively determined rather than individually appropriable, and their cropping systems have had four decades to develop the rotational structure, market channels and processing infrastructure that a diverse portfolio requires. Jaisalmer illustrates the same principle in transition, its index falling by the largest margin in the dataset as canal extension broadened a crop set previously restricted by extreme aridity; Sur and Chauhan [27] document net primary productivity increases of up to seventy-eight per cent across parts of its command. Assured surface water in a mature or maturing command supports diversity; rapid, individually appropriated groundwater expansion does not. This finding runs against the expectation derived from the Indian irrigation literature more broadly, in which assured irrigation is associated with a narrowing crop portfolio, as in the wheat-paddy systems of the north-western plains. The reconciliation lies in the counterfactual: the relevant comparison for a canal district in this region is not a mature procurement-backed cereal system elsewhere but the adjacent rainfed districts, where cultivators face a far narrower feasible crop set because water is unreliable. Read that way, canal water in arid Rajasthan does not narrow the portfolio so much as widen the range of what can be grown at all. The result is also consistent with Gou et al. [6] , who find that diversified planting in arid irrigation districts improves resource-use efficiency only where water delivery is reliable, and with Blesh et al. [8] , who show that institutional position rather than agronomic potential governs which diversification pathways remain open.
Diversification, resilience and policy implications
The framing of diversification as a proxy for climate resilience requires qualification. The Herfindahl Index measures how cultivated area is distributed among crops, not yield stability, income variability, water productivity or recovery time after a shock. Diversity into crops with similar water and thermal requirements yields little buffering, so index values alone can overstate functional diversity; concentration supported by genuinely reliable supply, as in a mature canal command, is less hazardous than the same value supported by a declining aquifer; and diversification that spreads scarce land, labour and capital too thinly may, as Adam and Abdulai [7] report, raise rather than reduce income volatility. The portfolio mechanism linking crop diversity to production stability is nonetheless well established at national scale by Renard and Tilman [2] and at field scale by Bowles et al. [3] , so interpreting a rising index as a reduction in one component of adaptive capacity is reasonable, provided the claim is confined to that component. The present findings should therefore be read as identifying where portfolio-based buffering has weakened, and where direct measurement of yield and income stability should now be undertaken.
Three implications follow
First, diversification programmes should be targeted by district trajectory rather than administered uniformly: the four groups identified above require maintenance, support, early attention and immediate intervention respectively, and uniform provision across all twelve districts allocates resources in inverse proportion to need. Second, irrigation development and crop diversification policy must be designed jointly, since pursued independently they work against one another subsidised well-drilling and power supply raise the return to a single rabi crop while an adjacent programme urges cultivators to grow several. Conditioning irrigation support on croppingpattern criteria, differentiating power tariffs by crop water requirement, or extending procurement to pulses and coarse cereals at parity with mustard would remove the contradiction. Third, because Sharma and Shastri [14] show that diversification responds to landholding, mechanisation, credit and market access rather than agro-climatic endowment alone, instruments operating on credit, seed systems and output markets are likely to prove more effective in the concentrating districts than climateinformation instruments alone. Churu and Barmer, which combine low diversification with the fastest concentration in the region, require intervention addressing aquifer management and crop marketing together.
Limitations
Four limitations qualify these findings. The sample of twelve districts constrains statistical power, so associations of moderate strength fall short of significance and the regression should be read as descriptive of this region rather than a generalisable model. Two reference years establish net change but not trajectory, and neither was climatically neutral; a continuous annual series would permit trend estimation and separate structural change from year-specific response. District-scale analysis cannot resolve the withindistrict contrast between command, groundwater and rainfed tracts that is the fundamental unit of agricultural decisionmaking in this region. Finally, the analysis is correlational: the irrigation-concentration association is robust and mechanistically plausible, but causation cannot be established from these data, since districts with commercially attractive rabi crops may equally have attracted irrigation investment for that reason.
Conclusion
This study measured crop diversification across the twelve arid districts of western Rajasthan for 2012-13 and 2022-23 using the Herfindahl Index, mapped the results under a common classification within a geographic information system, and tested the association of decadal change with irrigation development and rainfall. Three findings emerge. The region did not diversify or concentrate as a whole; it polarised, the mean index moving by only 0.013 while dispersion widened by 39.3 per cent and the twelve districts divided evenly between diversifying and concentrating trajectories. Irrigation expansion, not rainfall, is the principal correlate of that divergence, and together with the base-year index accounts for 66.4 per cent of the variance in decadal change, whereas no rainfall variable shows a significant association. The relationship between irrigation and diversification is conditional on the maturity and source of the irrigation system, with mature canal commands sustaining the most diversified cropping in the region while rapidly expanding groundwater frontiers show the sharpest concentration. The scientific contribution is threefold: the first post-2015 district-level account of whole-system crop diversification for the Indian hot arid zone; statistical evidence that the region has diverged rather than converged in cropping structure; and identification of irrigation expansion, rather than climate variability, as the dominant proximate correlate of that divergence. Each of these findings depends on measuring the distribution of district values rather than their average, and would have been invisible to an analysis reporting regional means alone.
The principal policy implication is that irrigation development and crop diversification cannot be planned as independent programmes in this environment. Where irrigation rests on a declining aquifer and is accompanied by concentration into a single high-value rabi crop, the outcome is not adaptation but a transfer of risk from a variable, renewable source to a depleting, non-renewable one. Districts such as Churu, where concentration rose by 77.4 per cent alongside 149.3 per cent irrigation growth, require intervention addressing aquifer management and crop marketing together. Three lines of further work follow directly. A continuous annual series would permit trend and instability analysis and identify when individual district trajectories turned; formal spatial autocorrelation testing would establish whether the clustering described here is statistically significant; and linking district diversification to observed yield and income variability would convert the resilience interpretation from a theoretically grounded inference into a directly measured relationship. Until that step is taken, the distinction between genuine adaptation and its appearance in arid western Rajasthan will remain a matter of inference, and monitoring at district scale, reporting distributions rather than averages, remains the minimum requirement for telling the two apart.
Figures and tables from the paper
| District | Normal annual rainfall (mm) | Net irrigated area 2012-13 (ha) | Net irrigated area 2022-23 (ha) | Growth in net irrigated area (%) | Groundwater share 2022- 23 (%) |
|---|---|---|---|---|---|
| Barmer | 265.7 | 2,08,191 | 3,24,354 | 55.8 | 91.3 |
| Bikaner | 243.0 | 3,29,955 | 6,24,355 | 89.2 | 55.8 |
| Churu | 354.7 | 1,06,732 | 2,66,087 | 149.3 | 91.4 |
| Ganganagar | 226.4 | 5,90,653 | 6,72,717 | 13.9 | 3.1 |
| Hanumangarh | 273.5 | 3,87,612 | 4,92,319 | 27.0 | 5.1 |
| Jaisalmer | 185.5 | 1,31,529 | 2,09,235 | 59.1 | 58.9 |
| Jalore | 370.0 | 3,23,449 | 3,84,356 | 18.8 | 70.6 |
| Jhunjhunu | 405.1 | 2,27,267 | 2,51,856 | 10.8 | 100.0 |
| Jodhpur | 313.7 | 3,15,056 | 5,67,196 | 80.0 | 98.4 |
| Nagaur | 311.7 | 2,44,372 | 3,51,055 | 43.7 | 99.6 |
| Pali | 424.4 | 1,52,571 | 1,84,129 | 20.7 | 83.8 |
| Sikar | 440.3 | 2,42,276 | 2,46,946 | 1.9 | 100.0 |
Table text extracted from the original PDF; superscript letters are shown inline. The original table image is below.
View original table image
References
27 in the original paper- IPCC. Climate Change 2023: Synthesis Report. Contribution of Working Groups I, II and III to the Sixth Assessment Report of the Intergovernmental Panel on Climate Change. Geneva, Switzerland: IPCC; 2023. p. 35-115.
- Renard D, Tilman D. National food production stabilized by crop diversity. Nature. 2019;571(7764):257-260.
- Bowles TM, Mooshammer M, Socolar Y, Calderon F, Cavigelli MA, Culman SW, et al. Long-term evidence shows that crop-rotation diversification increases agricultural resilience to adverse growing conditions in North America. One Earth. 2020;2(3):284-293.
- Rasmussen LV, Grass I, Mehrabi Z, Smith OM, Bezner-Kerr R, Blesh J, et al. Joint environmental and social benefits from diversified agriculture. Science. 2024;384(6691):87-93.
- Beillouin D, Ben-Ari T, Makowski D. Evidence map of crop diversification strategies at the global scale. Environmental Research Letters. 2019;14(12):123001.
- Gou Z, Yin W, Asibi AE, Fan Z, Chai Q, Cao W. Improving the sustainability of cropping systems via diversified planting in arid irrigation areas. Agronomy for Sustainable Development. 2022;42:88.
- Adam B, Abdulai A. Heterogeneous impact of crop diversification on farm net returns and risk exposure: empirical evidence from Ghana. Canadian Journal of Agricultural Economics. 2024;72(2):1-24.
- Blesh J, Mehrabi Z, Wittman H, Kerr RB, James D, Madsen S, et al. Against the odds: network and institutional pathways enabling agricultural diversification. One Earth. 2023;6(5):479-491.
- Joshi PK, Gulati A, Birthal PS, Tewari L. Agriculture diversification in South Asia: patterns, determinants and policy implications. Economic and Political Weekly. 2004;39(24):2457-2467.
- Barik P, Bedamatta R. Crop diversification in India (1990-2016): implications for the eastern and northeastern states. Asia-Pacific Journal of Rural Development. 2024;34(1):53-76.
- Chhatre A, Devalkar S, Seshadri S. Crop diversification and risk management in Indian agriculture. Decision. 2016;43(2):167-179.
- Auffhammer M, Carleton TA. Regional crop diversity and weather shocks in India. Asian Development Review. 2018;35(2):113-130.
- Birthal PS, Jha AK, Joshi PK, Singh DK. Agricultural diversification in north-eastern region of India: implications for growth and equity. Indian Journal of Agricultural Economics. 2006;61(3):328-340.
- Sharma S, Shastri S. Unveiling patterns and drivers of agricultural diversification: empirical findings from farm households in Kaithal district of Haryana in India. International Journal of Social Economics. 2025;52(10):1447-1462.
- Kumar S, Das A, Whitbread AM, Jat ML. Transforming drylands: systems-based sustainable agriculture in arid western Rajasthan. In: Rathore MS, Partap T, Rathore LS, editors. Desert Ecosystems: Rescripting Development Paradigms. Cham: Springer; 2026. p. 51-74.
- Goyal RK, Saxena A, Moharana PC, Pandey CB. Crop water demand under climate change scenarios for western Rajasthan. Annals of Arid Zone. 2013;52(2):89-94.
- Kar A. Agricultural land use in arid western Rajasthan: resource exploitation and emerging issues. Agropedology. 2014;24:179-196.
- Kaushik G, Sharma K. Climate change and rural livelihoods: adaptation and vulnerability in Rajasthan. Global NEST Journal. 2015;17(1):41-49.
- Kaur S, Singh J. Changing cropping pattern of oilseed crops and its diversification: the case of Thar Desert, Rajasthan (1985-1986 to 2015-2016). OCL -Oilseeds and Fats, Crops and Lipids. 2023;30:13.
- Kiran, Pramanik S. Where is irrigation headed in the driest state of India? A spatio-temporal analysis of irrigation in Rajasthan, India. Irrigation and Drainage. 2026;75(1):228-249.
- Moharana PC, Gautam NN, Goyal RK, Panwar NR. Assessment of expanding irrigated rabi crop area in arid regions of Rajasthan and its impact on groundwater level using geospatial techniques. Journal of the Indian Society of Remote Sensing. 2025;53:1-16.
- Jain M, Fishman R, Mondal P, Galford GL, Bhattarai N, Naeem S, et al. Groundwater depletion will reduce cropping intensity in India. Science Advances. 2021;7(9):eabd2849.
- Directorate of Economics and Statistics. Agricultural Statistics of Rajasthan 2012-13. Jaipur: Department of Planning and Statistics, Government of Rajasthan; 2013. p. 1-105.
- Directorate of Economics and Statistics. Agricultural Statistics of Rajasthan 2022-23. Jaipur: Department of Planning and Statistics, Government of Rajasthan; 2023. p. 1-105.
- Herfindahl OC. Concentration in the U.S. Steel Industry [unpublished PhD dissertation]. New York: Columbia University; 1950.
- Sala-i-Martin X. The classical approach to convergence analysis. Economic Journal. 1996;106(437):1019-1036.
- Sur K, Chauhan P. Dynamic trend of land degradation/restoration along Indira Gandhi Canal command area in Jaisalmer district, Rajasthan, India: a case study. Environmental Earth Sciences. 2019;78:472.