
Research article · 2026 · Full text
International Journal of Advanced Chemistry ResearchStudy of serum copper levels and their correlation in obese patients with type 2 diabetes mellitus according to disease duration in the Iraq
Volume 8(8) · Pages 102–106 · DOI: 10.33545/26646781.2026.v8.i8b.736 ↗
Research areasTrace Elements in HealthMagnesium in Health and DiseaseHeavy Metal Exposure and Toxicity
Abstract
Author-writtenPurpose: This research examined blood and dietary Copper levels in obese T2DM patients and healthy controls. An analysis also determined which characteristics best predict metabolic regulation and serum Copper levels. Materials and Methods: Al-Diwaniyah General Hospital examined 60 diabetic patients from February to June 2026. Clinical examination diagnoses. 30 healthy people were controls. Results: Copper symbols reduced its involvement in type 2 diabetics. Table (2) Fig. (2) displays the mean ± SD serum Copper levels in mg/dl for normal control and diabetes patients type 2, along with biostatistician calculations and student t-tests. Significantly lower blood Copper levels in diabetes patients type 2 compared to the control group (p<0.0001). Conclusion: A pioneer study in AL-Diwaniyah tested serum glucose forms in diabetes (type 2) patients, including 60 females and 30 males aged 40-65 and 30 normal healthy controls aged 45-65. Measurements included these parameters: The glucose and copper (Cu) tests in this investigation revealed. A considerable serum glucose rise compared to healthy controls. A considerable drop in serum Cu compared to healthy controls, and no difference in copper levels between male and female diabetics.
Summary
Source-checkedPlain-language reading of the full paper, prepared with AI and checked against the text. Each point links to the authors' own words.
Why it matters
- Type 2 diabetes mellitus (T2DM) is a major public health concern due to its high frequency and long-term morbidity, with global cases projected to reach 1.31 billion by 2050. View evidence ↗
- Copper is an essential trace element for redox reactions and is believed to influence the development of diabetes through prooxidant processes. View evidence ↗
- Copper helps maintain insulin levels by activating insulin signaling and inhibiting the enzymes that break down extracellular insulin. View evidence ↗
The question
- The researchers sought to clarify the relationship between copper and diabetes to determine if copper supplementation could help prevent or improve diabetes caused by deficiency. View evidence ↗
What they did
- This cross-sectional study was conducted from February to June 2026 at AL-Diwaniyah teaching hospital, involving 60 diabetic patients and 30 healthy controls. View evidence ↗
- Serum copper levels were measured using Cobas Pure from blood samples obtained after a 10-hour fast, while fasting blood sugar (FBS) was determined via an automated approach. View evidence ↗
- The researchers used the Three Standard Deviation Rule (mean ± 3SD) to identify and manage outliers in the serum copper data. View evidence ↗
What they found
- Serum glucose levels were significantly higher in type 2 diabetic patients (11.92671 ± 5.201118 mmol/l) compared to healthy controls (5.2622 ± 0.654632 mmol/l), with p < 0.0001. View evidence ↗
- Serum copper levels were significantly lower in type 2 diabetic patients (142.565 ± 64.36792 µg/dl) than in healthy controls (204.8789 ± 73.60299 µg/dl), with p < 0.0001. View evidence ↗
- The study found no significant difference in serum copper levels between male and female patients with type 2 diabetes. View evidence ↗
- There was no statistically significant difference in serum copper levels between diabetic patients with a disease duration of less than 10 years (144.4592 ± 70.05322 µg/dl) and those with more than 10 years (138.493 ± 57.41321 µg/dl), with p = 0.0776. View evidence ↗
What it means
- The authors conclude that hypocupremia is prevalent in diabetic patients and recommend that copper level assessments be included in routine screenings. View evidence ↗
- The authors recommend a suggested daily dietary copper intake of 900 µg/day to prevent both deficiency and toxicity. View evidence ↗
- The authors state that randomized controlled trials are urgently needed to further clarify the association between copper and diabetes and establish clear outcomes. View evidence ↗
Figures & tables
From the original paper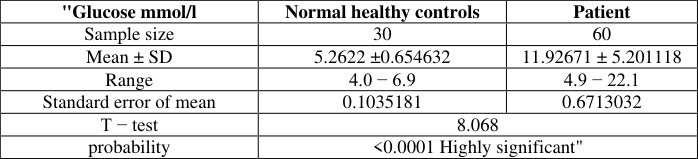 Table 1
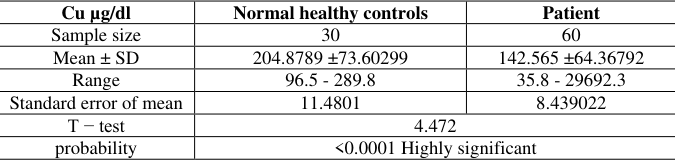 Table 2
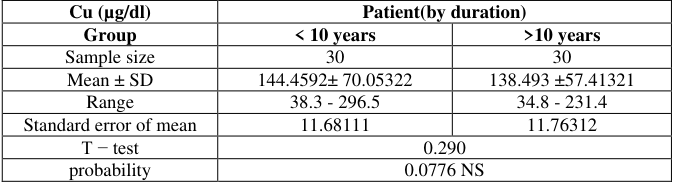 Table 3
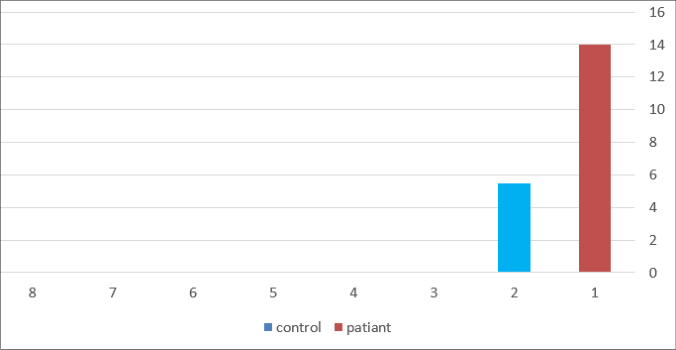 Figure 1
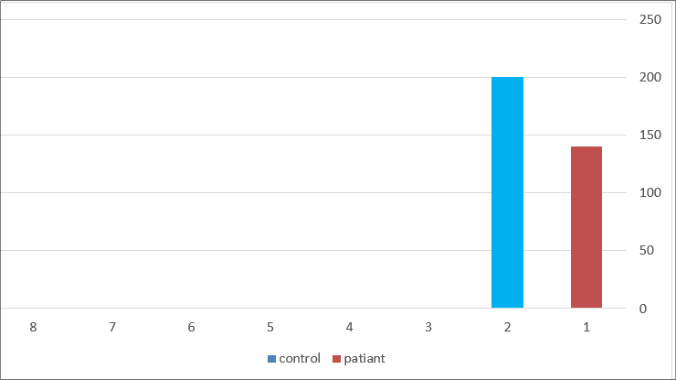 Figure 2
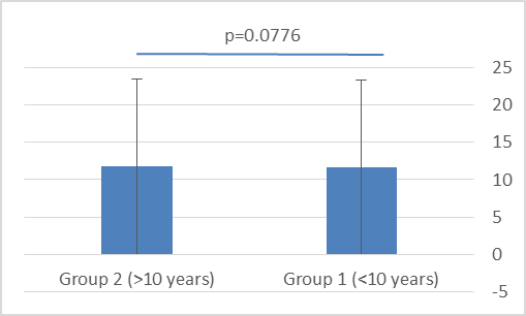 Figure 3
Introduction
Due to its increased frequency, long-term morbidity, and silent long-term effects, diabetes mellitus type 2 (DM2) is a severe public health [1] . Over 529 million people had diabetes in 2021, and 1.31 billion by 2050 [2] . Type 2 diabetes mellitus (T2DM) is common and characterised by beta-cell dysfunction and insulin resistance. Central nervous system pathways link obesity to type 2 diabetes. These pathways synthesise peripheral organ and environmental data to control food and energy intake [3] . Obesity increases insulin resistance, raising blood glucose and HbA1c [4] . Micronutrients including selenium (Se), zinc (Zn), copper (Cu), manganese (Mn), iodine (I), and iron (Fe) are essential for enzymatic reactions, signalling pathways, immunological responses, and metabolic activities. Zn transport into βcells is essential for insulin production, storage, and release. Changes in Zn levels may lead to reduced glucose-induced insulin response [5] . Copper (Cu) was demonstrated to play a role in the etiology of diabetes via prooxidant processes [6] . Copper is an essential trace element in redox reactions. Cellular defence against superoxide radicals requires enzymes like Cu/Zinc superoxide dismutase. Copper deficiencies may cause cardiac hypertrophy and vascular issues [7] .
Copper not only directly activates insulin signaling but also inhibits insulin-degrading enzymes (IDE), hence reducing the breakdown of extracellular insulin and boosting insulin levels [8] . Copper, a vital redox-active metal, is necessary for mitochondrial electron transport and many oxidase functions; yet, unregulated copper levels can exacerbate oxidative stress and disrupt insulin signaling [9] . Copper, a pro-oxidant, generates free radicals that may affect oxidative stress [10] . However, greater whole blood Cu levels raise the risk of obesity-related waist circumference. Catherine et al. found a serum Cu-abdominal obesity correlation. Rising Cu tertiles reduced the incidence of increased TGs [10] . Studies indicate a correlation between abnormalities of copper regulation and the onset of diabetes-related cardiomyopathy. An excess or lack of copper results in oxidative-reductive imbalances, stimulates inflammatory responses, and worsens diabetes-related cardiomyopathy [11] . Investigations on the association between copper and diabetes are few and yield equivocal findings, with existing studies presenting contradictory outcomes. This study seeks to elucidate existing studies on the relationship between copper and diabetes, so offering clinicians insights into the significance of copper supplementation for the improvement and/or prevention of diabetes resulting from copper deficiency. This study will assist researchers in obtaining proof regarding this association and promote additional inquiry in this domain.
Clinical manifestations of copper
Cellular transport, mitochondrial oxidative metabolism, neurotransmitter synthesis, and neurological and haematological system structure and function need copper. Many foods contain it, which the stomach and proximal duodenum absorb. Copper deficiency, often known as "swayback" or "enzootic ataxia," has been prevalent in animals, particularly ruminants. Recently discovered, acquired copper insufficiency causes myelopathy and neuropathy in humans. Clinically, copper insufficiency resembles mild combined degeneration from cobalamin deficiency.
Balance impairment, numbness, leg paraesthesia, and bilateral lower extremity weakness are common ambulation issues [12] . Elevated Cu concentration was detected at the RPE/choroid and RIS/OLM within the retinal layer. Cu was previously shown to participate in neurotransmission inside the plexiform layer. Copper deficiency is documented to induce neuropathy, as well as diminished eyesight and participation of the optic nerve [13] .
Patients and Methods
This cross-sectional research examined outpatient diabetes patients at AL-Diwaniyah teaching hospital and diabetic center lab from February to June 2026. The research addressed 60 cases (60 patients and 30 controls). Each patient gave a brief history before submitting samples. We divided our patients into two groups for serum blood sugar and Copper measurements based on age, gender, weight, height, and diabetes mellitus. 60 diabetic cases 30 male, 30 female, and 30 control patients.
Data collection
Fasting for almost 10 hours yielded 8 mL of venous blood under aseptic conditions. Six millilitres of blood went into EDTA tubes and two into gel separator tubes. An automated approach determined (F.B.S) from the EDTA tube sample. Spin the gel separator tubes at 3000 rpm for 5 minutes to obtain the serum. Calculating serum Copper levels using Cobas Pure. A technician verified the findings. Each patient's profile comprised serum Copper levels below 0.011 to 0.005 mmol/L and infection duration diabetes. Created and saved worksheet with complete data.
Management of Outliers
We utilized the prevalent Three Standard Deviation Rule (mean ±3SD) to detect probable outliers in serum copper content, an approach appropriate for our approximately normally distributed data.
Results
Table shows the relevance of glucose indicators in type 2 diabetes. (1) and Fig. (1) show the mean ± SD blood glucose concentrations in mmol/L for normal controls and type 2 diabetes patients, together with biostatistical analysis and ttest.
There is a notable elevation in serum glucose levels among type 2 diabetic patients relative to the control group (p <0.0001).
Copper symbols were less important in type 2 diabetics. Table (2) and Figure (2) showcase blood copper concentrations (µg/dl) for normal controls and type 2 diabetes patients, together with biostatistical analysis and Student's t-test. A reduction in serum copper concentration is seen in type 2 diabetic patients relative to the control group (p<0.0001). There is a no significant correlation between serum glucose levels in diabetic patients and the duration of the disease between patients (duration <10) & (duration > 10) years as shown in Table (3) and, Figure (3) Biostatistical calculation and study t-test for copper level mg\dl in serum of diabetic patient and Normal healthy (controls).
Statistical Analysis
All data is in an Excel sheet. Analysing all data will need statistical analysis.
Discussion
Type 2 Diabetes Mellitus (T2DM) and obesity are two of the worst public health challenges of the 21st century, affecting 537 million and 890 million people, respectively [14] . Other metabolic processes including insulin secretion depend on trace minerals. Essential trace elements, crucial for life, and non-essential minerals. Trace elements, important micronutrients, are essential to metabolic function, but persistent imbalances either excess or deficiency can cause health problems including type 2 diabetes [15] . Copper is a bimetal in enzymes involved in oxidative phosphorylation, iron transport, and oxidative stress, which may affect insulin metabolism and cause chronic diseases [16] . Metabolic stress may cause concurrent diseases like diabetes. Copper's role in glutamic acid decarboxylase (GAD), a beta cell antioxidant affected by reactive oxygen species (ROS), may also explain the link between copper and hyperglycemia [17] . This research examined the relationship between copper levels and diabetes development and control over time. The findings of this paper demonstrate a markedly significant elevation in serum glucose levels in diabetic patients compared to normal healthy controls. (p<0.0001) as illustrated in Table ( 1) Figure (1). No significant difference in copper levels has been identified in individuals with type 2 diabetes, regardless of gender (male or female), as illustrated in Table (2) and Figure (2). The findings of this study demonstrate a statistically significant reduction in serum copper levels in patients with type 2 diabetes compared to the normal control group aaccording to Disease Duration (duration <10) & (duration > 10) years (p<0.0001), as illustrated in Table (3) and the accompanying figure . (3) These findings have been consistent.
Conclusion
The concentration of serum Cu2+ is positively related to the development rate of Type 2 diabetes. Our recent investigations on patients from AL-Diwaniyah City indicate that copper (Cu2+) levels are not correlated with gender, age, weight, or height. The fasting blood sugar test yields precise results and serves as an effective instrument for diagnosing diabetes; copper (Cu2+) deficiency is prevalent among patients with T2DM. Individuals infected for ten years or more exhibit a pronounced insufficiency in copper (Cu2+) levels compared to those infected for less than ten years. Utilizing supplements as prescribed by physicians to lessen the worsening effects of copper (Cu²⁺) deficiency in certain patients especially in cases of kidney disease and malnourishment, or in cases of absorption issues or alterations in copper-transporting proteins like ceruloplasmin while considering factors that may raise copper levels in patients with type 2 diabetes in cases of oxidative stress and inflammation, as well as improving insulin sensitivity. Copper deficiency in the blood is linked to poor blood sugar regulation, which results in kidney problems and malabsorption, according to this study of type 2 diabetes patients. This study indicates a notable prevalence of Hypocupremia among individuals with diabetes, suggesting that the assessment of copper (Cu2+) levels should be incorporated into routine screening, especially for those with a history of Hypocupremia, older age, prolonged diabetes duration, and compromised glycemic control. To conclude, the physiological efficacy of copper is determined by its concentration. It reveals a dual effect, operating as an antioxidant within optimum quantities and as an oxidizing agent when concentrations are heightened. The study's outcomes related to the link between copper ingestion and the potential for diabetes are perplexing. Yet, in crafting dietary directives for copper, it is important to take into consideration variances in individual consumption patterns. To avoid deficiency or toxicity, individuals need to ensure they consume an adequate amount of dietary copper, meeting the suggested daily intake of 900 µg/day. It is important to stress the peril of copper toxicity, mostly caused by dietary supplements. For patients experiencing a serious copper shortage and unable to secure enough dietary intake, supplementation may be warranted. Supplementary research, especially randomized controlled trials, is urgently needed to enable investigators to clarify this association and establish clear outcomes.
Figures and tables from the paper
| "Glucose mmol/l | Normal healthy controls | Patient |
|---|---|---|
| Sample size | 30 | 60 |
| Mean ± SD | 5.2622 ±0.654632 | 11.92671 ± 5.201118 |
| Range | 4.0 − 6.9 | 4.9 − 22.1 |
| Standard error of mean | 0.1035181 | 0.6713032 |
| T − test | 8.068 | |
| probability | <0.0001 Highly significant" |
Table text extracted from the original PDF; superscript letters are shown inline. The original table image is below.
View original table image
| Cu µg/dl | Normal healthy controls | Patient |
|---|---|---|
| Sample size | 30 | 60 |
| Mean ± SD | 204.8789 ±73.60299 | 142.565 ±64.36792 |
| Range | 96.5 - 289.8 | 35.8 - 29692.3 |
| Standard error of mean | 11.4801 | 8.439022 |
| T − test | 4.472 | |
| probability | <0.0001 Highly significant |
Table text extracted from the original PDF; superscript letters are shown inline. The original table image is below.
View original table image
| Cu (µg/dl) | Patient(by duration) | — |
|---|---|---|
| Group | < 10 years | >10 years |
| Sample size | 30 | 30 |
| Mean ± SD | 144.4592± 70.05322 | 138.493 ±57.41321 |
| Range | 38.3 - 296.5 | 34.8 - 231.4 |
| Standard error of mean | 11.68111 | 11.76312 |
| T − test | 0.290 | |
| probability | 0.0776 NS |
Table text extracted from the original PDF; superscript letters are shown inline. The original table image is below.
View original table image
References
17 in the original paper- Abusalah MAH, et al. Prevalence of type 2 diabetes mellitus in the general population of Saudi Arabia, 2000-2020: a systematic review and meta-analysis of observational studies. Saudi J Med Med Sci. 2023;11(1):1-10.
- Qiu Y, Yang Y, Liu W, Wu Z. Anisotropic photonic crystal hydrogel array for naked-eye visual pH and glucose sensing. Microchem J. 2026:118423.
- Młynarska E, et al. Type 2 diabetes mellitus: new pathogenetic mechanisms, treatment and the most important complications. Int J Mol Sci. 2025;26(3):1094.
- Deng L, Jia L, Wu XL, Cheng M. Association between body mass index and glycemic control in type 2 diabetes mellitus: a cross-sectional study. Diabetes Metab Syndr Obes. 2025:555-563.
- Eroglu B, et al. Trace elements and risk of diabetesrelated vascular complications: results from the EPICPotsdam cohort study. Cardiovasc Diabetol. 2025;24(1):302.
- Samadi A, et al. Zinc, copper, and oxysterol levels in patients with type 1 and type 2 diabetes mellitus. Clin Nutr. 2020;39(6):1849-1856.
- Tan PY, Roy MS. Dietary copper and selenium are associated with insulin resistance in overweight and obese Malaysian adults. Nutr Res. 2021;93:38-47.
- Sun Z, et al. The link between trace metal elements and glucose metabolism: evidence from zinc, copper, iron, and manganese-mediated metabolic regulation. Metabolites. 2023;13(10):1048.
- Sarıkaya U, Selek Ş, Sarıkaya A. Serum zinc, copper, and the Zn/Cu ratio across the glycemic spectrum: evidence from an automated clinical chemistry platform. Clin Biochem. 2026:111097.
- Escobedo-Monge MF, Barrado E, Parodi-Román J, Escobedo-Monge MA, Torres-Hinojal MC, MarugánMiguelsanz JM. Copper/zinc ratio in childhood and adolescence: a review. Metabolites. 2023;13(1):82.
- Jia D, Liu L, Liu W, Li J, Jiang X, Xin Y. Copper metabolism and its role in diabetic complications: a review. Pharmacol Res. 2024;206:107264.
- Chami HA, Hall MAK, Chami H. Copper deficiency and polyneuropathy: a case report. Cureus. 2022;14(8).
- Dascalu AM, et al. Serum levels of copper and zinc in diabetic retinopathy: potential new therapeutic targets. Exp Ther Med. 2022;23(5):324.
- Podder D, et al. Incretin-based multi-agonist therapies for type 2 diabetes mellitus and obesity: mechanisms, clinical efficacy, and future directions. Diabetology. 2026;7(3):46.
- Amer HM, Mohamed SA, Elshafeey F, Elhalawany SH. Health implications of prediabetes and the role of trace elements in insulin resistance. Future J Pharm Sci. 2025;11(1):59.
- Arefhosseini S, Tutunchi H, Arefhosseini SR, Ghavami SZ, Ebrahimi-Mameghani M. Copper status and its relation to abdominal obesity indices and liver function in non-alcoholic fatty liver disease: a case-control study. BMC Res Notes. 2024;17(1):370.
- Eljazzar S, et al. The role of copper intake in the development and management of type 2 diabetes: a systematic review. Nutrients. 2023;15(7):1655.