
Research article · 2026 · Full text
International Journal of Geography Geology and EnvironmentGeographical Study of the Impact of Climate Uncertainty on Agricultural Productivity in Latur District (2015-2026)
Volume 8(8) · Pages 79–82 · DOI: 10.22271/27067483.2026.v8.i8a.852 ↗
Research areasClimate change impacts on agricultureAgricultural Economics and PracticesAgricultural risk and resilience
Abstract
Author-writtenLatur district, located in the Marathwada region of Maharashtra, is one of the most drought-prone districts in the state. Agriculture in the district is predominantly rainfed; therefore, climatic uncertainty—manifested through fluctuations in rainfall, recurring droughts, and rising temperatures—has a direct impact on agricultural productivity. This study examines the nature of climate uncertainty and its geographical impact on agricultural productivity during the period from 2015 to 2026.The study is based on secondary data collected from District Socio-Economic Reviews, rainfall records, and Agricultural Production Index (API) statistics. Statistical analysis reveals a strong positive correlation (r = 0.84) between annual rainfall and the Agricultural Production Index. During severe drought years such as 2015 and 2021, the API declined by approximately 20-30 percent. Major crops, including soybean, pigeon pea (tur), and sugarcane, were the most adversely affected. Furthermore, the farmer suicide rate exhibited a strong negative correlation with rainfall (r = -0.95), indicating increased socio-economic distress during drought years.The study highlights the urgent need to promote drought-resilient crops, strengthen watershed management practices, and formulate climate-resilient agricultural policies to ensure sustainable agricultural development in Latur district.
Summary
Source-checkedPlain-language reading of the full paper, prepared with AI and checked against the text. Each point links to the authors' own words.
Why it matters
- Latur district in Maharashtra's Marathwada region is highly susceptible to drought. View evidence ↗
- Over 70% of the district's agriculture depends on rainfall, making it vulnerable to climatic fluctuations. View evidence ↗
- Studying climate uncertainty is critical because it directly affects the rural economy and the livelihoods of farmers. View evidence ↗
The question
- The study aims to analyze how climate uncertainty impacted agricultural productivity in Latur district between 2015 and 2026. View evidence ↗
What they did
- The research used secondary data from government reviews, economic surveys, and agricultural reports. View evidence ↗
- Pearson's Correlation Coefficient was used to determine the relationship between annual rainfall and agricultural productivity. View evidence ↗
- The analysis focused on three primary metrics: annual rainfall, the farmer suicide rate, and the Agricultural Production Index (API) with a 2010 base year of 100. View evidence ↗
What they found
- There is a strong positive correlation (r = 0.84) between annual rainfall and the Agricultural Production Index, meaning higher rainfall generally increases productivity. View evidence ↗
- In years of severe drought, the Agricultural Production Index dropped by roughly 20-30%. View evidence ↗
- Water-intensive crops, specifically sugarcane, soybean, and pigeon pea (tur), suffered the most severe productivity losses. View evidence ↗
- A strong negative correlation (r = -0.95) exists between rainfall and farmer suicide rates, indicating that lower rainfall is associated with higher suicide rates. View evidence ↗
- The number of hot days (above 32°C) increased from 147 days in 1960 to 188 days by 2019. View evidence ↗
- Groundwater levels have dropped significantly, with some wells now exceeding 600 meters in depth. View evidence ↗
What it means
- The authors conclude that climate uncertainty significantly reduced agricultural productivity in Latur district from 2015 to 2026. View evidence ↗
- The authors recommend promoting drought-resistant crops like pearl millet (bajra), sorghum (jowar), and indigenous pulses. View evidence ↗
- The authors suggest that future research should use GIS, remote sensing, and climate modeling to improve the accuracy of impact assessments. View evidence ↗
Visual summary
3 visualsIllustrations explain the paper; charts are replotted from the paper's own table values.
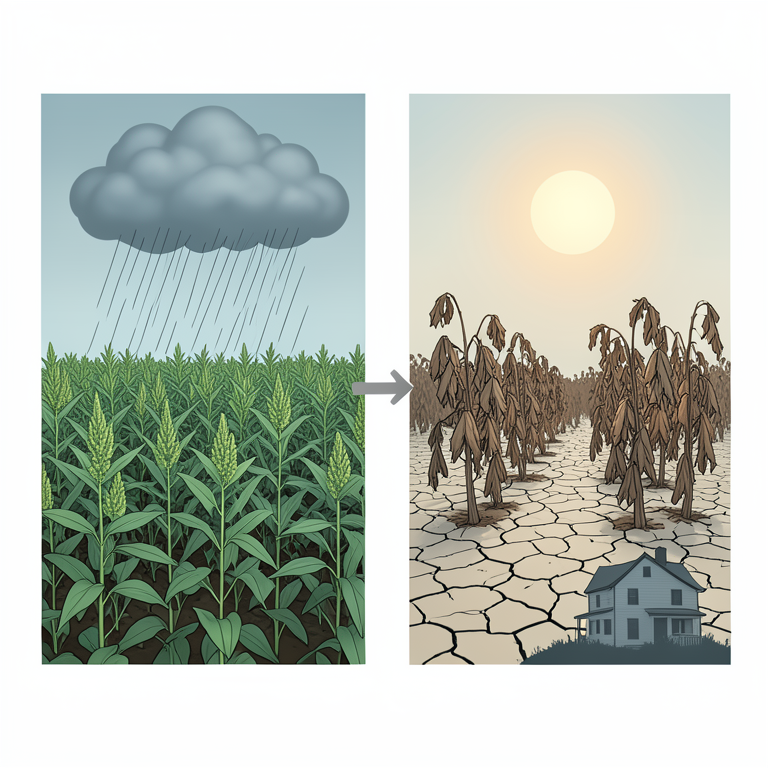
Climate-Productivity-Social Linkage
AI-generated conceptual illustration (Sorghum and soybean crops in the Latur District landscape). It explains the idea and does not show study data.
View source evidence ↗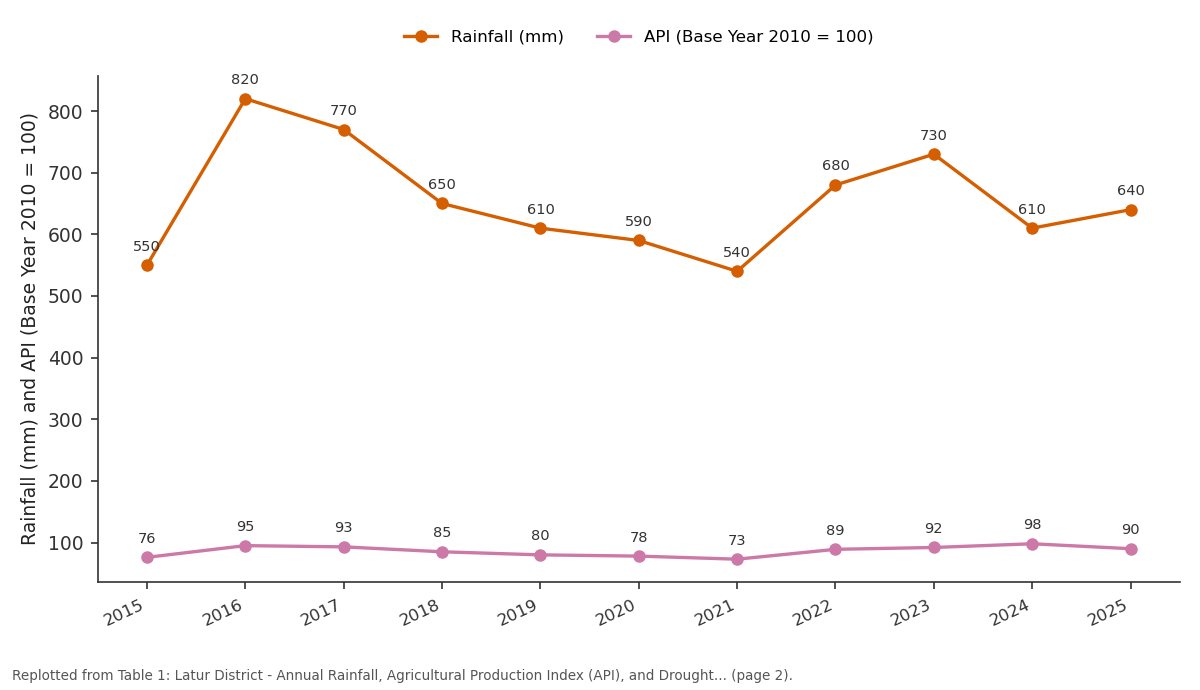
Rainfall (mm) and API (Base Year 2010 = 100): 2015 vs 2016 vs 2017 vs 2018 vs 2019
Replotted from Table 1 (page 2) of the original paper. Every bar is the paper's own table value.
View source evidence ↗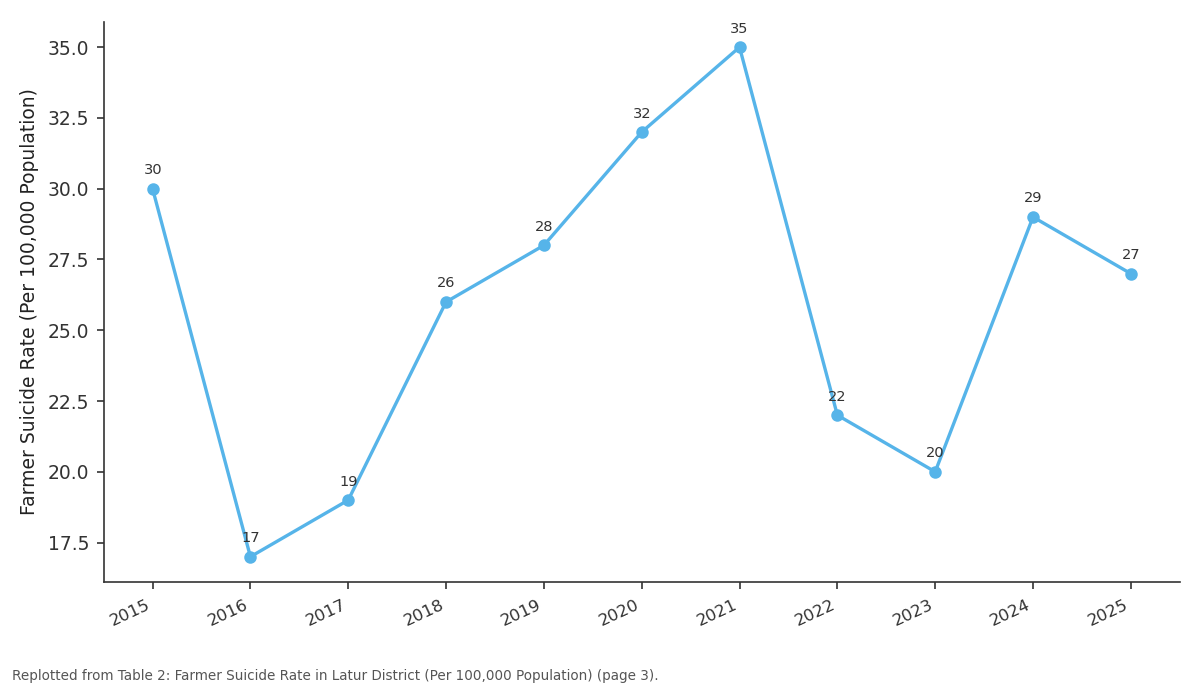
Farmer Suicide Rate: 2015 vs 2016 vs 2017 vs 2018 vs 2019
Replotted from Table 2 (page 3) of the original paper. Every bar is the paper's own table value.
View source evidence ↗Figures & tables
From the original paper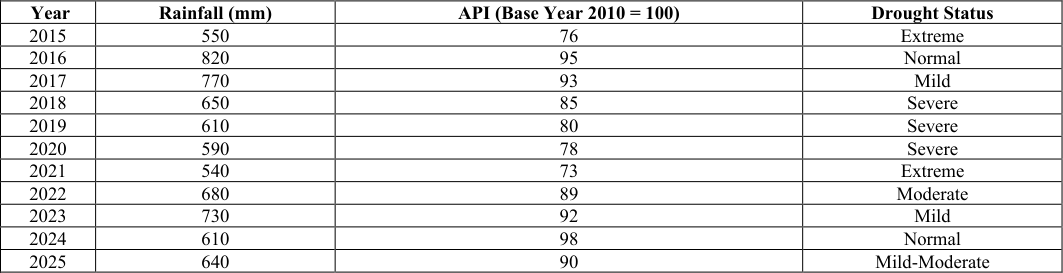 Table 1
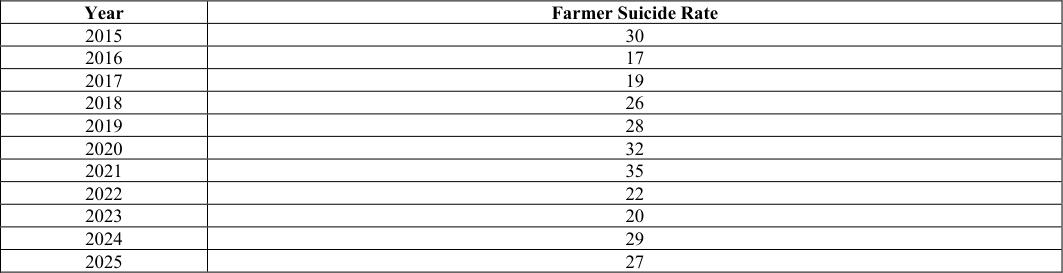 Table 2
Introduction
Climate change and the resulting climate uncertainty have emerged as major global challenges for the agricultural sector. As India is predominantly an agrarian country, agriculture largely depends on the monsoon. The Marathwada region of Maharashtra is particularly drought-prone, and Latur district is one of the most vulnerable districts in this region. More than 70 percent of agriculture in the district is rainfed. Consequently, irregular rainfall, frequent droughts, and rising temperatures have led to significant fluctuations in agricultural productivity. During the period from 2015 to 2026, Latur district experienced several drought years. Among these, 2015 and 2021 were the most severe drought years, with rainfall considerably below the long-term average. As a result, the Agricultural Production Index (API) declined sharply. The productivity of major crops such as soybean, sorghum (jowar), pigeon pea (tur), and chickpea (gram) decreased substantially. This led to increased economic stress on farmers and a rise in the number of farmer suicides. From a geographical perspective, these impacts need to be studied because agricultural productivity is influenced by the combined effects of soil type, topography, irrigation facilities, and local climatic conditions. The significance of this study lies in its close association with farmers' livelihoods and the rural economy. The findings will contribute to the formulation of climate-resilient agricultural policies. The study is entirely based on secondary data and employs appropriate statistical methods for analysis.
Study Area
Latur district is situated between 17 °52′ and 18 °50′ North latitude and 76 °18′ and 77 °18′ East longitude in the Marathwada region of Maharashtra, India. The district covers a geographical area of approximately 7,157 square kilometres (7.15 lakh hectares), of which about 6.65 lakh hectares are under cultivation. Administratively, the district comprises ten tehsils: Latur, Ausa, Nilanga, Udgir, Ahmedpur, Renapur, Chakur, Deoni, Jalkot, and Shirur Anantpal. The soils of the district are predominantly black cotton soils, ranging from shallow to deep in depth. The climate is hot semi-arid, with an average annual rainfall ranging between 680 and 734 mm. The Manjara River and its tributaries constitute the principal sources of irrigation; however, the irrigated area remains limited. Being located in the rainshadow region of the Western Ghats, the district experiences highly erratic rainfall. According to the 2011 Census, nearly 71.4 percent of the population is directly dependent on agriculture for their livelihood. The analysis indicates that the average annual rainfall of the district is 680 mm, with a standard deviation of 98 mm and a coefficient of variation of 14.42%, reflecting moderate
Objectives of the
Objectives of the
Temperature and Other Climatic Factors
The number of hot days has increased significantly over time. In 1960, the district experienced 147 days with temperatures above 32°C, whereas this number increased to 188 days by 2019. This trend is expected to continue under future climate change scenarios. In addition, groundwater levels have declined considerably, and the depth of several wells has exceeded 600 metres, indicating increasing pressure on groundwater resources due to prolonged droughts and rising water demand. These environmental changes have intensified water scarcity and further reduced the resilience of the agricultural sector in Latur district.
Impact on Agricultural Productivity
The statistical analysis reveals a strong positive correlation (r = 0.84) between annual rainfall and the Agricultural Production Index (API) in Latur district. This indicates that higher rainfall generally leads to improved agricultural productivity, whereas drought conditions significantly reduce crop production.
During severe drought years, the Agricultural Production Index declined by approximately 20-30 percent. Waterintensive crops such as soybean, pigeon pea (tur), and sugarcane were the most severely affected. In contrast, drought-tolerant crops such as sorghum (jowar) showed comparatively better resilience; however, their overall productivity also declined under prolonged drought conditions.
In the Kharif season, crops such as soybean and pigeon pea experienced substantial yield reductions due to erratic rainfall. Similarly, in the Rabi season, the productivity of chickpea and wheat was adversely affected by inadequate soil moisture. The years 2015 and 2021 witnessed extensive crop failures because of severe drought. Since only a limited area in the district is irrigated, agriculture remains highly dependent on monsoon rainfall, making crop production extremely vulnerable to climatic uncertainty.
Socio-Economic Impacts
Climate uncertainty has imposed considerable economic and social stress on farming households in Latur district.
Frequent droughts have resulted in increasing indebtedness, migration, school dropouts, and health-related problems, thereby affecting the overall well-being of rural communities.
The study found a strong negative correlation (r = -0.95) between annual rainfall and the farmer suicide rate. Lower rainfall and prolonged drought conditions were associated with a higher incidence of farmer suicides, reflecting the severe socio-economic consequences of climate variability The analysis of socio-economic impacts indicates that migration accounted for 30%, indebtedness for 25%, school dropouts for 20%, health-related problems for 15%, and mental health issues for 10% of the major consequences associated with climate uncertainty in the district.
Discussion
The findings of the study indicate that climate uncertainty in Latur district is closely associated with its geographical characteristics. The district is located in the rain-shadow region of the Western Ghats, resulting in highly irregular rainfall. Although the predominance of black cotton soils enables greater moisture retention, prolonged droughts eventually dry out even these soils, thereby reducing their capacity to support crop growth. The limited extent of irrigation infrastructure has further increased the dependence of agriculture on monsoon rainfall. Consequently, climatic variability has a direct and substantial impact on agricultural productivity. The increasing cultivation of crops such as soybean, which require relatively higher water availability, has further heightened the vulnerability of the agricultural sector to drought conditions. Prolonged droughts lead to reduced agricultural production, declining farm income and increasing indebtedness among farmers. These economic hardships often contribute to higher incidences of farmer suicides. The study also reveals geographical disparities within the district, with comparatively lower adverse impacts observed in areas having better irrigation facilities than in predominantly rainfed regions.
Conclusion and Recommendations Conclusion
The present study concludes that climate uncertainty had a significant negative impact on agricultural productivity in Latur district during the period 2015-2026. A strong positive relationship exists between annual rainfall and the Agricultural Production Index (API), indicating that rainfall remains the most critical determinant of agricultural performance in the district. During extreme drought years, agricultural production declined by approximately 20-30 percent, accompanied by severe socio-economic consequences, including increased indebtedness, migration, and farmer suicides.
Figures and tables from the paper
| Year | Rainfall (mm) | API (Base Year 2010 = 100) | Drought Status |
|---|---|---|---|
| 2015 | 550 | 76 | Extreme |
| 2016 | 820 | 95 | Normal |
| 2017 | 770 | 93 | Mild |
| 2018 | 650 | 85 | Severe |
| 2019 | 610 | 80 | Severe |
| 2020 | 590 | 78 | Severe |
| 2021 | 540 | 73 | Extreme |
| 2022 | 680 | 89 | Moderate |
| 2023 | 730 | 92 | Mild |
| 2024 | 610 | 98 | Normal |
| 2025 | 640 | 90 | Mild-Moderate |
Table text extracted from the original PDF; superscript letters are shown inline. The original table image is below.
View original table image
| Year | Farmer Suicide Rate |
|---|---|
| 2015 | 30 |
| 2016 | 17 |
| 2017 | 19 |
| 2018 | 26 |
| 2019 | 28 |
| 2020 | 32 |
| 2021 | 35 |
| 2022 | 22 |
| 2023 | 20 |
| 2024 | 29 |
| 2025 | 27 |
Table text extracted from the original PDF; superscript letters are shown inline. The original table image is below.
View original table image
References
6 in the original paper- Jadhav VS. Statistical Analysis of Drought Impact on Agricultural Sector in Latur District, Maharashtra. Int J Stat Appl Math. 2025;10(7A):39-45.
- Department of Agriculture, Government of Maharashtra. District-wise APY Estimates. 2025. http://krishi.maharashtra.gov.in/
- Indian Districts. Agriculture -Latur. 2025. https://indiandistricts.in/statistics/maharashtra/latur/agri culture/
- Katke AK. A Geographical Study of Change in Fruit Cultivation Area in Latur District. Int J Geogr Geol Environ. 2024;6(1).
- Kelkar SM, Kulkarni A, Rao KK. Impact of Climate Variability and Change on Crop Production in Maharashtra, India. Curr Sci. 2020;118(8).
- Zilla Parishad Latur. Agriculture Department. 2026. https://zplatur.gov.in/en/agriculture-department/