
Research article · 2026 · Full text
International Journal of Horticulture and Food ScienceEconomic analysis of storage losses & its efficiency
Volume 8(8S) · Pages 24–29 · DOI: 10.33545/26631067.2026.v8.i8sa.837 ↗
Research areasAgricultural Economics and PracticesPostharvest Quality and Shelf Life ManagementAgricultural Engineering and Mechanization
Abstract
Author-writtenOnion is an important commercial vegetable crop in Maharashtra, where proper storage is essential for minimizing post-harvest losses and improving farmers returns. The present study was undertaken in Akola district during 2025-26 to assess storage losses, storage efficiency and the factors influencing storage efficiency under different onion storage structures. A multistage random sampling method was followed, and 120 onion growers were selected from Patur, Balapur and Barshitakli tehsils. The farmers used four major storage structures, namely Kanda Chawl, Traditional structure, Pucca floor and PDKV Low-cost portable structure. The findings showed substantial variation in storage losses among the different structures. The highest overall storage loss was observed in the Traditional structure (11.50%), followed by Pucca floor (9.70%) and Kanda Chawl (5.60%), while the PDKV Low-cost portable structure recorded the lowest loss (0.71%) in the sale-wise analysis. Physiological loss in weight was the main contributor to quantitative losses, whereas sprouting accounted for a major share of qualitative losses. In terms of absolute quantity, losses were highest in Pucca floor storage (22.48 quintals) and lowest in PDKV storage (0.54 quintals). Despite differences in physical losses, storage efficiency was highest for the Traditional structure (90.94%), followed by Kanda Chawl (90.76%), PDKV Low-cost portable structure (90.50%) and Pucca floor (89.29%), with an overall average efficiency of 90.37%. Regression analysis showed that enclosed storage capacity had a negative and significant influence on storage efficiency, whereas total quantity sold had a positive and significant effect. The models explained 81.70-97.80% of the variation in storage efficiency. The study emphasizes that appropriate storage design, effective capacity utilization and proper management practices are important for reducing onion storage losses and improving storage performance.
Summary
Source-checkedPlain-language reading of the full paper, prepared with AI and checked against the text. Each point links to the authors' own words.
Why it matters
- Onion is a key commercial vegetable in Maharashtra, and effective storage is critical to reduce post-harvest losses and increase farmer income. View evidence ↗
- Long-term storage can lead to weight loss, rotting, scale loss, sprouting, and black mould, which diminish the quality and quantity of onions available for sale. View evidence ↗
- The level of storage loss is influenced by the storage duration, the design of the structure, ventilation, and how the produce is managed. View evidence ↗
The question
- The study aimed to estimate storage losses and efficiency across different onion storage structures and identify the factors that determine this efficiency. View evidence ↗
What they did
- The research was conducted in the Akola district during 2025-26, using multistage random sampling to select 120 onion growers from three tehsils. View evidence ↗
- The study compared four types of storage structures: Kanda Chawl, Traditional, Pucca floor, and the PDKV Low-cost portable structure. View evidence ↗
- Losses were categorized as quantitative (weight loss, rotting, scale loss) or qualitative (sprouting, black mould). View evidence ↗
- Multiple regression analysis was employed to determine which variables significantly influenced storage efficiency. View evidence ↗
What they found
- The PDKV structure had the lowest overall storage loss at 0.71%, while the Traditional structure had the highest at 11.50%. View evidence ↗
- Physiological weight loss was the primary cause of quantitative loss, and sprouting was the primary cause of qualitative loss. View evidence ↗
- The PDKV structure provided the highest profit per quintal stored at Rs. 162.44. View evidence ↗
- Regression analysis showed that increased storage capacity negatively impacted efficiency, while a higher total quantity sold positively impacted efficiency. View evidence ↗
- The regression models explained between 81.70% and 97.80% of the variation in storage efficiency. View evidence ↗
What it means
- The authors conclude that the PDKV low-cost portable structure is the most practical and economical option for minimizing losses, especially for small and medium-scale growers. View evidence ↗
Visual summary
2 visualsIllustrations explain the paper; charts are replotted from the paper's own table values.
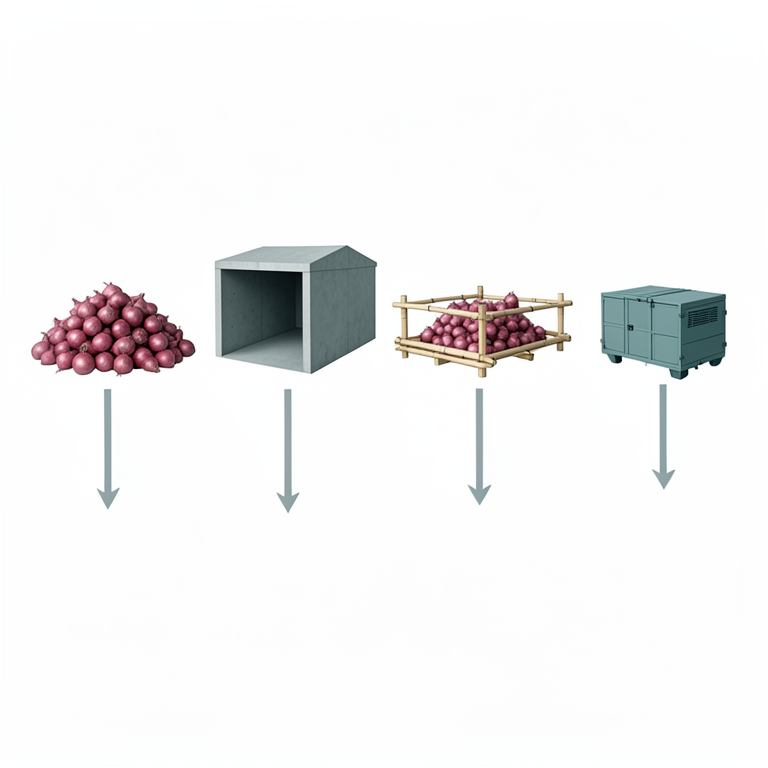
Comparison of Storage Structures
AI-generated conceptual illustration (red onions in various storage structures). It explains the idea and does not show study data.
View source evidence ↗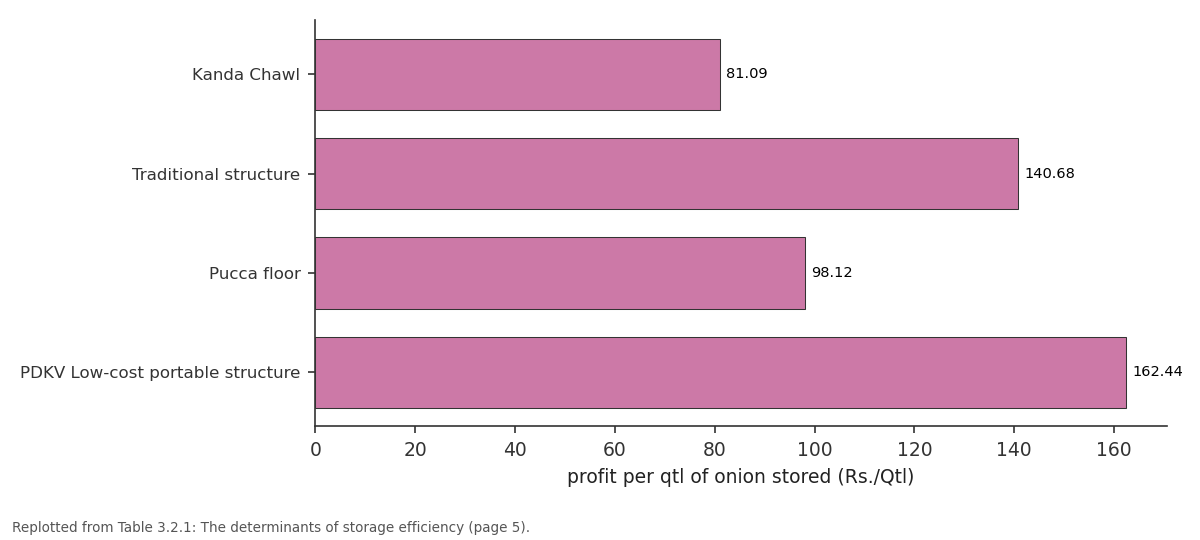
profit per qtl of onion stored (Rs./Qtl): Kanda Chawl vs Traditional structure vs Pucca floor vs PDKV Low-cost portable...
Replotted from Table 3 (page 5) of the original paper. Every bar is the paper's own table value.
View source evidence ↗Figures & tables
From the original paper Table 2
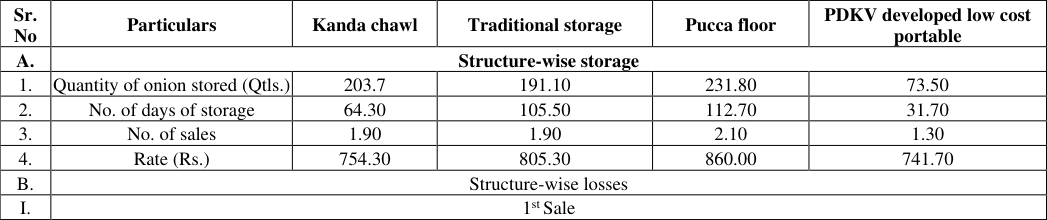 Table 3
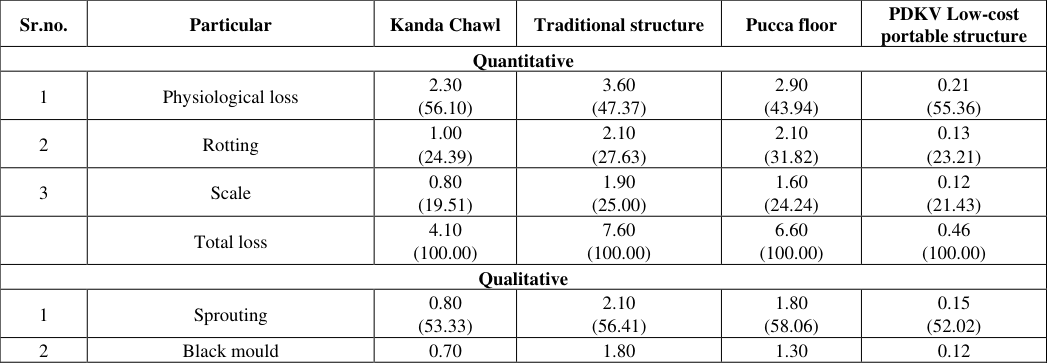 Table 3
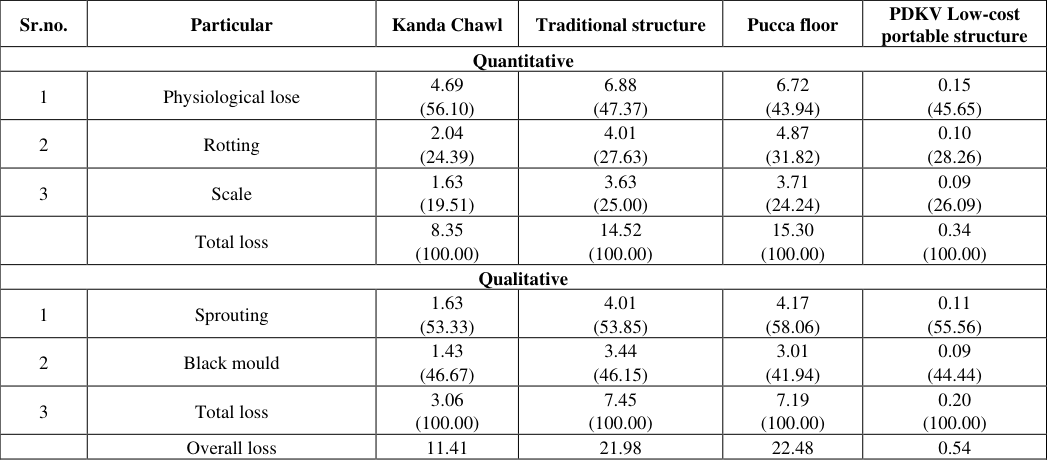 Table 3
 Table 3
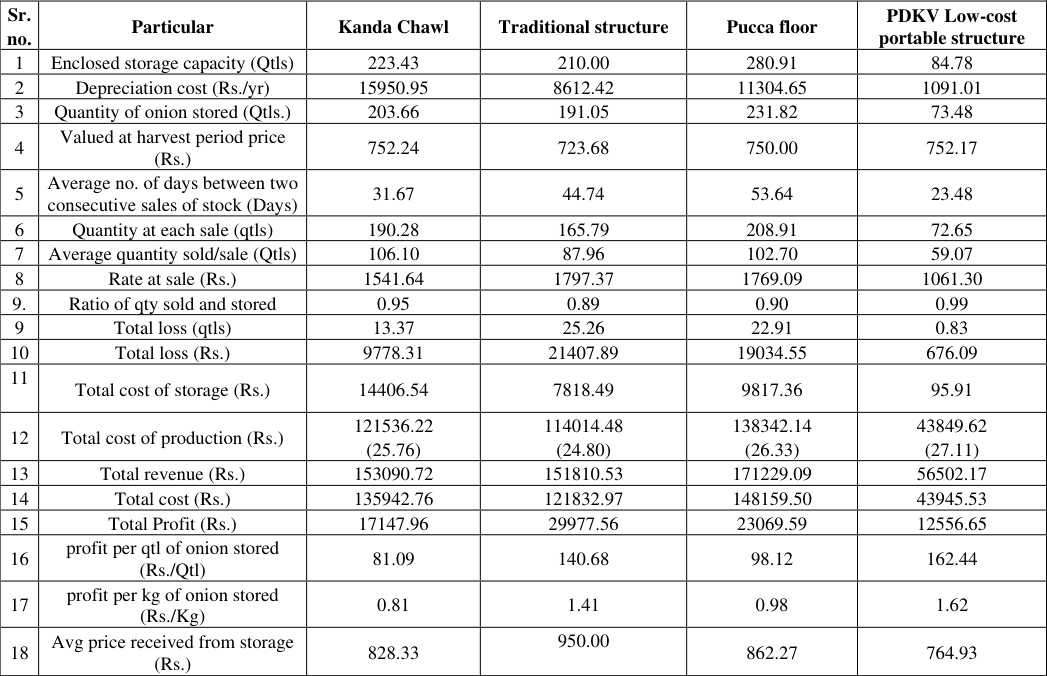 Table 3
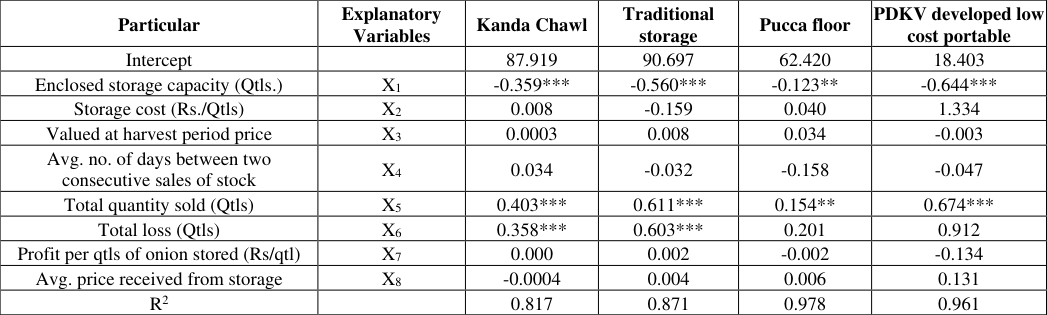 Table 3
Introduction
Onion is an important commercial vegetable crop and an important source of income for farmers. However, the economic benefits from onion production are affected by substantial post-harvest losses during storage. The extent of loss depends not only on the duration of storage but also on the type and design of storage structure, ventilation, handling practices and management of the stored produce. Storage enables farmers to hold onion after harvest and sell it according to market conditions rather than immediately disposing of the produce. However, prolonged storage can result in physiological loss of weight, rotting, scale loss, sprouting and black mould. These losses reduce the quantity and quality of marketable onion and consequently affect farm income. Akola district of the Vidarbha region of Maharashtra was selected for the present study because of the availability of onion growers and different types of onion storage structures. The study area included farmers using Kanda Chawl, Traditional structures, Pucca floor and PDKV Low-cost portable structures. These structures differ in their physical characteristics and storage conditions, which may result in differences in storage losses and storage efficiency. Therefore, a comparative assessment of storage losses and efficiency under different structures is important for identifying suitable storage practices.
The specific objectives of the present study titled "Structure wise storage losses and its storage efficiency of selected onion storage structures" are to estimate structure-wise storage losses and storage efficiency of onion and to analyse the determinants of storage efficiency under different storage structures.
Materials and Methods
Materials and Methods
Study Area:
The study was conducted in Akola district of Maharashtra. The district was selected purposively on the basis of the availability of onion growers. A multistage random sampling technique was adopted for the selection of respondents. Three tehsils, namely Patur, Balapur and Barshitakli, were selected from Akola district. Patur and Balapur were selected on the basis of onion area, whereas Barshitakli was selected on the basis of the availability of a larger number of storage structures. Four villages from each selected tehsil were selected, and ten farmers were randomly selected from each village. Thus, The primary data was collected from 120 farmers for accomplishment of objectives. Among the 120 selected farmers, 67 farmers used Kanda Chawl while 19 used Traditional storage structures. Similarly, 11 used Pucca floor structures and 23 used PDKV Low-cost portable structures.
Data Collection and Analysis:
Primary data were collected through personal interviews using a specially designed and pre-tested interview schedule. The collected data was analysed using simple tabular analysis and multiple regression analysis.
Storage losses of onion:
Storage losses were classified into quantitative and qualitative losses. Quantitative losses included physiological loss of weight (PLW), rotting and scale loss, whereas qualitative losses included sprouting and black mould. Losses in physical quantity of onion during the storage period were converted into monetary terms by considering the price of onion for that particular period of month. Simple tabular analysis was used to estimate structure-wise storage losses of onion storage structures.
Storage efficiency:
Storage efficiency was estimated by comparing the quantity of onion stored with the available storage capacity. The formula used was:
Results and Discussion
Results and Discussion
Structure-wise Storage Losses and Storage Efficiency of Onion 3.1.1 Sale-wise storage losses in selected structures
Sale-wise storage losses in selected structures are presented in Table 3.1.1
| Particular | Explanatory Variables | Kanda Chawl | Traditional storage | Pucca floor | PDKV developed low cost portable |
|---|---|---|---|---|---|
| Intercept | 87.919 | 90.697 | 62.420 | 18.403 | |
| Enclosed storage capacity (Qtls.) | X1 | -0.359*** | -0.560*** | -0.123** | -0.644*** |
| Storage cost (Rs./Qtls) | X2 | 0.008 | -0.159 | 0.040 | 1.334 |
| Valued at harvest period price | X3 | 0.0003 | 0.008 | 0.034 | -0.003 |
| Avg. no. of days between two consecutive sales of stock | X4 | 0.034 | -0.032 | -0.158 | -0.047 |
| Total quantity sold (Qtls) | X5 | 0.403*** | 0.611*** | 0.154** | 0.674*** |
| Total loss (Qtls) | X6 | 0.358*** | 0.603*** | 0.201 | 0.912 |
| Profit per qtls of onion stored (Rs/qtl) | X7 | 0.000 | 0.002 | -0.002 | -0.134 |
| Avg. price received from storage | X8 | -0.0004 | 0.004 | 0.006 | 0.131 |
| R2 | 0.817 | 0.871 | 0.978 | 0.961 |
Table text extracted from the original PDF; superscript letters are shown inline. The original table image is below.
View original table image
| Sr. no. | Particular | Kanda Chawl | Traditional structure | Pucca floor | PDKV Low-cost portable structure |
|---|---|---|---|---|---|
| 1 | Enclosed storage capacity (Qtls) | 223.43 | 210.00 | 280.91 | 84.78 |
| 2 | Depreciation cost (Rs./yr) | 15950.95 | 8612.42 | 11304.65 | 1091.01 |
| 3 | Quantity of onion stored (Qtls.) | 203.66 | 191.05 | 231.82 | 73.48 |
| 4 | Valued at harvest period price (Rs.) | 752.24 | 723.68 | 750.00 | 752.17 |
| 5 | Average no. of days between two consecutive sales of stock (Days) | 31.67 | 44.74 | 53.64 | 23.48 |
| 6 | Quantity at each sale (qtls) | 190.28 | 165.79 | 208.91 | 72.65 |
| 7 | Average quantity sold/sale (Qtls) | 106.10 | 87.96 | 102.70 | 59.07 |
| 8 | Rate at sale (Rs.) | 1541.64 | 1797.37 | 1769.09 | 1061.30 |
| 9. | Ratio of qty sold and stored | 0.95 | 0.89 | 0.90 | 0.99 |
| 9 | Total loss (qtls) | 13.37 | 25.26 | 22.91 | 0.83 |
| 10 | Total loss (Rs.) | 9778.31 | 21407.89 | 19034.55 | 676.09 |
| 11 | Total cost of storage (Rs.) | 14406.54 | 7818.49 | 9817.36 | 95.91 |
| 12 | Total cost of production (Rs.) | 121536.22 (25.76) | 114014.48 (24.80) | 138342.14 (26.33) | 43849.62 (27.11) |
| 13 | Total revenue (Rs.) | 153090.72 | 151810.53 | 171229.09 | 56502.17 |
| 14 | Total cost (Rs.) | 135942.76 | 121832.97 | 148159.50 | 43945.53 |
| 15 | Total Profit (Rs.) | 17147.96 | 29977.56 | 23069.59 | 12556.65 |
| 16 | profit per qtl of onion stored (Rs./Qtl) | 81.09 | 140.68 | 98.12 | 162.44 |
| 17 | profit per kg of onion stored (Rs./Kg) | 0.81 | 1.41 | 0.98 | 1.62 |
| 18 | Avg price received from storage (Rs.) | 828.33 | 950.00 | 862.27 | 764.93 |
Table text extracted from the original PDF; superscript letters are shown inline. The original table image is below.
View original table image
| Sr.no. | Particular | Kanda Chawl | Traditional structure | Pucca floor | PDKV Low cost portable structure | Average |
|---|---|---|---|---|---|---|
| 1 | Quantity stored (Qtls) | 203.66 | 191.05 | 231.82 | 73.48 | 175.00 |
| 2 | Storage capacity (Qtls) | 223.43 | 210.00 | 280.91 | 84.78 | 199.78 |
| 3 | Storage efficiency (%) | 90.76 | 90.94 | 89.29 | 90.50 | 90.37 |
Table text extracted from the original PDF; superscript letters are shown inline. The original table image is below.
View original table image
| Sr.no. | Particular | Kanda Chawl | Traditional structure | Pucca floor | PDKV Low-cost portable structure |
|---|---|---|---|---|---|
| Quantitative | |||||
| 1 | Physiological lose | 4.69 (56.10) | 6.88 (47.37) | 6.72 (43.94) | 0.15 (45.65) |
| 2 | Rotting | 2.04 (24.39) | 4.01 (27.63) | 4.87 (31.82) | 0.10 (28.26) |
| 3 | Scale | 1.63 (19.51) | 3.63 (25.00) | 3.71 (24.24) | 0.09 (26.09) |
| Total loss | 8.35 (100.00) | 14.52 (100.00) | 15.30 (100.00) | 0.34 (100.00) | |
| Qualitative | |||||
| 1 | Sprouting | 1.63 (53.33) | 4.01 (53.85) | 4.17 (58.06) | 0.11 (55.56) |
| 2 | Black mould | 1.43 (46.67) | 3.44 (46.15) | 3.01 (41.94) | 0.09 (44.44) |
| 3 | Total loss | 3.06 (100.00) | 7.45 (100.00) | 7.19 (100.00) | 0.20 (100.00) |
| Overall loss | 11.41 | 21.98 | 22.48 | 0.54 |
Table text extracted from the original PDF; superscript letters are shown inline. The original table image is below.
View original table image
| Sr.no. | Particular | Kanda Chawl | Traditional structure | Pucca floor | PDKV Low-cost portable structure |
|---|---|---|---|---|---|
| Quantitative | |||||
| 1 | Physiological loss | 2.30 (56.10) | 3.60 (47.37) | 2.90 (43.94) | 0.21 (55.36) |
| 2 | Rotting | 1.00 (24.39) | 2.10 (27.63) | 2.10 (31.82) | 0.13 (23.21) |
| 3 | Scale | 0.80 (19.51) | 1.90 (25.00) | 1.60 (24.24) | 0.12 (21.43) |
| Total loss | 4.10 (100.00) | 7.60 (100.00) | 6.60 (100.00) | 0.46 (100.00) | |
| Qualitative | |||||
| 1 | Sprouting | 0.80 (53.33) | 2.10 (56.41) | 1.80 (58.06) | 0.15 (52.02) |
| 2 | Black mould | 0.70 | 1.80 | 1.30 | 0.12 |
Table text extracted from the original PDF; superscript letters are shown inline. The original table image is below.
View original table image
| Sr. No | Particulars | Kanda chawl | Traditional storage | Pucca floor | PDKV developed low cost portable |
|---|---|---|---|---|---|
| A. | Structure-wise storage | ||||
| 1. | Quantity of onion stored (Qtls.) | 203.7 | 191.10 | 231.80 | 73.50 |
| 2. | No. of days of storage | 64.30 | 105.50 | 112.70 | 31.70 |
| 3. | No. of sales | 1.90 | 1.90 | 2.10 | 1.30 |
| 4. | Rate (Rs.) | 754.30 | 805.30 | 860.00 | 741.70 |
| B. | Structure-wise losses | ||||
| I. | 1st Sale |
Table text extracted from the original PDF; superscript letters are shown inline. The original table image is below.
View original table image
Structure-wise percent of quantitative and qualitative losses in onion during storage
Structure-wise percent of quantitative and qualitative losses in onion during storage is presented in Table 3.1.2 It represented from Table 3.1.2 that, physiological loss was the major source of quantitative loss, while sprouting was the main contributor to qualitative loss. The Traditional structure recorded the highest quantitative (7.60%), qualitative (3.90%) and overall loss (11.50%), followed by the Pucca floor (6.60%, 3.10% and 9.70%) and Kanda Chawl (4.10%, 1.50% and 5.60%). Rotting was relatively high in the Pucca floor (31.82%). In contrast, the PDKV low-cost portable structure showed the lowest quantitative (0.46%), qualitative (0.27%) and overall loss (0.73%). Overall, the results highlight the role of proper ventilation and suitable storage design in reducing onion losses.
Structure-wise quantity of quantitative and qualitative losses in onion during storage
Structure-wise quantity of quantitative and qualitative losses in onion during storage is presented in Table 3.1.3 It is revealed from Table 3.1.3 that, physiological loss was the major component of quantitative loss, with the highest losses in the Traditional structure (6.88 quintals) and Pucca floor (6.72 quintals), compared with only 0.15 quintals in the PDKV structure. Total quantitative loss was highest in the Pucca floor (15.30 quintals), followed by the Traditional structure (14.52 quintals). Sprouting was the major qualitative loss, particularly in the Pucca floor (4.17 quintals) and Traditional structure (4.01 quintals). Overall, the Pucca floor recorded the highest loss (22.48 quintals), followed by the Traditional structure (21.98 quintals) and Kanda Chawl (11.41 quintals). The PDKV low-cost portable structure had the lowest overall loss of only 0.54 quintals, highlighting its better performance in reducing both quantitative and qualitative onion losses.
Storage efficiency of different onion storage structures
Table 3.1.4 presents the storage efficiency of different onion storage structures, based on the quantity of onion stored relative to their available storage capacity. Overall, the results suggest that storage size alone did not determine efficiency but proper utilisation of available capacity was more important.
The determinants of storage efficiency
Determinants of storage efficiency is presented in Table 3.2.1 Table 3.2.2 revealed that, storage efficiency was significantly associated with storage capacity and the quantity of onion marketed. The models recorded high R² values of 0.82 for Kanda Chawl, 0.91 for Traditional storage, 0.98 for Pucca floor and 0.88 for the PDKV lowcost portable structure, showing that the selected variables explained 81.70 to 97.80 per cent of the variation in efficiency. Storage capacity (X₁) showed a negative and significant effect across all structures, indicating that efficiency tended to decline as capacity increased. In contrast, total quantity sold (X₅) had a positive and significant effect in all structures, suggesting that better movement of stored onion through sales was associated with higher efficiency. Storage loss (X₆) was positive and significant only in Kanda Chawl and Traditional storage, indicating a significant association in these two structures. Overall, the findings highlight storage capacity and quantity marketed as the most consistent significant factors influencing onion storage efficiency.
Conclusion:
The study concluded that the PDKV lowcost portable storage structure was more effective in reducing both quantitative and qualitative losses in onion compared with conventional storage structures. Although traditional storage provided higher total profit, the PDKV structure recorded the lowest overall loss, highest profit per quintal stored, and better utilisation of stored produce. Storage efficiency was generally high across all structures, but larger storage capacity did not necessarily result in higher efficiency. Overall, the findings indicate that PDKV storage is a practical, economical, and loss-minimising option, particularly for small and medium-scale onion growers. Its wider adoption can help reduce post-harvest losses and improve farmers' returns.
Figures and tables from the paper
| Storage Structure | Number of Farmers | Percentage |
|---|---|---|
| Kanda Chawl | 67 | 55.83 |
| Traditional structure | 19 | 15.83 |
| Pucca floor | 11 | 9.17 |
| PDKV Low-cost portable structure | 23 | 19.17 |
| Total | 120 | 100.00 |
Table text extracted from the original PDF; superscript letters are shown inline. The original table image is below.
View original table image
References
7 in the original paper- Adhal C, Jadhav MS, Sathe SN, Ayare PN, Deshmukh BJ. Comparative economics of rabi onion storage structures in Ahmednagar District of Maharashtra. Int J Innov Sci Res Technol. 2024;9(11):789-793.
- Borole ST, Burbade R, Shinde A. Comparative losses and economic feasibility of the improved onion storage with low cost of onion storage structure. Int J Mod Eng Res. 2013;3(5):2656-2661.
- Falola A, Mukaila R, Uddin II RO, Ajewole CO, Gbadebo W. Postharvest losses in onion: causes and determinants. Kahramanmaraş Sütçü İmam Üniversitesi Tarım ve Doğa Dergisi. 2023;26(2):346-354.
- Kassali R, Idowu EO. Economics of onion storage systems under tropical conditions. Int J Veg Sci. 2007;13(1):85-97.
- Mebratie MA, Haji J, Woldetsadik K, Ayalew A, Ambo E. Determinants of postharvest banana loss in the marketing chain of central Ethiopia. Food Sci Qual Manag. 2015;37(10):52-63.
- Sahu S, Sharma JP, Burman RR, Gills R, Kumar P, Sharma RR. Determinants of post-harvest losses in onion in Pune and Nashik districts of Maharashtra. J Community Mobilization Sustain Dev. 2021;16(1):296300.
- Soomro SA, Ibupoto KA, Soomro NM, Jamali LA. Effect of storage methods on the quality of onion bulbs. Adv Agric Anim Sci. 2016;32(2):221-228.