
Research article · 2026 · Full text
International Journal of Horticulture and Food ScienceFinancial performance and crop-wise profitability of Yashwant Hi-Tech seedling nursery in Nagpur
Volume 8(8) · Pages 102–105 · DOI: 10.33545/26631067.2026.v8.i8b.841 ↗
Research areasAgricultural Economics and PracticesAgricultural economics and policiesAgricultural Development and Management
Abstract
Author-writtenThe present study was conducted during the production year 2025–26 to work out the cost of establishment of the nursery unit and to analyze the profitability of major crops cultivated under polyhouse conditions at Yashwant Hi-Tech Nursery, Mauda, Nagpur. The study followed a case study approach based on primary information collected through personal interviews, field observations and nursery records. Tabular and percentage analysis, depreciation analysis, crop-wise cost allocation, gross return, net return and Benefit-Cost ratio were used for economic evaluation. The total initial establishment cost of the one-acre nursery unit, equivalent to 4047 m², was ₹3280000. The annual fixed cost was ₹573100 and the annual variable cost was ₹4372500, resulting in a total annual production cost of ₹4945600. The nursery sold 2700000 seedlings and generated gross returns of ₹6230000, resulting in an overall net profit of ₹1284678 and an overall B:C ratio of 1.26. Bottle Gourd recorded the highest B:C ratio of 2.05, followed by Capsicum at 1.91, while Chilli generated the highest absolute net profit. The study concludes that the nursery was economically viable at the overall enterprise level, although profitability can be improved by emphasizing high-return crops and reviewing low-return crop lines.
Summary
Source-checkedPlain-language reading of the full paper, prepared with AI and checked against the text. Each point links to the authors' own words.
Why it matters
- Protected cultivation is a key part of modern horticulture as it allows for a controlled environment to produce high-quality planting materials and high-value crops. View evidence ↗
- Starting a commercial nursery is capital-intensive, requiring significant investments in infrastructure such as land development, machinery, and protected structures. View evidence ↗
- Precise estimation of both initial establishment and ongoing production costs is essential for planning investments, setting prices, and determining if the business is viable. View evidence ↗
The question
- The study aimed to determine the establishment costs and analyze the profitability of major polyhouse crops at the Yashwant Hi-Tech Nursery in Nagpur during 2025–26. View evidence ↗
What they did
- The researchers used a case study approach, gathering primary data from nursery records, field observations, and personal interviews. View evidence ↗
- Economic evaluation was performed using tools such as depreciation analysis, crop-wise cost allocation, net returns, and the Benefit-Cost (B:C) ratio. View evidence ↗
- The nursery unit covered one acre (4047 m²) with a total initial establishment cost of ₹3,280,000, averaging ₹810.48 per square meter. View evidence ↗
What they found
- Machinery and equipment were the largest establishment expense at 24.39%, followed by the polyhouse structure (21.34%), land development (18.29%), and the shade-net house (15.24%). View evidence ↗
- The total annual variable cost was ₹4,372,500, with seed costs being the dominant expense at ₹2,551,500 (58.36%). View evidence ↗
- The sale of 2,700,000 seedlings generated total gross returns of ₹6,230,000. View evidence ↗
- The overall enterprise achieved a net profit of ₹1,284,678 and a Benefit-Cost ratio of 1.26. View evidence ↗
- Chilli provided the highest absolute net profit (₹334,148), followed by Capsicum (₹333,659) and Tomato (₹267,874). View evidence ↗
- In terms of efficiency, Bottle Gourd had the highest B:C ratio at 2.05, followed by Capsicum at 1.91. View evidence ↗
- Onion was the least profitable crop, recording the highest loss of ₹166,619. View evidence ↗
What it means
- The authors conclude that while the nursery is economically viable overall, profitability could be increased by focusing on high-return crops and re-evaluating low-return ones. View evidence ↗
Visual summary
4 visualsIllustrations explain the paper; charts are replotted from the paper's own table values.
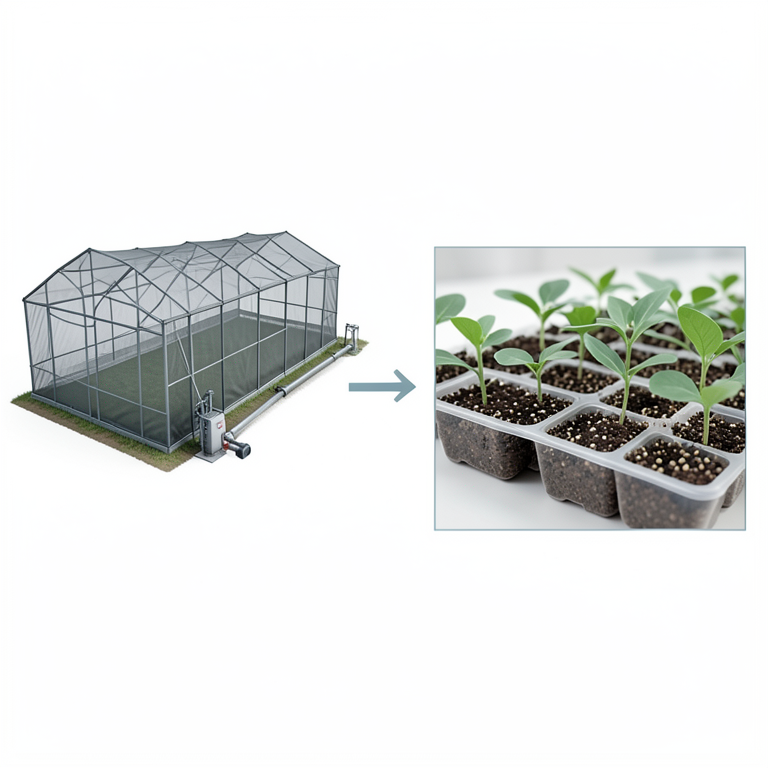
Cost Structure Breakdown
AI-generated conceptual illustration (vegetable seedlings in a commercial polyhouse nursery). It explains the idea and does not show study data.
View source evidence ↗
Crop Profitability Spectrum
AI-generated conceptual illustration (seedling nursery crops including chilli, capsicum, tomato, bottle gourd, and onion). It explains the idea and does not show study data.
View source evidence ↗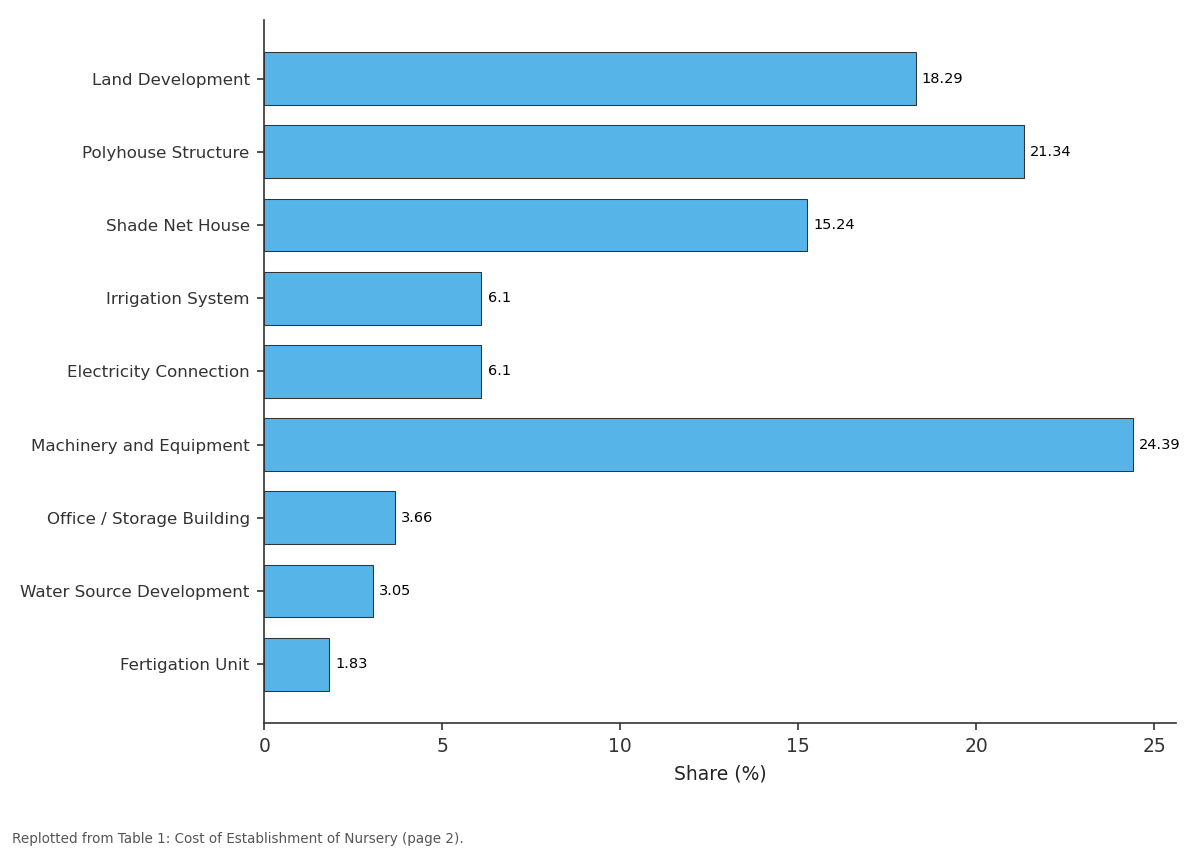
Share (%): Land Development vs Polyhouse Structure vs Shade Net House vs Irrigation System vs Electricity Connection
Replotted from Table 1 (page 2) of the original paper. Every bar is the paper's own table value.
View source evidence ↗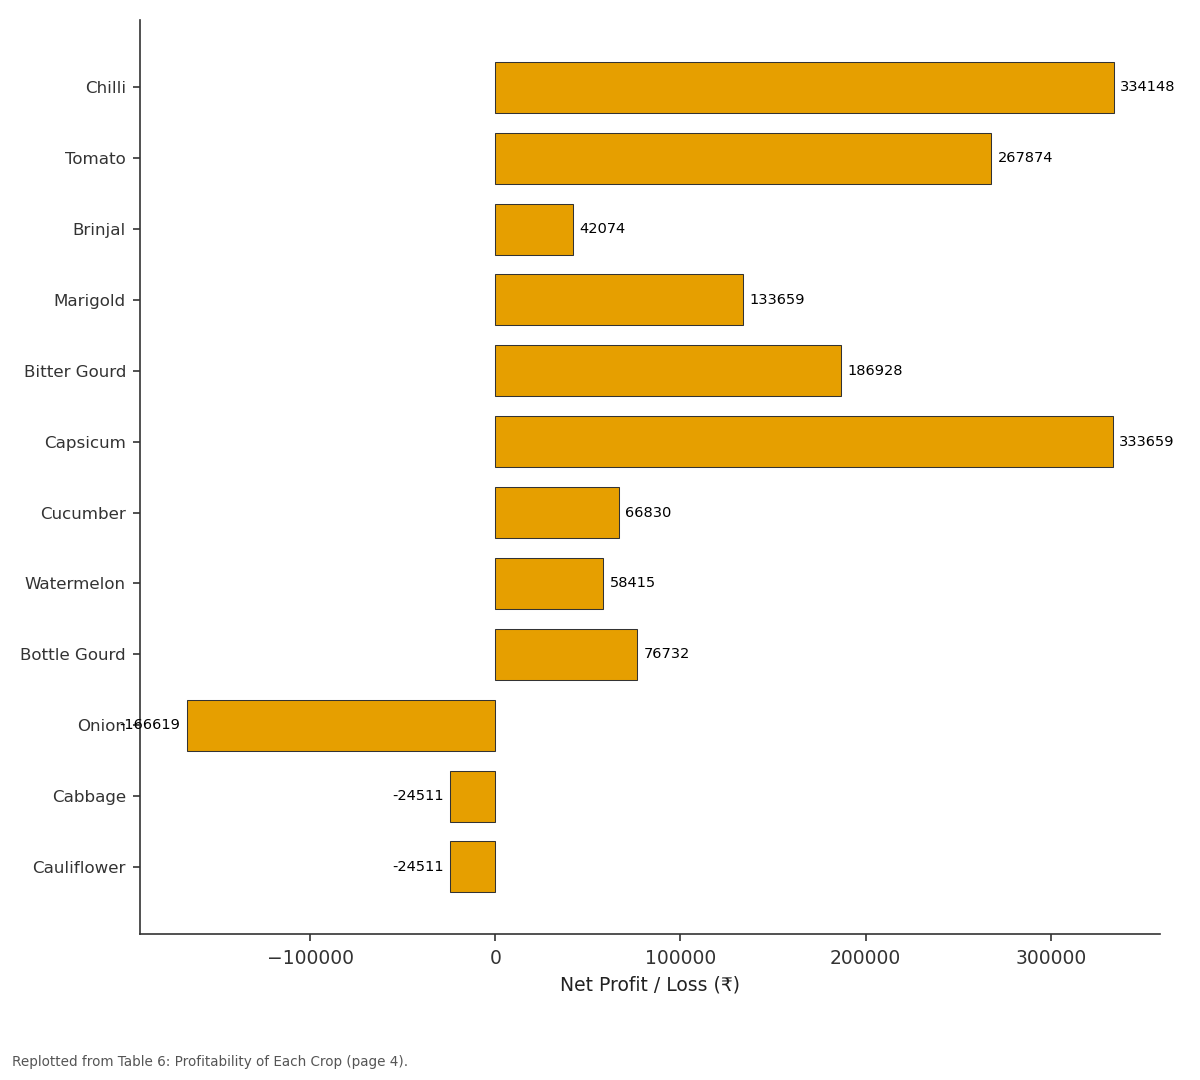
Net Profit / Loss (₹): Chilli vs Tomato vs Brinjal vs Marigold vs Bitter Gourd
Replotted from Table 6 (page 4) of the original paper. Every bar is the paper's own table value.
View source evidence ↗Figures & tables
From the original paper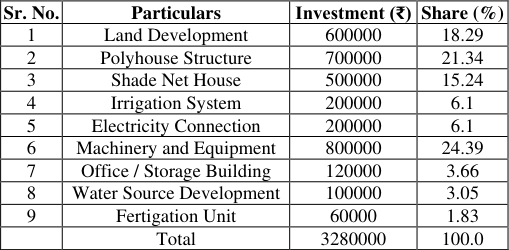 Table 1
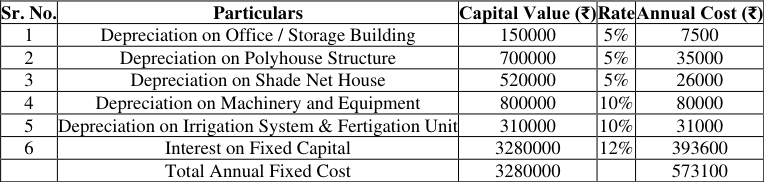 Table 2
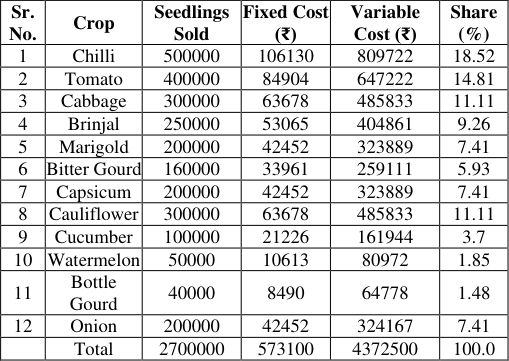 Table 4
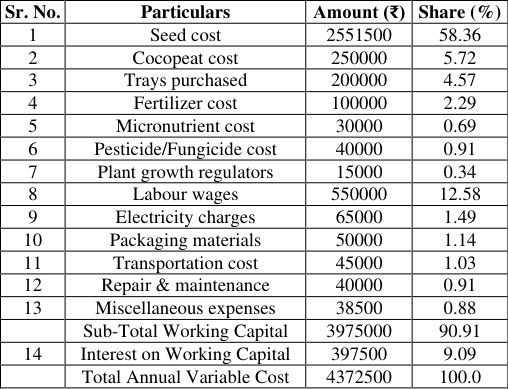 Table 3
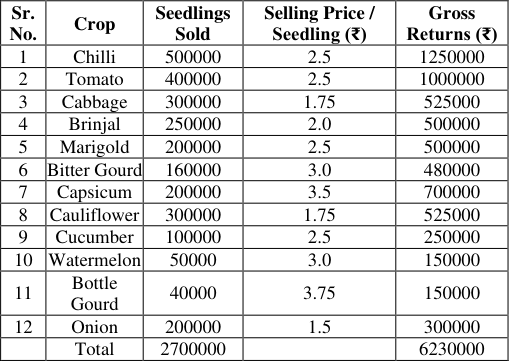 Table 5
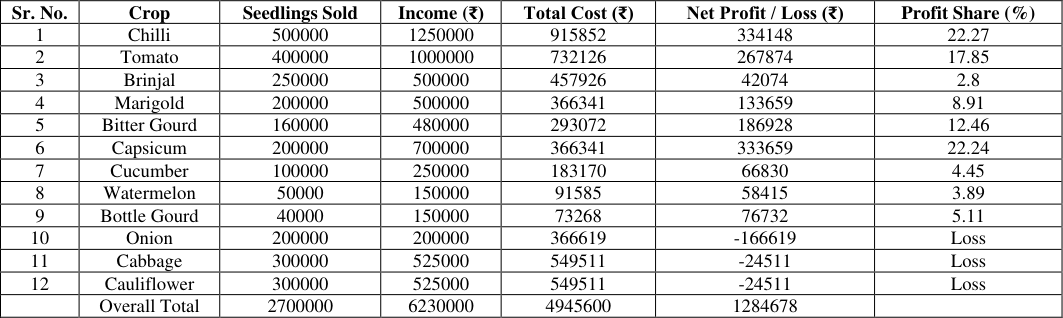 Table 6
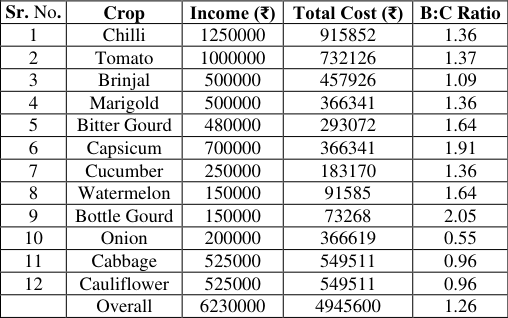 Table 7
Introduction
Protected cultivation has emerged as an important component of modern horticulture because it provides a controlled production environment and supports the production of highvalue crops and quality planting material. Polyhouse and hi-tech nursery systems use protected structures, irrigation and fertigation facilities, specialized growing media and mechanized operations to improve seedling uniformity, survival and marketability. The establishment of a commercial nursery requires substantial investment in land development, protected structures, irrigation, electricity, machinery, storage and fertigation facilities. Therefore, accurate estimation of establishment and recurring production costs is necessary for investment planning, pricing and assessment of enterprise viability. Yashwant Hi-Tech Nursery at Mauda represents a commercial nursery enterprise producing vegetable and flower seedlings. The present paper focuses on estimating the cost of establishment of the nursery unit and analyzing the profitability of major crops cultivated under polyhouse conditions.
Objectives of the Study
1. To work out the cost of establishment of the nursery unit. 2. To analyze the profitability of major crops cultivated under polyhouse conditions.
Methodology
Methodology
Area of Study
The present study was conducted at Yashwant Hi-Tech Nursery, Mauda, Dist. Nagpur, near the Gopal Snacks Company, Bhandara Road, Nagpur -441104.
Period of Study
The data was collected for the financial year 2025-2026.
Source of Data Primary Data
The primary data for the nursery study was collected exclusively from the selected unit, Yashwant Hi-Tech Nursery, Mauda, during the financial year 2025-26. Information was obtained through specially designed schedules and personal interviews with the nursery owner, supervisors and workers. The data covered establishment and maintenance costs, yield and revenue details.
Analytical Tools
The selection of statistical and analytical tools was based on the study's objectives and the type of data collected. The methods used for analysis in this study are explained below.
Cost and Returns of Yashwant Hi-Tech Nursery, Mauda Cost of establishment
Capital investment is the acquisition of physical assets by a unit for use in furthering its long-term business goals and objectives.
Fixed Cost
Fixed costs in the nursery include expenses such as constructing the nursery and polyhouse structures with GI pipes, polyethylene sheets and shade nets, installing irrigation and climate control systems, land preparation, and depreciation of equipment.
Variable Cost
Variable costs consist of inputs like seeds or saplings, fertilizers, pesticides, labour wages, electricity for irrigation and climate control, packaging, and transportation.
Total Cost
The total cost is calculated by adding together the fixed costs and the variable costs.
TC = Fixed Cost + Variable Cost
TC = Fixed Cost + Variable Cost
Gross Return
Gross return is defined as the total rate of return on an investment before the deduction of any expenses.
GR = Price × Quantity
GR = Price × Quantity
Net Return
Net return refers to return after deducting all expenses from the gross return generated by the investment.
Net Return = Gross Return -Total Cost
Net Return = Gross Return -Total Cost
Benefit-Cost Ratio
The benefit-cost ratio compares the benefit generated with the cost and investment of the project.
B:C Ratio = Gross Return / Total Cost
B:C Ratio = Gross Return / Total Cost
Results and Discussion
Results and Discussion
Cost of establishment of nursery
The results presented in Table 1 reveal that the total initial establishment cost of Yashwant Hi-Tech Nursery was ₹3280000 for an area of one acre (4047 m²), which worked out to approximately ₹810.48 per m². Machinery and equipment accounted for the highest share of the total establishment cost (24.39%), followed by the polyhouse structure (21.34%), land development (18.29%) and shadenet house (15.24%). Together, these components constituted a major proportion of the total capital investment, indicating the capital-intensive nature of establishing a hi-tech nursery. The remaining investment was incurred on irrigation, electricity connection, office and storage facilities, watersource development and fertigation. The results indicate that a considerable amount of capital is invested before regular production begins. Therefore, efficient utilization of nursery infrastructure and optimum production capacity are essential for recovering the establishment investment and improving long-term economic performance. The total initial establishment cost of the nursery was ₹3280000. Machinery and equipment accounted for the highest share, followed by the polyhouse structure, land development and shade-net house. The establishment cost works out to approximately ₹810.48 per m².
| Sr. No. | Particulars | Investment (₹) | Share (%) |
|---|---|---|---|
| 1 | Land Development | 600000 | 18.29 |
| 2 | Polyhouse Structure | 700000 | 21.34 |
| 3 | Shade Net House | 500000 | 15.24 |
| 4 | Irrigation System | 200000 | 6.1 |
| 5 | Electricity Connection | 200000 | 6.1 |
| 6 | Machinery and Equipment | 800000 | 24.39 |
| 7 | Office / Storage Building | 120000 | 3.66 |
| 8 | Water Source Development | 100000 | 3.05 |
| 9 | Fertigation Unit | 60000 | 1.83 |
| Total | 3280000 | 100.0 |
Table text extracted from the original PDF; superscript letters are shown inline. The original table image is below.
View original table image
Profitability of major crops cultivated under polyhouse conditions Annual fixed cost
The results presented in Table 2 show that the total annual fixed cost of the nursery was ₹573100. Interest on fixed capital was the largest component, amounting to ₹393600, followed by depreciation on machinery and equipment at ₹80000. Depreciation on the polyhouse structure, shade-net house, irrigation and fertigation unit, and office or storage building constituted the remaining fixed-cost components.
| Sr. No. | Particulars | Capital Value (₹) | Rate | Annual Cost (₹) |
|---|---|---|---|---|
| 1 | Depreciation on Office / Storage Building | 150000 | 5% | 7500 |
| 2 | Depreciation on Polyhouse Structure | 700000 | 5% | 35000 |
| 3 | Depreciation on Shade Net House | 520000 | 5% | 26000 |
| 4 | Depreciation on Machinery and Equipment | 800000 | 10% | 80000 |
| 5 | Depreciation on Irrigation System & Fertigation Unit | 310000 | 10% | 31000 |
| 6 | Interest on Fixed Capital | 3280000 | 12% | 393600 |
| Total Annual Fixed Cost | 3280000 | 573100 |
Table text extracted from the original PDF; superscript letters are shown inline. The original table image is below.
View original table image
The predominance of interest on fixed capital indicates that the large initial investment continues to influence the annual economics of the nursery. Hence, higher utilization of the existing facilities and increased production of profitable seedlings can help spread the fixed cost over a larger volume of output and improve overall profitability. The annual fixed cost was ₹573100. Interest on fixed capital formed the largest component of annual fixed cost, followed by depreciation on machinery and equipment.
Total Annual Variable Cost
The results presented in Table 3 indicate that the total annual variable cost of the nursery was ₹4372500. Seed cost was the largest expenditure, accounting for ₹2551500 or 58.36 per cent of the total variable cost. Labour wages ranked second at ₹550000 (12.58%), followed by interest on working capital at ₹397500 (9.09%). Cocopeat and trays were also important recurring cost components.
| Sr. No. | Particulars | Amount (₹) | Share (%) |
|---|---|---|---|
| 1 | Seed cost | 2551500 | 58.36 |
| 2 | Cocopeat cost | 250000 | 5.72 |
| 3 | Trays purchased | 200000 | 4.57 |
| 4 | Fertilizer cost | 100000 | 2.29 |
| 5 | Micronutrient cost | 30000 | 0.69 |
| 6 | Pesticide/Fungicide cost | 40000 | 0.91 |
| 7 | Plant growth regulators | 15000 | 0.34 |
| 8 | Labour wages | 550000 | 12.58 |
| 9 | Electricity charges | 65000 | 1.49 |
| 10 | Packaging materials | 50000 | 1.14 |
| 11 | Transportation cost | 45000 | 1.03 |
| 12 | Repair & maintenance | 40000 | 0.91 |
| 13 | Miscellaneous expenses | 38500 | 0.88 |
| Sub-Total Working Capital | 3975000 | 90.91 | |
| 14 | Interest on Working Capital | 397500 | 9.09 |
| Total Annual Variable Cost | 4372500 | 100.0 |
Table text extracted from the original PDF; superscript letters are shown inline. The original table image is below.
View original table image
The remaining expenses on fertilizers, micronutrients, pesticides and fungicides, plant growth regulators, electricity, packaging, transportation, repair and maintenance. The results clearly show that seed procurement is the most important area for cost management. Therefore, efficient input planning and procurement can play a major role in reducing the overall variable cost of the nursery. The total annual variable cost was ₹4372500.
Crop-wise cost allocation
The results presented in Table 4 show the crop-wise allocation of fixed and variable costs on the basis of the number of seedlings sold. A total of 2700000 seedlings were sold during the study period. Chilli accounted for the highest share of total seedling sales (18.52%), followed by Tomato (14.81%). Cabbage and Cauliflower each accounted for 11.11 per cent, while Brinjal accounted for 9.26 per cent. Accordingly, these crops received comparatively higher allocations of fixed and variable costs. Crops with smaller sales volumes, such as Watermelon and Bottle Gourd, received lower absolute cost allocations. The total fixed cost of ₹573100 and variable cost of ₹4372500 were distributed among the twelve crops according to their respective share in seedling sales. This allocation provides a clear basis for estimating crop-wise total cost, net returns and B:C ratios.
| Sr. No. | Crop | Seedlings Sold | Fixed Cost (₹) | Variable Cost (₹) | Share (%) |
|---|---|---|---|---|---|
| 1 | Chilli | 500000 | 106130 | 809722 | 18.52 |
| 2 | Tomato | 400000 | 84904 | 647222 | 14.81 |
| 3 | Cabbage | 300000 | 63678 | 485833 | 11.11 |
| 4 | Brinjal | 250000 | 53065 | 404861 | 9.26 |
| 5 | Marigold | 200000 | 42452 | 323889 | 7.41 |
| 6 | Bitter Gourd | 160000 | 33961 | 259111 | 5.93 |
| 7 | Capsicum | 200000 | 42452 | 323889 | 7.41 |
| 8 | Cauliflower | 300000 | 63678 | 485833 | 11.11 |
| 9 | Cucumber | 100000 | 21226 | 161944 | 3.7 |
| 10 | Watermelon | 50000 | 10613 | 80972 | 1.85 |
| 11 | Bottle Gourd | 40000 | 8490 | 64778 | 1.48 |
| 12 | Onion | 200000 | 42452 | 324167 | 7.41 |
| Total | 2700000 | 573100 | 4372500 | 100.0 |
Table text extracted from the original PDF; superscript letters are shown inline. The original table image is below.
View original table image
Gross Returns
The nursery sold a total of 2700000 seedlings. Gross returns were determined from crop-wise sales volume and realized selling price, while profitability was estimated after allocating fixed and variable costs according to the number of seedlings sold.
The results presented in Table 5 show that the nursery generated total gross returns of ₹6230000 from the sale of 2700000 seedlings. Chilli generated the highest gross return of ₹1250000 due to its highest sales volume of 500000 seedlings. Tomato ranked second with gross returns of ₹1000000, followed by Capsicum with ₹700000. Chilli generated the highest gross return of ₹1250000 because of its large sales volume, followed by Tomato at ₹1000000 and Capsicum at ₹700000.
| Sr. No. | Crop | Seedlings Sold | Selling Price / Seedling (₹) | Gross Returns (₹) |
|---|---|---|---|---|
| 1 | Chilli | 500000 | 2.5 | 1250000 |
| 2 | Tomato | 400000 | 2.5 | 1000000 |
| 3 | Cabbage | 300000 | 1.75 | 525000 |
| 4 | Brinjal | 250000 | 2.0 | 500000 |
| 5 | Marigold | 200000 | 2.5 | 500000 |
| 6 | Bitter Gourd | 160000 | 3.0 | 480000 |
| 7 | Capsicum | 200000 | 3.5 | 700000 |
| 8 | Cauliflower | 300000 | 1.75 | 525000 |
| 9 | Cucumber | 100000 | 2.5 | 250000 |
| 10 | Watermelon | 50000 | 3.0 | 150000 |
| 11 | Bottle Gourd | 40000 | 3.75 | 150000 |
| 12 | Onion | 200000 | 1.5 | 300000 |
| Total | 2700000 | 6230000 |
Table text extracted from the original PDF; superscript letters are shown inline. The original table image is below.
View original table image
Profitability of major crops
Profitability of major crops
Benefit-Cost Ratio
Benefit-Cost Ratio
Conclusion
The nursery required an initial establishment investment of ₹3280000 for one acre (4047 m²), indicating the capitalintensive nature of hi-tech nursery establishment. The annual fixed cost was ₹573100 and the annual variable cost was ₹4372500, resulting in a total annual production cost of ₹4945600. The nursery sold 2700000 seedlings and generated gross returns of ₹6230000, producing an overall net profit of ₹1284678 and a B:C ratio of 1.26. Chilli generated the highest absolute net profit, while Bottle Gourd recorded the highest B:C ratio of 2.05, followed by Capsicum at 1.91. Onion, Cabbage and Cauliflower showed B:C ratios below unity and require review of selling price, production cost or crop planning.
Figures and tables from the paper
| Sr. No. | Crop | Seedlings Sold | Income (₹) | Total Cost (₹) | Net Profit / Loss (₹) | Profit Share (%) |
|---|---|---|---|---|---|---|
| 1 | Chilli | 500000 | 1250000 | 915852 | 334148 | 22.27 |
| 2 | Tomato | 400000 | 1000000 | 732126 | 267874 | 17.85 |
| 3 | Brinjal | 250000 | 500000 | 457926 | 42074 | 2.8 |
| 4 | Marigold | 200000 | 500000 | 366341 | 133659 | 8.91 |
| 5 | Bitter Gourd | 160000 | 480000 | 293072 | 186928 | 12.46 |
| 6 | Capsicum | 200000 | 700000 | 366341 | 333659 | 22.24 |
| 7 | Cucumber | 100000 | 250000 | 183170 | 66830 | 4.45 |
| 8 | Watermelon | 50000 | 150000 | 91585 | 58415 | 3.89 |
| 9 | Bottle Gourd | 40000 | 150000 | 73268 | 76732 | 5.11 |
| 10 | Onion | 200000 | 200000 | 366619 | -166619 | Loss |
| 11 | Cabbage | 300000 | 525000 | 549511 | -24511 | Loss |
| 12 | Cauliflower | 300000 | 525000 | 549511 | -24511 | Loss |
| Overall Total | 2700000 | 6230000 | 4945600 | 1284678 |
Table text extracted from the original PDF; superscript letters are shown inline. The original table image is below.
View original table image
| Sr. No. | Crop | Income (₹) | Total Cost (₹) | B:C Ratio |
|---|---|---|---|---|
| 1 | Chilli | 1250000 | 915852 | 1.36 |
| 2 | Tomato | 1000000 | 732126 | 1.37 |
| 3 | Brinjal | 500000 | 457926 | 1.09 |
| 4 | Marigold | 500000 | 366341 | 1.36 |
| 5 | Bitter Gourd | 480000 | 293072 | 1.64 |
| 6 | Capsicum | 700000 | 366341 | 1.91 |
| 7 | Cucumber | 250000 | 183170 | 1.36 |
| 8 | Watermelon | 150000 | 91585 | 1.64 |
| 9 | Bottle Gourd | 150000 | 73268 | 2.05 |
| 10 | Onion | 200000 | 366619 | 0.55 |
| 11 | Cabbage | 525000 | 549511 | 0.96 |
| 12 | Cauliflower | 525000 | 549511 | 0.96 |
| Overall | 6230000 | 4945600 | 1.26 |
Table text extracted from the original PDF; superscript letters are shown inline. The original table image is below.
View original table image
References
7 in the original paper- Prakash P, Kumar P, Kishore P. Economic feasibility of polyhouse establishment with and without government subsidy support: A case of bell pepper cultivation in Maharashtra, India. European Journal of Horticultural Science. 2023;88(2):1-7.
- Kaur M, Kaur P. Comparative economics of capsicum cultivation under polyhouse and open field conditions in Punjab. Journal of Agricultural Development and Policy. 2021;31(1):125-132.
- Ashoka N, Ravi Y, Raveesha S, Yeledhalli RA. Economic analysis of brinjal seedling nursery enterprise in Karnataka. 2020.
- Senthilkumar S, Ashok KR, Chinnadurai M, Ramanathan SP. An economic analysis of capsicum production under protected cultivation in North West region of Tamil Nadu, India. International Journal of Current Microbiology and Applied Sciences. 2018;7(6):2276-2283.
- Kumar S, Singh N, Chaudhari DJ. Profitability of capsicum cultivation under protected condition. Chemical Science Review and Letters. 2018;7(28):900904.
- Rani N, Tiwari D, Kaur G, Sharma D. Enhancing agricultural productivity: A comparative study of vegetable cultivation under polyhouse and open field conditions in Punjab, India. Journal of Scientific Research and Reports. 2024;30(7):166-174.
- Kishore A, Lakshmi YS, Deshai N, Rathod RS, Prakash JS. Performance evaluation of drip irrigation system and profitability analysis of leafy vegetables under polyhouse. Current Journal of Applied Science and Technology. 2020;39(42):20-26.