
Research article · 2026 · Full text
International Journal of Geography Geology and EnvironmentBlock-wise analysis of potato production areas in the potato bowl of west Bengal: A remote sensing approach
Volume 8(8) · Pages 54–59 · DOI: 10.22271/27067483.2026.v8.i8a.849 ↗
Research areasRemote Sensing in AgricultureRemote Sensing and Land UseAgricultural Economics and Practices
Abstract
Author-writtenPotatoes are an important food crop both in West Bengal and globally. West Bengal produces a significant quantity of potatoes and ranks second among the potato-producing states in India. The fertile agricultural lands within the Damodar, Mundeswari, Shilabati, and Dwarkeswar river basins are extensively cultivated with potatoes during the rabi season. Paschim Medinipur, Hooghly, Bankura, Purba Bardhaman, and Howrah constitute the major part of the Potato Bowl of West Bengal. In this study, freely available remote sensing data and GIS techniques were used to map the block-wise area under potato cultivation over the past three years.
Summary
Source-checkedPlain-language reading of the full paper, prepared with AI and checked against the text. Each point links to the authors' own words.
Why it matters
- Potatoes are a critical food crop in West Bengal, ranking second in importance only to rice. View evidence ↗
- West Bengal is the second-largest producer of potatoes in India, following Uttar Pradesh. View evidence ↗
- Annual fluctuations in potato production lead to price volatility, which creates economic uncertainty for local farmers and businesses. View evidence ↗
The question
- The study aimed to use remote sensing and GIS techniques to identify and map potato fields at the block level. View evidence ↗
What they did
- The research analyzed 67 blocks across five districts (Hooghly, Paschim Medinipur, Bankura, Purba Bardhaman, and Howrah) known as the 'Potato Bowl of West Bengal'. View evidence ↗
- The authors processed 18 Sentinel-2 images from the last three rabi seasons, taken at 10-day intervals in January, using QGIS 3.1 and the SCP version 7 plugin. View evidence ↗
What they found
- The SAM classification achieved an overall accuracy between 92.15% (Kappa 0.88) and 98.25% (Kappa 0.97). View evidence ↗
- Composite imagery from three 10-day intervals provided higher identification accuracy for potato fields compared to single-date imagery. View evidence ↗
- In 2024, the Garhbeta-I Block in Paschim Medinipur had the largest potato cultivation area, totaling 6,216 hectares. View evidence ↗
- The Kotulpur Block in Bankura district recorded the largest cultivation areas in 2025 (6,238 hectares) and 2026 (6,934 hectares). View evidence ↗
- Five blocks, Pursurah, Tarakeswar, Chandrakona-II, Goghat-II, and Kotulpur, dedicated more than 25% of their total geographical area to potato cultivation. View evidence ↗
What it means
- The authors concluded that there are significant variations in the extent of potato cultivation across the analyzed blocks over the three-year period. View evidence ↗
- Cloud cover in some January 2024 images may have affected the accuracy of the estimated cultivation area for that year. View evidence ↗
- The authors state this is a preliminary study and recommend further ground verification and detailed analysis to improve precision. View evidence ↗
Visual summary
1 visualsIllustrations explain the paper; they do not show study data.
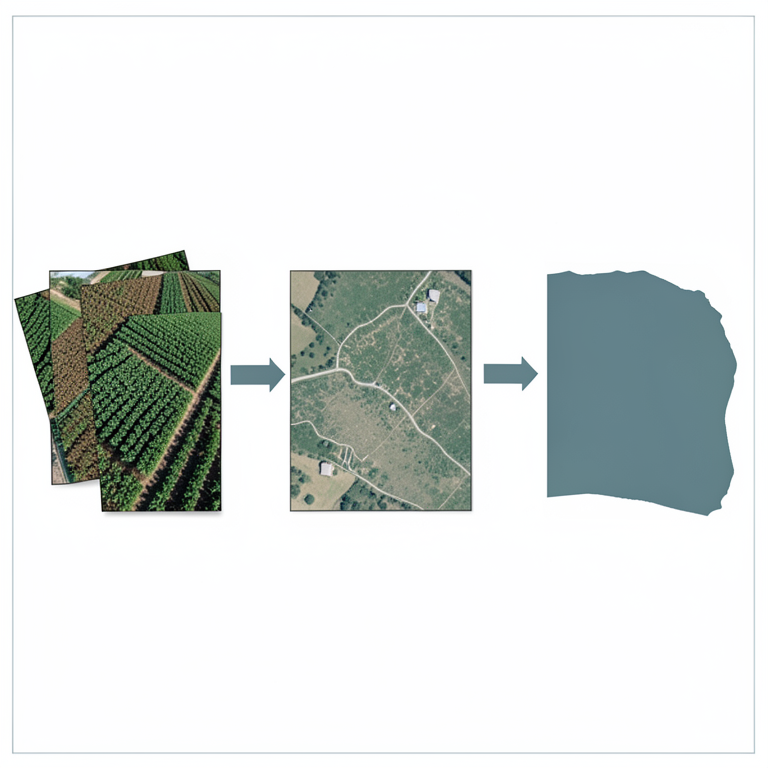
Remote Sensing Workflow
AI-generated conceptual illustration (Potato fields in West Bengal). It explains the idea and does not show study data.
View source evidence ↗Figures & tables
From the original paper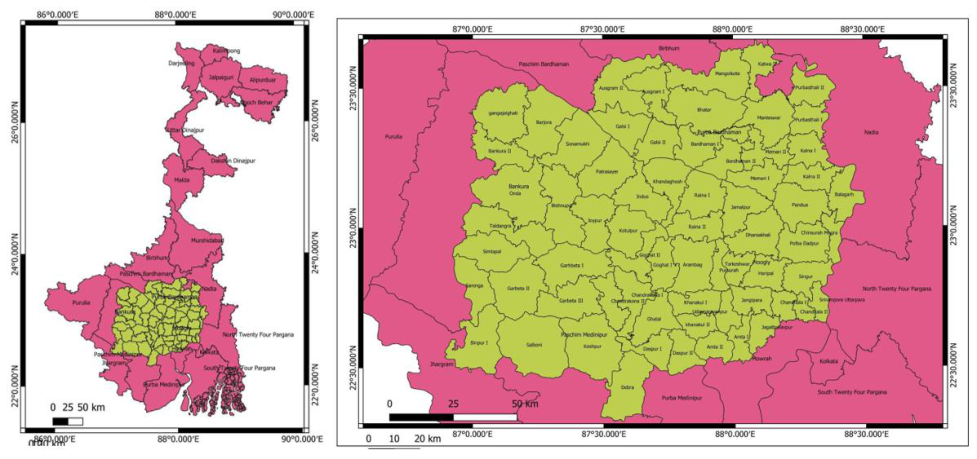 Figure 1
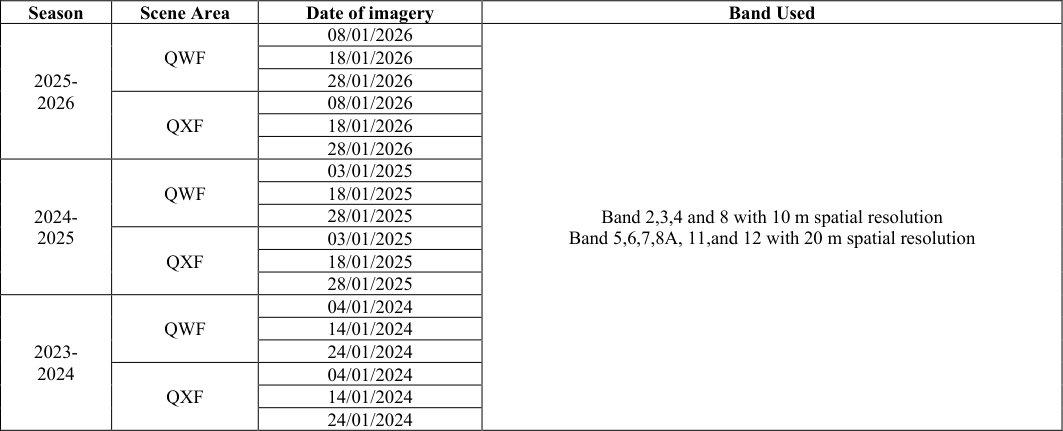 Table 1
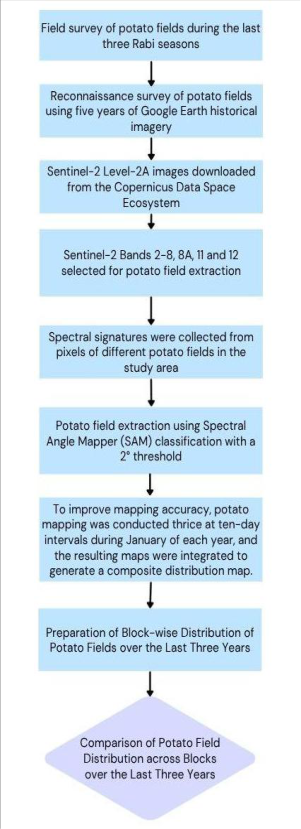 Figure 2
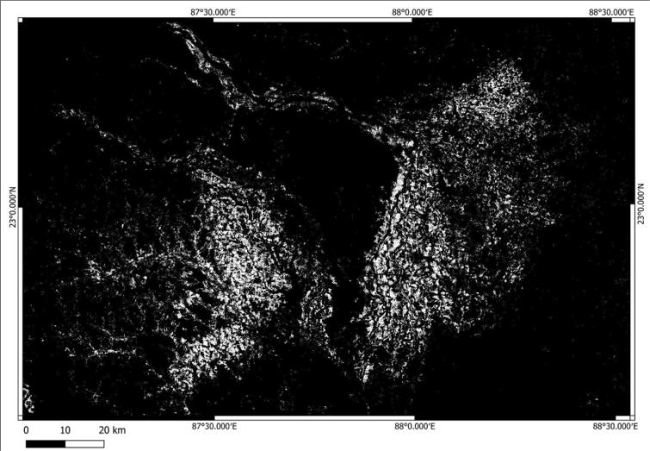 Figure 3
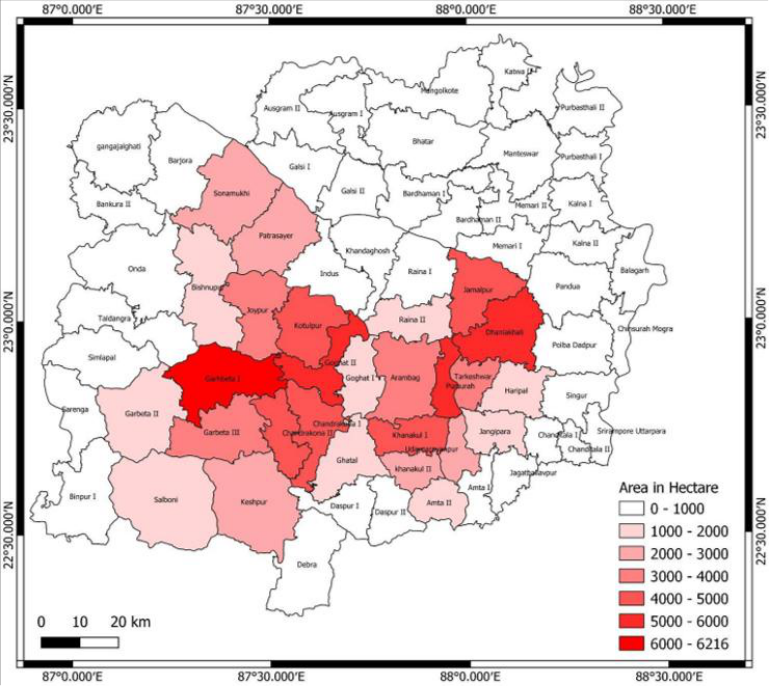 Figure 4
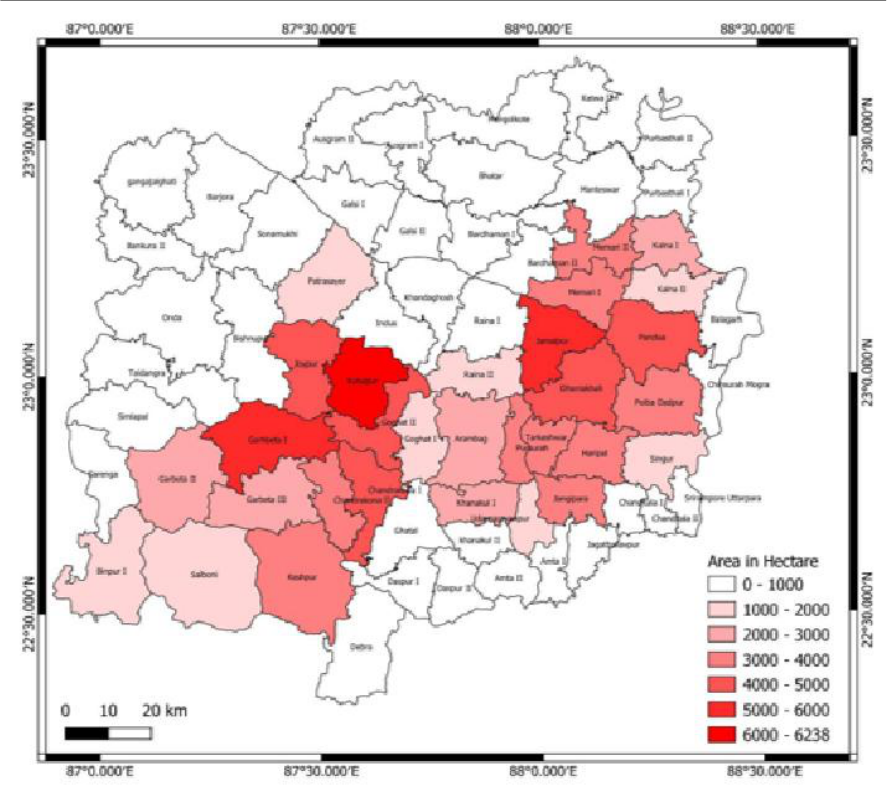 Figure 5
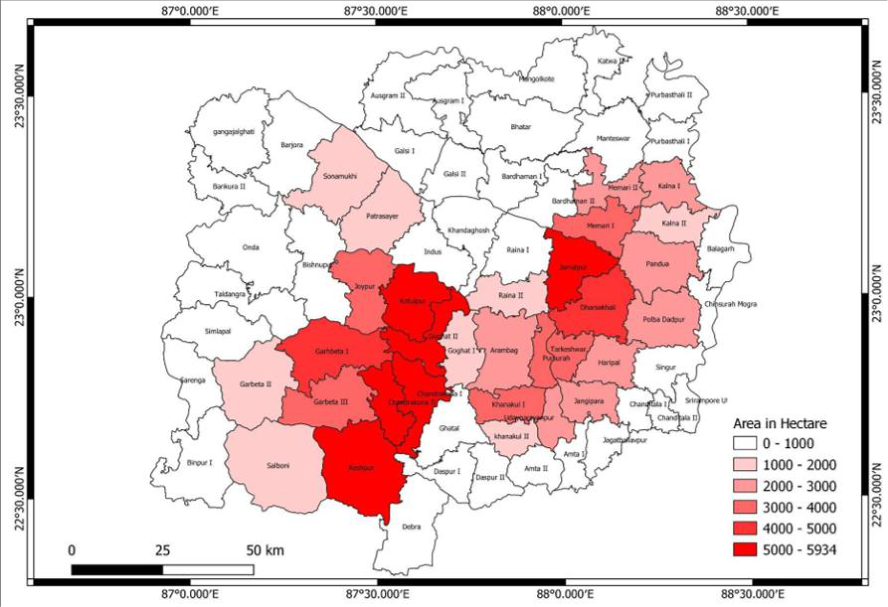 Figure 6
Introduction
Potatoes are a major food crop and an important food item in West Bengal, next to rice. Potato cultivation is widely practiced across the world, while in India, potatoes are primarily cultivated during the winter season. West Bengal is the second-largest potato-producing state in India after Uttar Pradesh. The study area, comprising the districts of Hooghly, Paschim Medinipur, Bankura, Purba Bardhaman, and Howrah, is widely known as the "Potato Bowl of West Bengal" (Kundu et al., 2018) [4] . Potato cultivation and production play a significant role in the local economy and are closely associated with the livelihoods of the people in the study area. Potato production fluctuates from year to year, and corresponding variations in prices create considerable uncertainty for farmers, traders, and local businesses. In some years, potato prices rise sharply, whereas in others, they decline substantially, adversely affecting the local economy. Although potato cultivation offers opportunities for higher income, small-scale farmers may face difficulties in maintaining profitability when market prices decline. A sharp fall in potato prices can also result in substantial financial losses for local traders and businesses. In this study, remote sensing and GIS techniques were used to identify and delineate potato fields at the block level. The block-wise results were analysed using statistical methods to examine the spatial distribution of potato cultivation across the study area.
About the Study Area
According to previous studies and the present reconnaissance survey, several blocks in the districts of Burdwan, Bankura, Paschim Medinipur, Hooghly, and Howrah constitute the major part of this potato-growing region. The area is influenced by the rivers Damodar, Mundeswari, Shilabati, and Dwarkeswar. The dry, silt-rich soils, together with the availability of irrigation facilities, provide favourable conditions for potato cultivation. In this study, 67 blocks across the five districts were analysed to assess the status and spatial distribution of potato cultivation (Figure 1). [9,4,5,1,7] . Various researchers have used moderate-resolution multispectral Landsat TM imagery for potato field identification (Ceballos-Silva & Lopez-Blanco, 2003; Ramirez-Gonzalez et al., 2025) [2,10] . Other studies have employed multispectral Sentinel-2 imagery for the identification and monitoring of potato cultivation (Herrmann et al., 2011; Newton et al., 2018; Ashourloo et al., 2020) [3,8,1] . Kundu et al. (2018) [4] identified potato fields with high accuracy using 16-day composite MODIS data (MOD13Q1-V005) with a spatial resolution of 250 m. However, the relatively coarse spatial resolution of MODIS may limit the accuracy of potato field identification, particularly in areas where agricultural fields are considerably smaller than the size of a 250 m pixel. Although several studies have focused on potato production and the identification of potato fields using remote sensing, there remains a research gap in the block-wise identification and spatial distribution of potato cultivation in the potatogrowing region of West Bengal. In particular, limited studies have utilized freely available, high-resolution (10 m) satellite imagery to map potato fields at the block level in recent years.
Materials and Methodology
Due to variations in physical conditions and farmers' economic decisions, potato sowing times vary across the study area. Some farmers plant early-maturing or shortduration potato varieties in November, whereas others sow potatoes in December. Consequently, early-harvested potato fields may be cleared during the first week of January, while potatoes in other fields may still be at an early growth stage. As a result, canopy cover varies considerably among fields at any given time. Therefore, it is difficult to identify and delineate all potato fields using satellite imagery acquired on a single date. Mapping the complete spatial extent of potato fields requires satellite imagery acquired on multiple dates throughout the growing season. Based on reconnaissance surveys conducted over the past five years, it was observed that an interval of approximately 5-15 days between image acquisitions is suitable for capturing the full extent of potato cultivation. There are numerous studies on potato crop mapping using remote sensing techniques. Hyperspectral imagery from AVIRIS and very-high-resolution imagery from WorldView-3 can be highly effective for identifying and mapping potato fields (Sagan et al., 2021; Mohanta et al., 2025) [11,6] . However, the high cost of acquiring such imagery can limit its applicability for large study areas. WorldView-3 imagery from Maxar Technologies provides eight VNIR bands with a spatial resolution of 1.24 m and high radiometric precision. The imagery costs approximately US$45 per square kilometre, which would result in an estimated cost of approximately US$675,000 for the entire study area. Freely available MODIS imagery offers a broad spectral range, good vegetation identification capabilities, and high temporal resolution. However, the agricultural lands in the study area are relatively small, with diverse land uses occurring within the same area. Therefore, the coarse spatial resolution of MODIS imagery may result in mixed pixels, thereby reducing the accuracy of field-level crop identification. Consequently, high-spatial-resolution satellite imagery is more suitable for accurately mapping potato fields in the study area. Only a small number of agricultural fields in the study area are approximately 250 m in length. Therefore, a single MODIS pixel may encompass multiple agricultural fields and different land-use types, making it difficult to identify individual potato fields. In contrast, the 10 m spatial resolution of Sentinel-2 imagery allows individual agricultural fields of moderate size to be represented more effectively. Therefore, freely available Sentinel-2 imagery is a suitable data source for mapping potato fields in the study area. In this study, 18 Sentinel-2 images acquired during January over the last three rabi seasons, at approximately 10-day intervals, were processed using QGIS 3.1 with the Semi-Automatic Classification Plugin (SCP) version 7 (Table 1). Supervised classification was performed using the Spectral Angle Mapper (SAM) algorithm with a threshold value of 2°. The images from each year were combined to generate a composite dataset representing the annual extent of potato cultivation. Accuracy assessment was conducted to evaluate the reliability and overall accuracy of the classification results. Potato fields were extracted at the block level from the classification results. The block-wise extent and distribution of potato cultivation over the last three years were analysed using QGIS, and spatial distribution maps were prepared to illustrate the temporal and spatial patterns of potato cultivation across the study area. The overall methodology is presented in Figure 2.
| Season | Scene Area | Date of imagery | Band Used |
|---|---|---|---|
| 2025- 2026 | QWF | 08/01/2026 | Band 2,3,4 and 8 with 10 m spatial resolution Band 5,6,7,8A, 11,and 12 with 20 m spatial resolution |
| 18/01/2026 | |||
| 28/01/2026 | |||
| QXF | 08/01/2026 | ||
| 18/01/2026 | |||
| 28/01/2026 | |||
| 2024- 2025 | QWF | 03/01/2025 | |
| 18/01/2025 | |||
| 28/01/2025 | |||
| QXF | 03/01/2025 | ||
| 18/01/2025 | |||
| 28/01/2025 | |||
| 2023- 2024 | QWF | 04/01/2024 | |
| 14/01/2024 | |||
| 24/01/2024 | |||
| QXF | 04/01/2024 | ||
| 14/01/2024 | |||
| 24/01/2024 |
Table text extracted from the original PDF; superscript letters are shown inline. The original table image is below.
View original table image
Results and Discussion
From the image analysis, two fan-shaped areas were identified in southern West Bengal where almost all agricultural fields are covered with potato crops during the rabi season (Figure 3). The results of the Spectral Angle Mapper (SAM) classification, using a threshold value of 2°, indicate that the overall classification accuracy ranges from 92.15%, with a Kappa coefficient of 0.88, to 98.25%, with a Kappa coefficient of 0.97. The accuracy assessment indicates that single-date imagery provides lower accuracy in identifying potato fields than composite imagery generated from three images acquired at approximately 10day intervals during the respective rabi seasons. However, some Sentinel-2 images acquired in January 2024 were partially affected by cloud cover, which may have influenced the estimated potato cultivation area for 2024, as suitable replacement imagery from the same period was not available. The block-wise potato field areas are presented in Figures 4, 5, and6, where two distinct zones of potato cultivation can be observed.
Conclusion
There are considerable variations in the extent of potato cultivation across the study blocks over the last three years. Among the study blocks within the 'Potato Bowl' of West Bengal, Garhbeta-I Block in Paschim Medinipur recorded the largest area under potato cultivation in 2024, covering 6,216 hectares. In 2025 and 2026, Kotulpur Block in Bankura district recorded the largest areas under potato cultivation, covering 6,238 hectares and 6,934 hectares, respectively. Other important potato-producing blocks include Jamalpur, Chandrakona-I, Goghat-II, Keshpur, and Dhaniakhali. Among the study blocks, Pursurah, Tarakeswar, Chandrakona-II, Goghat-II, and Kotulpur have more than 25% of their respective geographical areas under potato cultivation. However, this is a preliminary study, and further ground verification and detailed analysis are required to improve the accuracy and precision of the findings.
Figures and tables from the paper
References
11 in the original paper- Ashourloo D, Shahrabi HS, Azadbakht M, Rad AM, Aghighi H, Radiom S. A novel method for automatic potato mapping using time series of Sentinel-2 images. Comput Electron Agric. 2020;175:105583.
- Ceballos-Silva A, Lopez-Blanco J. Delineation of suitable areas for crops using a Multi-Criteria Evaluation approach and land use/cover mapping: a case study in Central Mexico. Agric Syst. 2003;77(2):117-136.
- Herrmann I, Pimstein A, Karnieli A, Cohen Y, Alchanatis V, Bonfil DJ. LAI assessment of wheat and potato crops by VENμS and Sentinel-2 bands. Remote Sens Environ. 2011;115(8):2141-2151.
- Kundu R, Dutta D, Chakrabarty A, Nanda MK. Assessment of spatio-temporal phenology dynamics of potato crop using MODIS NDVI data. Int J Sci Res Rev. 2018;7(6):454-470.
- Kundu R, Dutta D, Nanda MK, Chakrabarty A. Near real time monitoring of potato late blight disease severity using field based hyperspectral observation. Smart Agric Technol. 2021;1:100019.
- Mohanta A, Sandhya Kiran G, Malhi RKM, Prajapati PC, Oza KK, Rajput S, et al. Harnessing Spectral Libraries From AVIRIS-NG Data for Precise PFT Classification: A Deep Learning Approach. Plant Cell Environ. 2025.
- Mukiibi A, Machakaire ATB, Franke AC, Steyn JM. A systematic review of vegetation indices for potato growth monitoring and tuber yield prediction from remote sensing. Potato Res. 2025;68(1):409-448.
- Newton IH, Tariqul Islam AM, Saiful Islam AKM, Tarekul Islam GM, Tahsin A, Razzaque S. Yield prediction model for potato using landsat time series images driven vegetation indices. Remote Sens Earth Syst Sci. 2018;1(1):29-38.
- Peddle DR, Smith AM. Spectral mixture analysis of agricultural crops: endmember validation and biophysical estimation in potato plots. Int J Remote Sens. 2005;26(22):4959-4979.
- Ramirez-Gonzalez DA, Chokmani K, Cambouris AN, D'Souza ML. Delineation of management zones based on the agricultural potential concept for potato production using optical satellite images. Remote Sens. 2025;17(22):3709.
- Sagan V, Maimaitijiang M, Bhadra S, Maimaitiyiming M, Brown DR, Sidike P, et al. Field-scale crop yield prediction using multi-temporal WorldView-3 and PlanetScope satellite data and deep learning. ISPRS J Photogramm Remote Sens. 2021;174:265-281.