
Research article · 2026 · Full text
International Journal of Geography Geology and EnvironmentSpatio-Temporal Assessment of Agricultural Drought under Changing Climatic Conditions Using Geospatial Techniques: A Case Study of Prakasam District, Andhra Pradesh, India
Volume 8(8) · Pages 64–78 · DOI: 10.22271/27067483.2026.v8.i8a.851 ↗
Research areasHydrology and Drought AnalysisRemote Sensing in AgricultureClimate change impacts on agriculture
Abstract
Author-writtenPrakasam District in Andhra Pradesh is one of the most drought-prone areas in the state. Its semi-arid climate, dependence on rainfed farming, and falling groundwater levels lead to frequent agricultural droughts. In this study, we used remote sensing and GIS to track how drought changed over time, analyzing Landsat 8 and 9 OLI/TIRS images from 2015, 2020, and 2025. We generated five drought indicators-Normalized Difference Vegetation Index (NDVI), Land Surface Temperature (LST), Vegetation Condition Index (VCI), Temperature Condition Index (TCI), and Vegetation Health Index (VHI)-at a 30-meter resolution.The results showed that thermal stress continued to rise, with the highest LST increasing from 38.72°C in 2015 to 41.30°C in 2025. Maximum NDVI values increased slightly from 0.47 to 0.52, indicating some local improvement in vegetation. However, VHI results showed that drought-affected areas increased in size. Mild drought areas increased from 110 km² in 2015 to 160 km² in 2025, and extreme drought became common by 2025. The negative link between NDVI and LST strengthened, from −0.62 to −0.79, indicating that vegetation had a growing effect on surface temperatures.These findings show that more green vegetation does not always mean less drought risk if thermal stress is also rising. Using both vegetation and temperature indices together gives a better picture of agricultural drought than using just one index. This study is the first to use 30-meter Landsat data for remote sensing and GIS-based drought assessment in Prakasam District, and it offers a practical approach for drought monitoring and climate-resilient farming in semi-arid parts of peninsular India.
Summary
Source-checkedPlain-language reading of the full paper, prepared with AI and checked against the text. Each point links to the authors' own words.
Why it matters
- Drought is a highly destructive natural hazard that particularly impacts agriculture in semi-arid and arid environments. View evidence ↗
- Prakasam District in Andhra Pradesh is highly susceptible to agricultural droughts due to its semi-arid climate, reliance on rainfed farming, and declining groundwater. View evidence ↗
- While the Normalized Difference Vegetation Index (NDVI) is common for assessing vegetation, it cannot differentiate between naturally sparse vegetation and stress caused by drought. View evidence ↗
The question
- The study aimed to assess how agricultural drought changed over space and time in Prakasam District using Landsat 8 and 9 imagery from 2015, 2020, and 2025. View evidence ↗
- The researchers sought to evaluate thermal stress, vegetation condition, and drought severity using five specific remote sensing indices. View evidence ↗
What they did
- The study used Landsat 8 (2015, 2020) and Landsat 9 (2025) OLI/TIRS imagery with less than 10% cloud cover. View evidence ↗
- Five indicators (NDVI, LST, VCI, TCI, and VHI) were generated at a 30-meter resolution to monitor drought. View evidence ↗
- Drought severity was classified into five categories (Extreme, Severe, Moderate, Mild, and No Drought) based on VHI values. View evidence ↗
- Pearson's correlation coefficient was used to analyze the relationship between vegetation (NDVI) and surface temperature (LST). View evidence ↗
What they found
- Maximum land surface temperatures increased over the study period, rising from 38.72°C in 2015 to 41.30°C in 2025. View evidence ↗
- Maximum NDVI values increased slightly from 0.47 in 2015 to 0.52 in 2025, suggesting some local improvement in vegetation. View evidence ↗
- The spatial extent of mild drought increased from 110 km² in 2015 to 160 km² in 2025. View evidence ↗
- Areas with no drought remained consistently small, occupying only 30-35 km² of the district. View evidence ↗
- The negative correlation between NDVI and LST strengthened from r = -0.62 in 2015 to r = -0.79 in 2025, indicating a growing cooling effect of vegetation on surface temperatures. View evidence ↗
- By 2025, extreme drought became the dominant category across most of the district, driven by high thermal stress (low TCI) despite improvements in vegetation (NDVI). View evidence ↗
What it means
- The authors conclude that combining vegetation and temperature indices is more reliable for assessing agricultural drought than relying on NDVI alone. View evidence ↗
- The study recommends promoting drought-tolerant crops, expanding micro-irrigation, and strengthening soil and water conservation. View evidence ↗
- The authors note that using scene-based normalization instead of multi-year pixel-wise normalization caused large interannual variations in the Temperature Condition Index (TCI). View evidence ↗
Visual summary
1 visualsIllustrations explain the paper; they do not show study data.
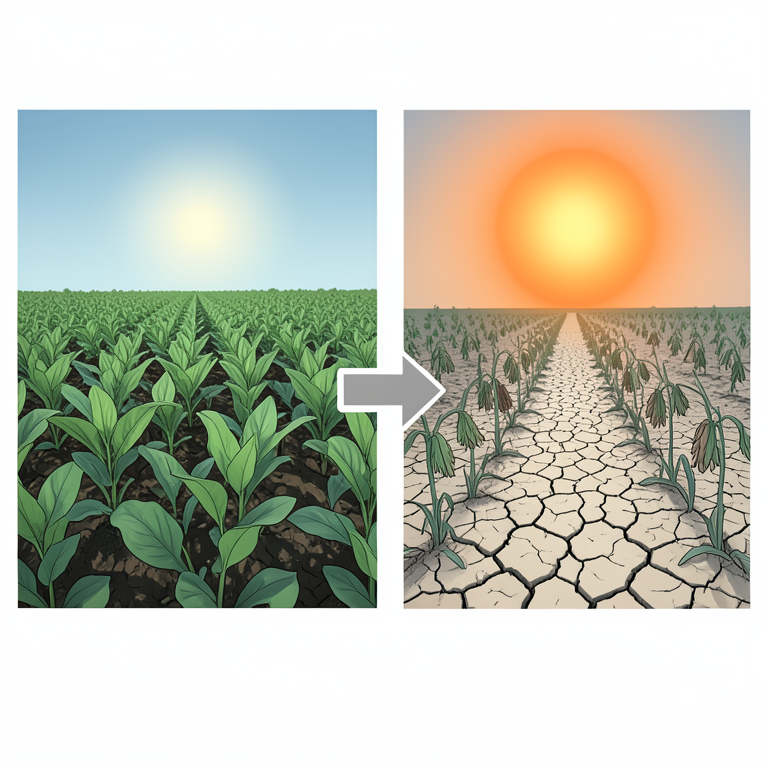
The Paradox of Greening and Drought
AI-generated conceptual illustration (Agricultural landscape of Prakasam District, India). It explains the idea and does not show study data.
View source evidence ↗Figures & tables
From the original paper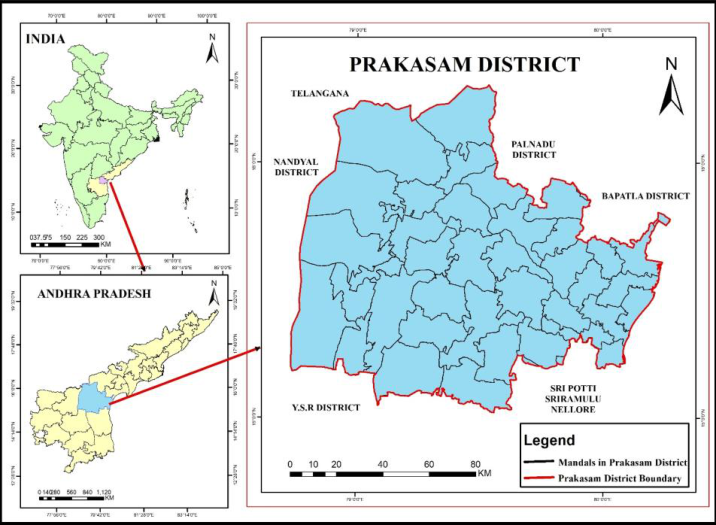 Figure 1
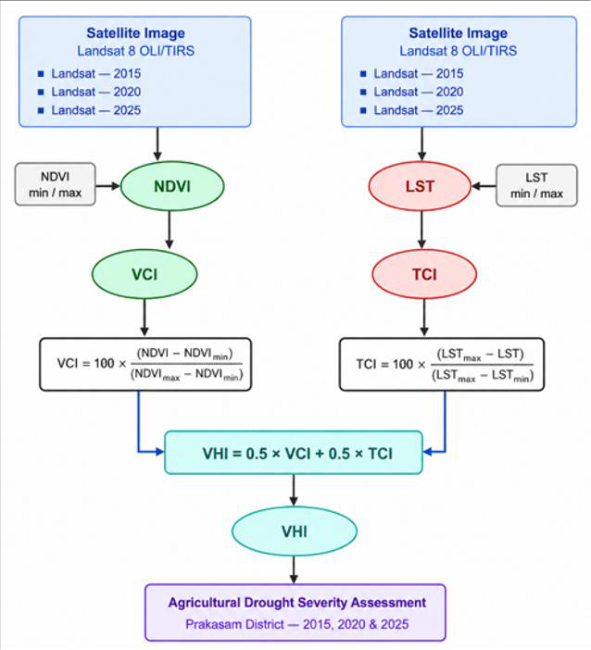 Figure 2
 Table 1
 Table 2
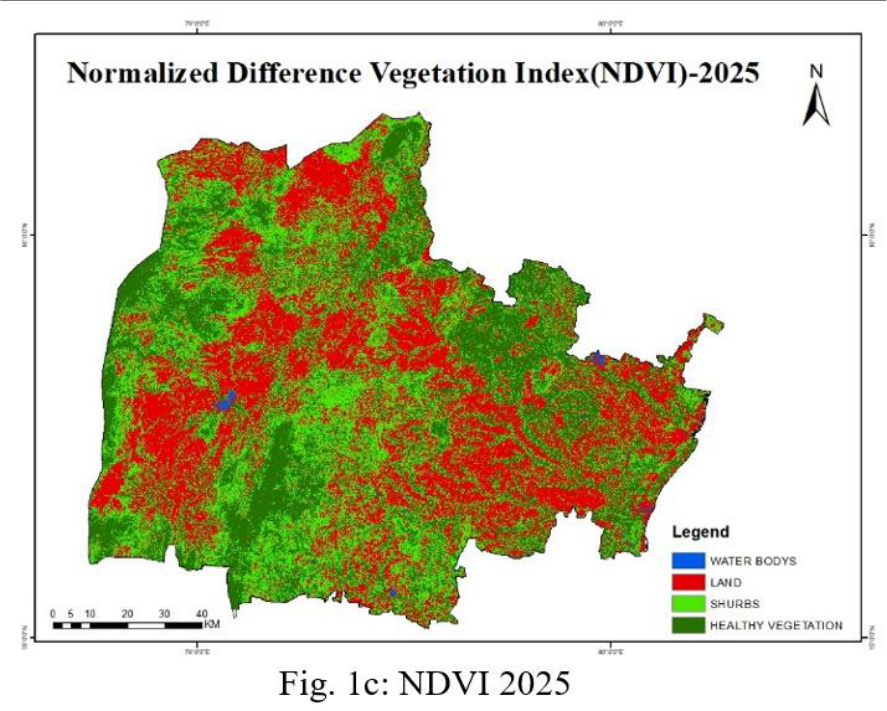 Figure 3
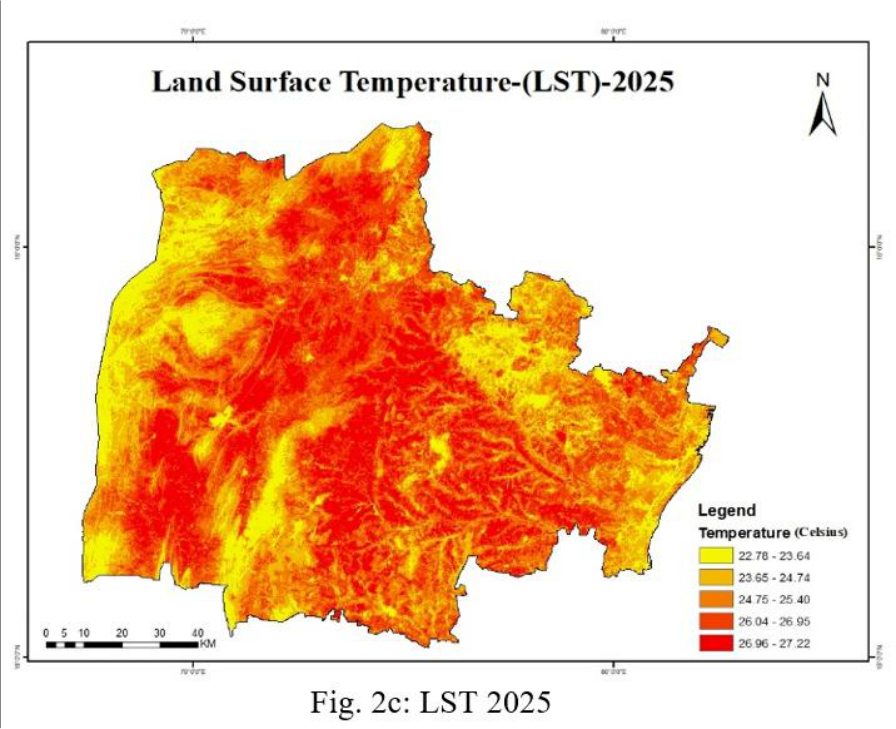 Figure 4
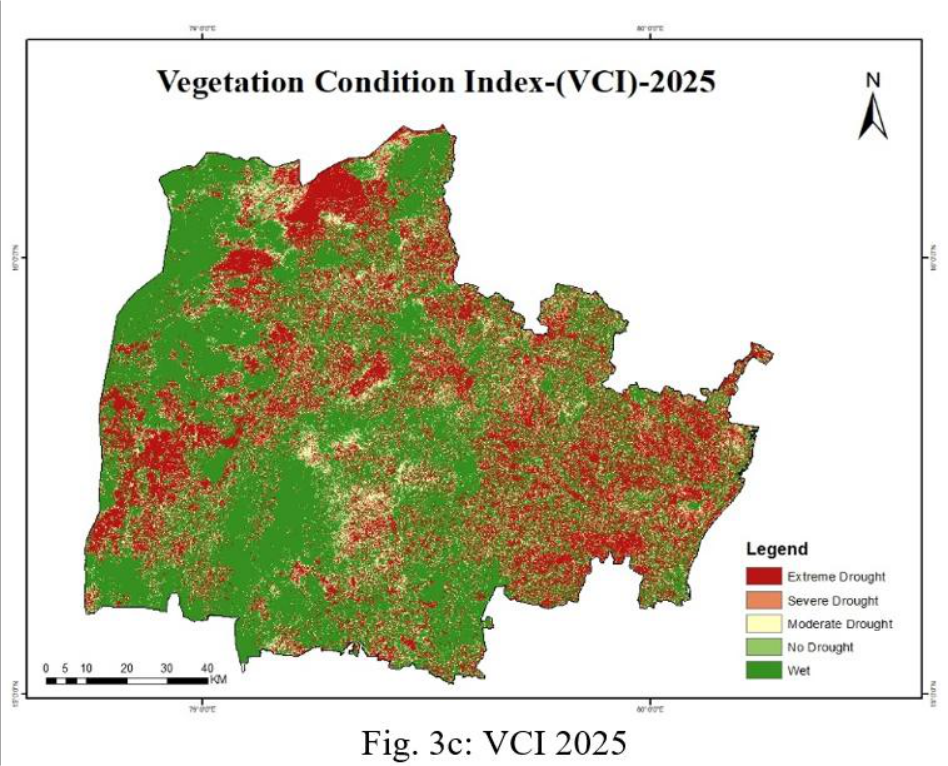 Figure 5
 Table 3
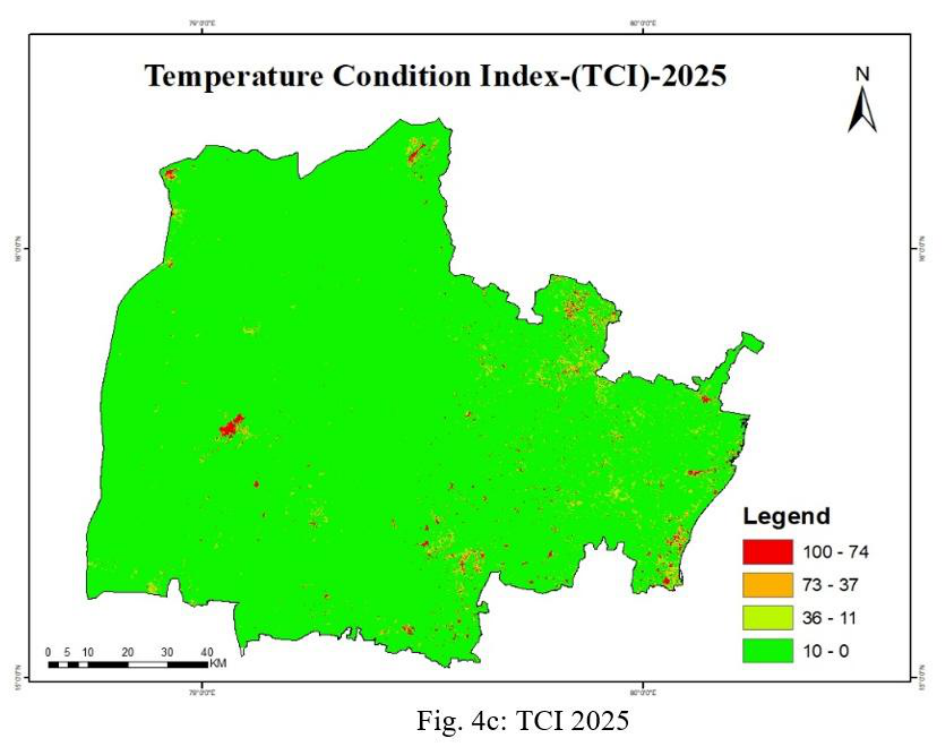 Figure 6
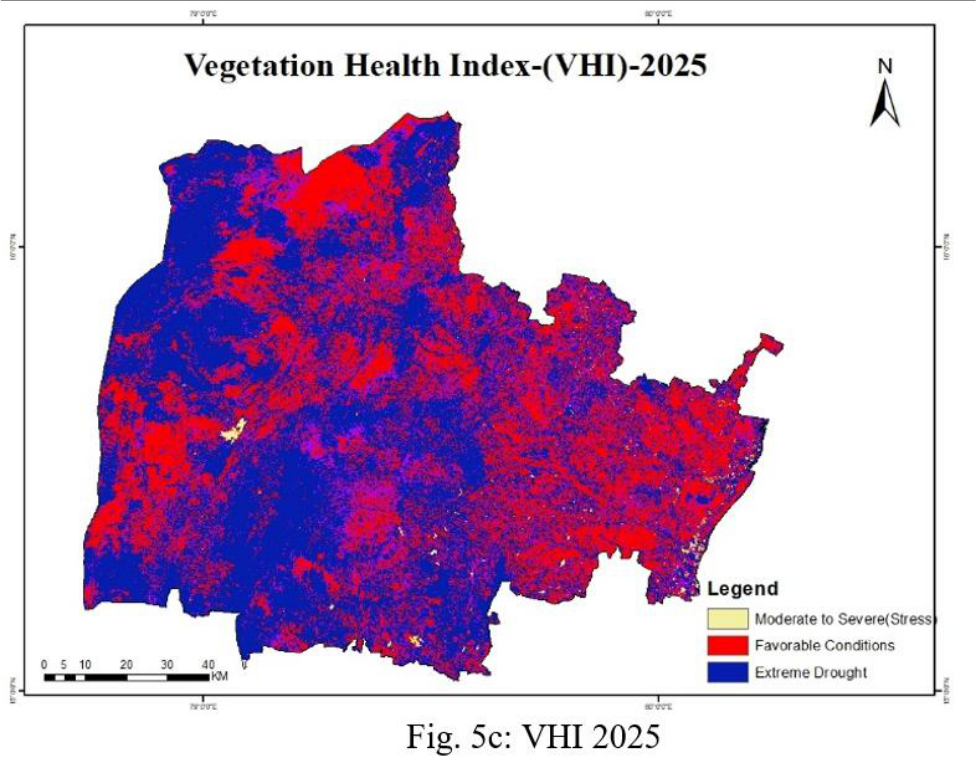 Figure 7
 Table 4
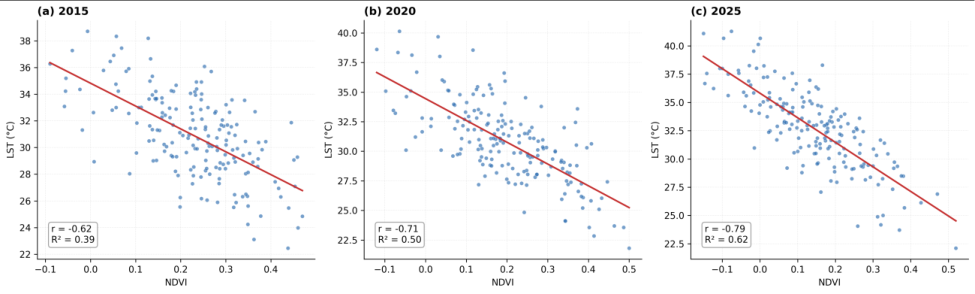 Figure 8
Introduction
Drought is one of the most economically destructive and ecologically pervasive natural hazards, affecting all climatic regions but exerting the greatest impact on agriculture in arid and semi-arid environments (Wilhite and Glantz, 1985; Mishra and Singh, 2010) [75,40] . Unlike rapid-onset disasters, drought develops gradually through meteorological, agricultural, hydrological, and socio-economic stages, making timely detection and mitigation challenging (Mishra and Singh, 2010; Satapathy et al., 2024) [40,57] . Its impacts include crop failure, livestock losses, water scarcity, land degradation, and reduced food security, disproportionately affecting smallholder farmers and rural communities (Godfray et al., 2010; IPCC, 2023) [23,27] . The IPCC Sixth Assessment Report highlights that anthropogenic climate change has intensified the global water cycle, increasing the frequency and severity of drought events (IPCC, 2021, 2023) [26,27] . Rising temperatures and higher potential evapotranspiration further aggravate soil moisture deficits, even during years of near-normal rainfall (Chaubey et al., 2023) [13] . Consequently, reliable agricultural drought monitoring has become a critical scientific and policy priority. Satellite-derived vegetation and thermal indices have transformed agricultural drought monitoring. NDVI is widely used to assess vegetation condition but cannot distinguish natural sparse vegetation from drought stress (Rouse et al., 1974; Pettorelli et al., 2005; Xue and Su, 2017; Alahacoon and Edirisinghe, 2022; Kogan and Guo, 2016) [56,51,76,5,34] . To address this limitation, Kogan (1995) [30] developed VCI and TCI, whose integration as VHI provides a reliable indicator of drought severity validated against crop, rainfall, and soil moisture data (Kogan, 1995, 2001; Kogan et al., 2004; Aswathi et al., 2018; Jiao et al., 2017; Mohamed Adou et al., 2024; Shastri et al., 2025) [30,32,33,6,28,42,59] . The inverse NDVI-LST relationship is a sensitive indicator of vegetation thermal stress (Weng et al., 2004; Sun and Kafatos, 2007; Barbosa et al., 2006; Mondal et al., 2020; Trisasongko et al., 2025) [74,65,8,43,69] . The VCI-TCI-VHI framework has been widely applied worldwide, while GEE and 30 m Landsat imagery enable accurate district-level drought assessment (Massari et [37,66,57,52,18,62,3,63,50,15,49] . India is highly drought-prone, with nearly two-thirds of its area vulnerable and agriculture heavily dependent on monsoon rainfall, making drought a major threat to food security and rural livelihoods ( [1,57,41,14] . Rainfall variability has intensified drought across semi-arid India ( [6,45,3,63,59] . Andhra Pradesh is a drought-prone state where rainfed agriculture dominates, with Anantapur, Kadapa, Chittoor, Kurnool [9,44,35]
Study Area
The united Prakasam District is located in the tropical region of Andhra Pradesh, India, between 15°05′39″ and 16°09′28″ N latitude and 79°05′50″ and 80°10′00″ E longitude (Fig. 1). Prakasam District extends from the Eastern Ghats in the west to the Bay of Bengal coastal plains in the east. The central region is characterized by rocky hills, scrub forests, and stony plains, while the eastern coastal plains consist of fertile alluvial soils with better irrigation potential. Geologically, the district is underlain mainly by Precambrian granite-gneisscomplexes, together with quartzites, sandstones, and shales of the Cuddapah and Kurnool Supergroups, which influence groundwater occurrence and landforms (Subba Rao, 2018; Upadhyay et al., 2006; Reddy and Murthy, 2014) [64,71,55] . The district has a 50 km coastline extending across Naguluppalapadu, Ongole, Kothapatnam, Tangutur, and Singarayakonda mandals, with prominent beaches at Kothapatnam and Pakala (Government of Andhra Pradesh, 2023). Surface drainage is dominated by the Gundlakamma, Musi, and Paleru rivers, with support from smaller rivers and seasonal streams. The Gundlakamma River is the major river system. It supports irrigation through the Gundlakamma Reservoir, Thippayapalem Reservoir, Cumbum Tank, and other irrigation projects, and supplies drinking water to Ongole (Directorate of Economics and Statistics, 2023) [19] . The climate is tropical semi-arid, with moderate coastal conditions and hotter inland uplands. The district records an average maximum temperature of 36 [19,25] . The predominance of rainfed agriculture, coupled with variable rainfall and groundwater stress, makes Prakasam District highly suitable for multi-temporal remote sensingbased agricultural drought assessment.
Data and Methodology
The methodological framework adopted in this study integrates satellite data acquisition and preprocessing, derivation of five remote sensing indices, drought severity classification, and statistical correlation analysis, structured to enable consistent inter-annual comparison across the three benchmark years (Fig. 2). Each stage follows established radiometric and biophysical conventions widely validated in the agricultural drought monitoring literature, as detailed below.
Satellite Data Acquisition and Selection Criteria
Three Landsat scenes with less than 10% cloud cover were obtained from the USGS EarthExplorer portal as the primary data source. Landsat 8 OLI/TIRS imagery was used for 2015 and 2020, and Landsat 9 OLI/TIRS imagery for 2025. Both sensors provide 30 m multispectral and thermal infrared data, with the thermal infrared data resampled from 100 m to 30 m to ensure consistency across the three study years (USGS, 2023) [73] . All scenes were acquired as Collection 2 Level-1 products after screening for cloud cover, scan-line artifacts, and sensor anomalies. Image acquisition dates were selected during the post-monsoon to early pre-monsoon period to minimize cloud contamination while capturing vegetation and thermal conditions representative of cumulative agricultural drought stress (Patel et al., 2012; Mohamed Adou et al., 2024; Adam et al., 2026) [50,42,2] .
Image Preprocessing
All Landsat scenes underwent a standardized preprocessing workflow before index derivation. Radiometric calibration converted digital numbers (DN) to top-of-atmosphere (TOA) reflectance for OLI bands and TOA brightness temperature for the TIRS band using scene-specific metadata coefficients (USGS, 2023) [73] . Atmospheric correction was performed using the Land Surface Reflectance Code (LaSRC) within the USGS Collection 2 processing chain, which uses MODIS-derived water vapor, ozone, aerosol optical thickness, and elevation data to remove atmospheric scattering and absorption effects (USGS, 2022, 2023) [72,73] . Geometric accuracy was verified using the Level-1 Precision and Terrain (L1TP) standard, ensuring sub-pixel co-registration across all scenes and minimizing spurious temporal changes due to image misalignment (USGS, 2023) [73] .
Index Derivation 3.3.1 Normalised Difference Vegetation Index (NDVI)
The Normalised Difference Vegetation Index (NDVI) was derived from the red (Band 4) andnear-infrared (Band 5) bands of Landsat 8 OLI using the method of Rouse et al.
(1974) [56] : [56,51] . Owing to its sensitivity to vegetation condition and climatic variability, NDVI was used as the primary vegetation indicator for drought assessment (Kogan, 1995) [30] .
Land Surface Temperature (LST)
Land Surface Temperature (LST) was estimated from Landsat 8 Thermal Infrared Sensor (Band 10) using the mono-window algorithm (Avdan and Jovanovska, 2016) [7] . Spectral radiance (Lλ) was first calculated from the digital number (DN):
Brightness temperature (BT, in °C) was then derived using the band-specific thermal calibration constants K1 and K2 (USGS, 2023; Avdan and Jovanovska, 2016) [73,7] :
The proportion of vegetation (PV) was computed from NDVI as an intermediate step toward emissivity estimation:
Land surface emissivity (E) was estimated from PV following the empirical linear relationship of Avdan and Jovanovska (2016) [7] :
Finally, LST was calculated by correcting BT for surface emissivity using the Planck-function-derived expression:
where λ is the central wavelength of Landsat 8 Band 10 (10.9 μm), and ρ is the second radiation constant (1.438 × 10⁻² m) (Mikhaylov et al., 2020) [38] . The derived LST was used to assess surface thermal conditions and vegetation stress associated with agricultural drought (Avdan and Jovanovska, 2016) [7] .
Vegetation Condition Index (VCI)
The Vegetation Condition Index (VCI) was computed following the method proposed by Kogan (1995) [30] , which normalises the current NDVI value using the historical minimum and maximum NDVI recorded for each pixel. This approach minimises the influence of differences in vegetation type and highlights the effect of climatic variability on vegetation condition. VCI = 100 × (NDVI -NDVImin) / (NDVImax -NDVImin)… ( 7)
VCI values range from 0 to 100, where lower values indicate severe vegetation stress associated with drought, while higher values represent favorable vegetation conditions. Owing to its ability to capture drought-induced vegetation stress, VCI has been widely used for agricultural drought assessment and monitoring (Kogan, 1995, 1997; Kogan et al., 2004) [30,31,33] .
Temperature Condition Index (TCI)
The Temperature Condition Index (TCI) was calculated following Kogan (1995) [30] by normalising the land surface temperature (LST) with respect to its historical maximum and minimum values for each pixel. The inverse relationship ensures that higher surface temperatures correspond to lower TCI values, indicating greater thermal stress (Aswathi et al., 2018) [6] .
Vegetation Health Index (VHI) and Drought Classification
The Vegetation Health Index (VHI) combines vegetation condition (VCI) and thermal condition (TCI) to assess the combined effects of moisture deficiency and heat stress on vegetation (Kogan, 2001) [32] .
where α = 0.5, giving equal weight to both VCI and TCI, as recommended by Kogan (2001) and Bhuiyan et al. (2006) [10] . VHI values range from 0 to 100, with lower values indicating severe drought conditions and higher values representing healthy vegetation. Owing to its ability to integrate vegetation and thermal stress, VHI has been widely used for agricultural drought monitoring and drought severity assessment (Kogan, 2001; Singh et al., 2003; Bhuiyan et al., 2006) [32,61,10] . Drought severity was classified into five categories following the standard classification proposed by Kogan (2001) (Table 2). For each benchmark year, the minimum and maximum NDVI and LST values from the district-clipped Landsat images were used to normalise VCI and TCI. Although the original method recommends multi-year pixel-based normalisation (Kogan, 1995) [30] , this study adopted a single-date scene-based approach, which is widely used in drought studies (Aswathi et al., 2018; Nag et al., 2024) [6,45] . This approach captures spatial drought variability and enables comparison among the benchmark years.
| 0-10 | Extreme Drought (EXD) | Severe vegetation stress; critical water deficit |
|---|---|---|
| 10-20 | Severe Drought (SED) | Significant reduction in vegetation health |
| 20-30 | Moderate Drought (MOD) | Moderate stress; below-normal vegetation condition |
| 30-40 | Mild Drought (MID) | Slight stress; near-normal conditions |
| > 40 | No Drought (NOD) | Normal or favourable vegetation conditions |
Table text extracted from the original PDF; superscript letters are shown inline. The original table image is below.
View original table image
Statistical Analysis
Pearson's product-moment correlation coefficient (r) was used to evaluate the relationship between NDVI and LST for each benchmark year. Paired pixel values were extracted using a systematic sampling grid across the study area to minimise the influence of spatial autocorrelation (Sun and Kafatos, 2007) [65] . The coefficient of determination (R²) and adjusted R² were also calculated to quantify the variation in LST explained by NDVI and to compare the strength of their relationship across the benchmark years. Statistical significance was evaluated at p< 0.01 using standard regression and raster analysis techniques.
Drought Category Extent Mapping
Following computation of VHI for each benchmark year, the continuous VHI raster was reclassified into five droughtseverity categories, as shown in [10,57] .
Analysis and Results
Analysis and Results
Normalised Difference Vegetation Index (NDVI)
NDVI maps revealed a gradual but spatially uneven improvement in vegetation cover across Prakasam District during the study period (Fig. 3). In 2015, the central and interior mandals were dominated by bare land and sparse vegetation. Similar conditions persisted in 2020, whereas by 2025 the northern and western mandals showed increased shrub and healthy vegetation, indicating improved vegetation conditions, possibly due to favorable rainfall and better land management (Pettorelli et al., 2005; Xue and Su, 2017) [51,76] . NDVI values ranged from approximately -0.20 to +0.57, with the maximum increasing from 0.47 in 2015 to 0.52 in 2025 (Table 4). These values are characteristic of semi-arid, rainfed landscapes and indicate localized vegetation recovery, whereas persistent negative values represent water bodies and barren surfaces (Bhuiyan et al., 2006; Nag et al., 2024) [10,45] . However, NDVI alone cannot fully assess drought conditions because it does not account for climatic variability or thermal stress (Kogan and Guo, 2016) [34] . [74,65,43] . [44,45] .
| Landsat 8 OLI/TIRS | 15 Dec 2015 | 38.72 | 22.45 | 0.47 | −0.09 | −0.62 | 0.38 |
|---|---|---|---|---|---|---|---|
| Landsat 9 OLI/TIRS | 22 Nov 2020 | 40.15 | 21.80 | 0.50 | −0.12 | −0.71 | 0.50 |
| Landsat 9 OLI/TIRS | 18 May 2025 | 41.30 | 22.10 | 0.52 | −0.15 | −0.79 | 0.62 |
Table text extracted from the original PDF; superscript letters are shown inline. The original table image is below.
View original table image
Drought Assessment Using the Vegetation Health Index (VHI)
The Vegetation Health Index (VHI), which combines VCI and TCI, was used to assess the spatial pattern of agricultural drought across Prakasam District (Fig. 7). In 2015, the district showed a mix of moderate to severe drought, with isolated pockets of extreme drought in the river valleys and degraded uplands. By 2020, drought stress intensified, with larger areas falling under the severe and extreme drought categories, particularly in the inland mandals. In 2025, extreme drought became the dominant class across most of the district despite improved NDVI. This contrast is mainly due to the very low TCI values in 2025, which lowered the overall VHI even in areas with moderate to good vegetation condition.
The observed drought pattern is consistent with VHI-based assessments reported from other semi-arid regions of India, indicating that the drought conditions in Prakasam District follow a broader regional trend (Bhuiyan et al., 2006; Gatha Cognition, 2024) [10,21] . The category-wise area presented in Table 3 highlights two consistent trends during the study period. The area under mild drought (MID) increased steadily from 110 km² in 2015 to 150 km² in 2020 and 160 km² in 2025, making it the largest drought category throughout the study period. In contrast, the no-drought (NOD) category remained nearly stable at 30-35 km², indicating that drought-free conditions occupied only a small, consistent portion of the district despite interannual variations in the other drought categories.
| EXD | 26 | 30 | 45 | 55 | 40 | 35 | 48 | 4 | 45 |
|---|---|---|---|---|---|---|---|---|---|
| SED | 34 | 48 | 50 | 28 | 52 | 30 | 22 | 3 | 30 |
| MOD | 63 | 47 | 55 | 38 | 28 | 30 | 44 | 8 | 45 |
| MID | 65 | 20 | 110 | 45 | 20 | 150 | 42 | 10 | 160 |
| NOD | 30 | 5 | 30 | 25 | 7 | 35 | 18 | 4 | 35 |
Table text extracted from the original PDF; superscript letters are shown inline. The original table image is below.
View original table image
LST-NDVI Correlation Analysis
The relationship between LST and NDVI was analysed for each benchmark year to evaluate the influence of vegetation cover on surface temperature (Fig. 8; Table 4). In 2015, NDVI ranged from -0.09 to 0. [65,43,69] . Across all three years, built-up areas and bare land recorded the highest LST, whereas vegetated areas and water bodies consistently showed lower temperatures, highlighting the important role of vegetation in regulating surface thermal conditions (Weng et al., 2004; Sun and Kafatos, 2007) [74,65] .
Discussion
The multi-indicator remote sensing analysis presented here reveals a complex and, at first glance, counterintuitive drought trajectory for Prakasam District over the 2015-2025 decade. The co-occurrence of improving NDVI values and expanding extreme drought, as classified by VHI, warrants careful interpretation, situated in relation to the global, national, and regional literature reviewed in Section 1.
Reconciling Vegetation Greening with Expanding Drought Severity
The IPCC AR6 reports that vegetation greening can occur alongside increasing moisture and thermal stress when rising temperatures outweigh the benefits of increased rainfall (IPCC, 2021, 2023) [26,27] [44,53] . The strengthening negative correlation between NDVI and LST (r = -0.62 to -0.79) further supports this observation.
Vegetation improvement was mainly confined to intervention-supported mandals, whereas the interior and eastern parts of the district remained thermally stressed with sparse vegetation. These findings indicate that although vegetation condition improved in some areas, drought stress continued across much of the district, highlighting the uneven spatial impact of drought mitigation measures (Weng et al., 2004; Sun and Kafatos, 2007; Trisasongko et al., 2025) [74,65,69] .
The Role of Acquisition Timing in the 2025 VHI Signal
The widespread extreme drought, as indicated by VHI in 2025, was strongly influenced by the very low TCI values derived from the Landsat image acquired on 18 May 2025, during the peak pre-monsoon period, when thermal stress is generally highest over peninsular India (Directorate of Economics and Statistics, 2023) [19] . Nevertheless, the increase in maximum LST from 38.72°C in 2015 to 41.30°C in 2025 suggests a genuine intensification of drought conditions, consistent with CMIP6 projections and the IPCC Sixth Assessment Report (IPCC, 2021; Chuphal et al., 2024) [26,14] . The large interannual variation in TCI is mainly due to the use of scene-based normalization rather than the multi-year, pixel-wise approach proposed by Kogan (1995) [30] . Therefore, although the 2025 VHI indicates intensified thermal drought stress, its magnitude relative to 2015 and 2020 should be interpreted with caution and verified using longer time-series, rainfall, or soil moisture data (Bhuiyan et al., 2006; Singh et al., 2003) [10,61] .
Consistency with Drought Patterns Across Peninsular and Semi-Arid India
The drought pattern observed in Prakasam District is consistent with the increasing agricultural drought reported across semi-arid India. The expansion of the mild drought category from 110 km² in 2015 to 160 km² in 2025 aligns with the projected increases in drought frequency and severity for peninsular India (Aadhar and Mishra, 2024; Chuphal et al., 2024) [1,14] . Similarly, the predominance of moderate to extreme drought identified through VHI is comparable with findings from the Bhima Basin and the Bundelkhand Plateau (Gatha Cognition, 2024; ScienceDirect, 2026), suggesting that the observed drought pattern reflects a broader regional trend. Compared with earlier studies in Andhra Pradesh, which mainly relied on rainfall-based or composite drought indices (Murthy et al., 2015; Kumar et al., 2019) [44,35] , the present study integrates 30 m Landsat-derived NDVI, LST, VCI, TCI, and VHI to provide a detailed mandal-level assessment of agricultural drought. This approach improves the spatial representation of drought conditions and provides useful information for drought monitoring and regional planning.
Implications for Drought Policy and Adaptation
The findings highlight the need for drought monitoring systems to integrate multiple remote sensing indices rather than relying on NDVI or LST alone, as vegetation and thermal responses may differ under changing climatic conditions. The use of multi-date imagery and long-term TCI normalization would further improve the reliability of inter-annual drought assessment (Kogan, 1995; Bhuiyan et al., 2006) [30,10] . The persistence of drought despite localized vegetation improvement emphasizes the need to promote droughttolerant, short-duration crops, expand drip and sprinkler irrigation, and strengthen extension and credit support for farmers (Aher and Yadav, 2021; Nair and Thomas, 2022; Samuel et al., 2024). Expanding soil and water conservation measures in the interior and eastern mandals, together with the use of longer satellite time series and seasonal climate forecasts, would further enhance drought monitoring and climate resilience (Aadhar and Mishra, 2024; Chuphal et al., 2024) [1,14] .
Conclusion
This study demonstrated the usefulness of an integrated remote sensing approach using NDVI, LST, VCI, TCI, and VHI derived from Landsat 8/9 imagery to assess the spatiotemporal dynamics of agricultural drought in Prakasam District, Andhra Pradesh, during 2015, 2020, and 2025. The results revealed a clear increase in thermal stress, with maximum LST rising from 38.72°C in 2015 to 41.30°C in 2025. Although maximum NDVI increased slightly from 0.47 to 0.52, indicating localized vegetation improvement, the negative relationship between NDVI and LST strengthened (r = -0.62 to -0.79), reflecting an increasing influence of vegetation on surface temperature. Despite this improvement in vegetation, VHI indicated an overall increase in drought severity, with the mild drought category expanding from 110 km² in 2015 to 160 km²in 2025, while no-drought conditions remained limited to 30-35 km². The findings indicate that localized vegetation recovery alone is insufficient to reduce district-level drought vulnerability when thermal stress continues to intensify. Therefore, integrating vegetation-and temperature-based indices provides a more reliable assessment of agricultural drought than using NDVI alone. This study provides the first Landsat-based, multi-temporal assessment of agricultural drought at 30 m resolution in Prakasam District. It offers a practical framework applicable to other drought-prone regions in semi-arid India. The results highlight the need to promote drought-tolerant crops, expand micro-irrigation, strengthen soil and water conservation measures, and incorporate long-term satellite, rainfall, soil moisture, and crop yield data to improve drought monitoring and climate-resilient agricultural planning.
Figures and tables from the paper
| 1 | Landsat 8 OLI/TIRS | 15 December 2015 | NDVI, LST, VCI, TCI | < 10% | 30 m | USGS EarthExplorer |
|---|---|---|---|---|---|---|
| 2 | Landsat 9 OLI/TIRS | 22 November 2020 | NDVI, LST, VCI, TCI | < 10% | 30 m | USGS EarthExplorer |
| 3 | Landsat 9 OLI/TIRS | 18 May 2025 | NDVI, LST, VCI, TCI | < 10% | 30 m | USGS EarthExplorer |
Table text extracted from the original PDF; superscript letters are shown inline. The original table image is below.
View original table image
References
75 in the original paper- Adam AA, Musa FI, Lalruatkimi C, Yasin EHE, Thawmmawii L, Alfadol AIA, et al. Satellite-based drought assessment in Sudan's major mechanized rainfed agriculture. Sci Rep. 2026. https://doi.org/10.1038/s41598-026-49618-5
- Agarwal V, Panday P, Kumar A. Integrated remote sensing for enhanced drought assessment: A multiindex approach in Rajasthan, India. Earth Space Sci. 2025;12:e2024EA003639. https://doi.org/10.1029/2024EA003639
- Aher NS, Yadav SS. Adoption of micro-irrigation technologies in the semi-arid Vidarbha region of Maharashtra: Constraints and opportunities. J Water Resour Irrig Manag. 2021;10(2):45-56.
- Alahacoon N, Edirisinghe M. A comprehensive assessment of remote sensing and traditional-based drought monitoring indices at global and regional scale. Geomatics Nat Hazards Risk. 2022;13(1):762-799. https://doi.org/10.1080/19475705.2022.2044394
- Aswathi PV, Nikam BR, Chouksey A, Aggarwal SP. Assessment and monitoring of agricultural droughts in Maharashtra using meteorological and remote sensingbased indices. ISPRS Ann Photogramm Remote Sens Spat Inf Sci. 2018;4:253-264.
- Avdan U, Jovanovska G. Algorithm for automated mapping of land surface temperature using Landsat 8 satellite data. J Sens. 2016;2016:1480307. https://doi.org/10.1155/2016/1480307
- Barbosa HA, Huete AR, Baethgen WE. A 20-year study of NDVI variability over the northeast region of Brazil. J Arid Environ. 2006;67(2):288-307. https://doi.org/10.1016/j.jaridenv.2006.02.022
- Bhardwaj A, Mishra VN. Integrating multi-temporal remote sensing and advanced drought modeling to assess desertification dynamics in semi-arid Andhra Pradesh, India: A framework for sustainable land management. Remote Sens Appl Soc Environ. 2025;38:101478. https://doi.org/10.1016/j.rsase.2025.101478
- Bhuiyan C, Singh RP, Kogan FN. Monitoring drought dynamics in the Aravalli region (India) using different indices based on ground and remote sensing data. Int J Appl Earth Obs Geoinf. 2006;8(4):289-302. https://doi.org/10.1016/j.jag.2006.03.002
- Central Ground Water Board. Ground Water Year Book -Andhra Pradesh. Hyderabad: Central Ground Water Board, South Eastern Coastal Region; 2020.
- Chandra Sekhar C, Naidu MVS, Ramprakash T, Balaguravaiah D. Characterization and classification of soils in the central parts of the Prakasam district, Andhra Pradesh, India. Int J Curr Microbiol Appl Sci. 2017;6(10):318-330.
- Chaubey M, Kumar A, Mishra V. Intensification of extreme rainfall in Indian river basins: Using biascorrected CMIP6 climate data. Earths Future. 2023;11:e2023EF003556. https://doi.org/10.1029/2023EF003556
- Chuphal DS, Srivastava S, Mishra V. Increasing frequency of droughts in India under future climate. Environ Res Lett. 2024. https://doi.org/10.1088/17489326/ad1f2f
- Dhawale R. A comparative analysis of drought indices on vegetation through remote sensing for the Latur region of India. Int Arch Photogramm Remote Sens Spatial Inf Sci. 2018;XLII-5:403-408. https://doi.org/10.5194/isprs-archives-xlii-5-403-2018
- Deccan Chronicle. With no pre-monsoon rainfall, drought-like situation in Andhra. PressReader. June 18, 2019. https://www.pressreader.com/india/hindustantimes-ranchi/20190618/281887299828862
- Deccan Chronicle. 3 Prakasam villages overcome water scarcity. April 9, 2026. https://www.deccanchronicle.com/southernstates/andhra-pradesh/3-prakasam-villages-overcomewater-scarcity-1949558
- Dilshad T, Qamar MU, Khan SN, Ahmad S. Agricultural drought forecasting using remote sensing: A hybrid modeling framework integrating wavelet transformation and machine learning. Agric Water Manag. 2025;312:109382. https://doi.org/10.1016/j.agwat.2025.109382
- Directorate of Economics and Statistics, Government of Andhra Pradesh. District Handbook of Statistics 2023: Prakasam District. Amaravati: Government of Andhra Pradesh; 2023.
- Down To Earth. In some places, you have to dig 130 feet down to get groundwater; that's how bad it is. April 22, 2024. https://www.downtoearth.org.in/water/insome-places-you-have-to-dig-40-metres-down-toaccess-groundwater-that-s-how-bad-it-is-60364
- Gatha Cognition. Remote sensing-based assessment of agricultural droughts in sub-watersheds of Upper Bhima Basin, India. Gatha Cogn J Geospat Sci. 2024.
- Ghaleb F, Mario M, Sandra AN. Regional Landsatbased drought monitoring from 1982 to 2014. Climate. 2015;3(3):563-577. https://doi.org/10.3390/cli3030563
- Godfray HCJ, Beddington JR, Crute IR, Haddad L, Lawrence D, Muir JF, et al. Food security: The challenge of feeding 9 billion people. Science. 2010;327(5967):812-818. https://doi.org/10.1126/science.1185383
- Hallik L, Kuusk A, Lang M, Kuusk J. Reflectance properties of hemiboreal mixed forest canopies with focus on the red edge and near-infrared spectral regions. Remote Sens. 2019;11(14):1717. https://doi.org/10.3390/rs11141717
- ICAR-CRIDA. Agriculture Contingency Plan for District: Prakasam. Hyderabad: ICAR-Central Research Institute for Dryland Agriculture; 2014.
- IPCC. Climate Change 2021: The Physical Science Basis. Contribution of Working Group I to the Sixth Assessment Report of the Intergovernmental Panel on Climate Change. Cambridge: Cambridge University Press; 2021. https://doi.org/10.1017/9781009157896
- IPCC. Climate Change 2023: Synthesis Report. Contribution of Working Groups I, II and III to the Sixth Assessment Report of the Intergovernmental Panel on Climate Change. Geneva: IPCC; 2023. https://doi.org/10.59327/IPCC/AR6-9789291691647
- Jiao Y, Lei H, Yang D, Huang M, Liu D, Yuan X. Impact of vegetation dynamics on hydrological processes in a semi-arid basin using a land surfacehydrology coupled model. J Hydrol. 2017;551:116-131. https://doi.org/10.1016/j.jhydrol.2017.05.060
- Journal of Current Research. Climate, rainfall and drought: A study of Andhra Pradesh. Int J Curr Res. 2021;13(5).
- Kogan FN. Application of vegetation index and brightness temperature for drought detection. Adv Space Res. 1995;15(11):91-100. https://doi.org/10.1016/0273-1177(95)00079-T
- Kogan FN. Global drought watch from space. Bull Am Meteorol Soc. 1997;78(4):621-636.
- Kogan FN. Operational space technology for global vegetation assessment. Bull Am Meteorol Soc. 2001;82(9):1949-1964. https://doi.org/10.1175/15200477(2001)082<1949:OSTFGV>2.3.CO;2
- Kogan F, Stark R, Gitelson A, Jargalsaikhan L, Dugrajav C, Tsooj S. Derivation of pasture biomass in Mongolia from AVHRR-based vegetation health indices. Int J Remote Sens. 2004;25(14):2889-2896. https://doi.org/10.1080/01431160410001697619
- Kogan F, Guo W. Early twenty-first-century droughts during the warmest climate. Geomatics Nat Hazards Risk. 2016;7(1):127-137. https://doi.org/10.1080/19475705.2013.878399
- Kumar PV, Osman M, Mishra P. Development and application of a new drought severity index for categorizing drought-prone areas: A case study of undivided Andhra Pradesh state, India. Nat Hazards. 2019;97:793-812. https://doi.org/10.1007/s11069-01903683-6
- Kundu A, Denis DM, Patel NR, Dutta D. A geostatistical approach to assess the spatial variability of Vegetation Health Index (VHI) using Landsat data. Egypt J Remote Sens Space Sci. 2016;19(2):195-207.
- Massari C, Modanesi S, Camici S, Brocca L, Puca S, Avanzi F. A comprehensive remote sensing-based agriculture drought condition indicator (CADCI) using machine learning. Environ Chall. 2023;11:100711. https://doi.org/10.1016/j.envc.2023.100711
- Mikhaylov A, Moiseev N, Aleshin K, Burkhardt T. Global climate change and greenhouse effect. Entrepreneurship Sustain Issues. 2020;7(4):2897-2913. https://doi.org/10.9770/jesi.2020.7.4(21
- Mindat. Prakasam District, Andhra Pradesh, India - geological locality records. 2024. https://www.mindat.org/loc-235185.html
- Mishra AK, Singh VP. A review of drought concepts. J Hydrol. 2010;391(1-2):202-216. https://doi.org/10.1016/j.jhydrol.2010.07.012
- Mishra V, Aadhar S, Asoka A. On the frequency of the 2015 monsoon season drought in the Indo-Gangetic Plain. Geophys Res Lett. 2019;46:2402-2410. https://doi.org/10.1029/2018GL081406
- Mohamed Adou Sidi Almouctar M, Wu Y, Zhao F, Qin C. Drought analysis using normalized difference vegetation index and land surface temperature over the Niamey region, southwestern Niger, 2013-2019. J Hydrol Reg Stud. 2024;52:101689. https://doi.org/10.1016/j.ejrh.2024.101689
- Mondal B, Das DN, Dolui G, Mukherjee A. Land surface temperature and NDVI relationship: A seasonal study on a tropical city. Discover Appl Sci. 2020;2(9). https://doi.org/10.1007/s42452-020-03458-8
- Murthy CS, Sai MVRS, Srivasatava SK, Roy PS, Chandrasekharan R. Vulnerability of agriculture to drought conditions: A composite index study at mandal level for undivided Andhra Pradesh. Int J Disaster Risk Reduct. 2015;12:328-338.
- Nag TC, Rath B, Mohanty TR, Sahu C, Panigrahi G, Dugal D. Evaluating the utility of normalized difference vegetation index (NDVI) and vegetation condition index (VCI) for monitoring drought in Bolangir District of Odisha. Int J Res Agron. 2024;7(12):880-883. https://doi.org/10.33545/2618060x.2024.v7.i12k.2280
- Naidu MVS, Ramavatharam N, Rao PC. Genesis, characterization and classification of soils from selected parts of Prakasam district in Andhra Pradesh, India. J Indian Soc Soil Sci. 2020;68(2):121-134.
- National Disaster Management Authority (NDMA), Government of India. National Disaster Management Guidelines: Management of Drought. New Delhi: NDMA; 2010.
- Nair R, Thomas T. Barriers to micro-irrigation adoption among smallholder farmers in semi-arid India: A review. Agric Water Manag. 2022;270:107727.
- Özdemir Y. A seasonal bird occurrence dataset from Karataş Lake (Burdur, Turkey) with associated NDVI and climate data, 2021 to 2022. Biodivers Data J. 2026. https://doi.org/10.3897/bdj.14.e200154
- Patel NR, Parida BR, Venus V, Saha SK, Dadhwal VK. Analysis of agricultural drought using vegetation temperature condition index (VTCI) from Terra/MODIS satellite data. Environ Monit Assess. 2012;184(12):7153-7163. https://doi.org/10.1007/s10661-011-2488-y
- Pettorelli N, Vik JO, Mysterud A, Gaillard JM, Tucker CJ, Stenseth NC. Using the satellite-derived NDVI to assess ecological responses to environmental change. Trends Ecol Evol. 2005;20(9):503-510. https://doi.org/10.1016/j.tree.2005.05.011
- Rahmati A, Khosravi K, Shahedi K. Assessment of agricultural drought severity using multi-temporal remote sensing data in Lorestan region. Sci Rep. 2025;15:18347. https://doi.org/10.1038/s41598-02503087-4
- Rao CAR, Samuel J, Beevi CNA, Raju BMK, Reddy AA, Kumar RN, et al. Enhancing farm income resilience through climate-smart agriculture in droughtprone regions of India. Front Water. 2024;6:1327651. https://doi.org/10.3389/frwa.2024.1327651
- Reddy DV. Hydrogeochemical characteristics in groundwater of the southeastern part of Prakasam district, Andhra Pradesh, India. Appl Water Sci. 2018;8:47. https://doi.org/10.1007/s13201-018-0665-2
- Reddy KS, Murthy KSR. Soil resource mapping and assessment of soils at different physiographic divisions in selected mandals of Prakasam district, Andhra Pradesh: A remote sensing and GIS approach. J Indian Soc Soil Sci. 2014;62(3):215-224.
- Rouse JW, Haas RH, Schell JA, Deering DW. Monitoring vegetation systems in the Great Plains with ERTS. In: Proceedings of the Third Earth Resources Technology Satellite Symposium. Greenbelt, MD: NASA; 1974. p. 301-317.
- Satapathy T, Dietrich J, Ramadas M. Agricultural drought monitoring and early warning at the regional scale using a remote sensing-based combined index. Environ Monit Assess. 2024;196:1136. https://doi.org/10.1007/s10661-024-13265-y
- Spatio-temporal dynamics of drought using remotesensing data and Google Earth Engine (GEE) in the semi-arid region of India. J Arid Environ. 2026.
- Shastri A, Modi A, Shah R, Patel H. Use of satellitebased remote sensing indices for agricultural drought monitoring in Saurashtra, Gujarat. Meteorol Appl. 2025;32:e70132. https://doi.org/10.1002/met.70132
- Shriram Farm Solutions. Top drought-resistant crops for Indian farmers facing water scarcity. 2025. https://shriramfarmsolutions.com/blog/top-droughtresistant-crops-for-indian-farmers-facing-waterscarcity/
- Singh RP, Roy S, Kogan F. Vegetation and temperature condition indices from NOAA AVHRR data for drought monitoring over India. Int J Remote Sens. 2003;24(22):4393-4402. https://doi.org/10.1080/0143116031000084323
- Stefan M, Ghiulescu V, Cirtina D, Popescu F. Remote sensing evaluation of drought effects on crop yields across Dobrogea, Romania, using Vegetation Health Index (VHI). Agriculture. 2025;15(7):668. https://doi.org/10.3390/agriculture15070668
- Subash N, Agarwal V, Kumar A. Integrating cloudbased geospatial analysis for understanding spatiotemporal drought dynamics and microclimate variability in Rajasthan. J Indian Soc Remote Sens. 2025. https://doi.org/10.1007/s12524-025-02139-6
- Subba Rao N. Groundwater quality from a part of Prakasam District, Andhra Pradesh, India. Appl Water Sci. 2018;8:17. https://doi.org/10.1007/s13201-0180665-2
- Sun D, Kafatos M. Note on the NDVI-LST relationship and the use of temperature-related drought indices over North America. Geophys Res Lett. 2007;34(24):L24406. https://doi.org/10.1029/2007GL031485
- Tadesse BT, Mengistu DA, Feyisa GL. Spatial drought occurrences and distribution using VCI, TCI, VHI, and Google Earth Engine in the Bilate River Watershed, Rift Valley of Ethiopia. Geomatics Nat Hazards Risk. 2024;15(1):2377672. https://doi.org/10.1080/19475705.2024.2377672
- Testbook. Soils in Andhra Pradesh: Check all types of soil and their features. 2023. https://testbook.com/andhra-pradesh-gk/soils-inandhra-pradesh
- Tripathy KP, Mukherjee S, Mishra AK. Rapid amplification of compound drought and heatwave risk over India. Nat Hazards Earth Syst Sci. 2026;26:791812. https://doi.org/10.5194/nhess-26-791-2026
- Trisasongko BH, Wijaya R, Paull DJ. Variation of vegetation cover and the relationship with land surface temperature across Thailand (2007-2022). Sci Rep. 2025;15:26894. https://doi.org/10.1038/s41598-02513018-y
- Unganai LS, Kogan FN. Drought monitoring and corn yield estimation in Southern Africa from AVHRR data. Remote Sens Environ. 1998;63(3):219-232. https://doi.org/10.1016/S0034-4257(97)00132-6
- Upadhyay D, Raith MM, Mezger K, Hammerschmidt K. Mesoproterozoic rift-related alkaline magmatism at Elchuru, Prakasam alkaline province, SE India. Lithos. 2006;89(3-4):447-477. https://doi.org/10.1016/j.lithos.2005.12.011
- USGS. Landsat 8-9 Collection 2 Level-2 Science Product Guide. U.S. Geological Survey; 2022. https://www.usgs.gov/landsat-missions
- USGS. Landsat 8-9 Collection 2 Level-1 Data Format Control Book. U.S. Geological Survey; 2023. https://www.usgs.gov/landsat-missions
- Weng Q, Lu D, Schubring J. Estimation of land surface temperature-vegetation abundance relationship for urban heat island studies. Remote Sens Environ. 2004;89(4):467-483. https://doi.org/10.1016/j.rse.2003.11.005
- Wilhite DA, Glantz MH. Understanding the drought phenomenon: The role of definitions. Water Int. 1985;10(3):111-120. https://doi.org/10.1080/02508068508686328
- Xue J, Su B. Significant remote sensing vegetation indices: A review of developments and applications. J Sens. 2017;2017:1353691. https://doi.org/10.1155/2017/1353691