
Research article · 2026 · Full text
International Journal of Horticulture and Food ScienceBehaviour of banana arrivals and prices in APMC, Kalamna, Nagpur
Volume 8(8) · Pages 43–47 · DOI: 10.33545/26631067.2026.v8.i8a.835 ↗
Research areasEconomics of Agriculture and Food MarketsAgricultural Economics and PracticesAgriculture and Agroindustry Studies
Abstract
Author-writtenBanana is an important fruit crop in India and is widely traded through wholesale markets. The present study was undertaken to examine the growth, variability, instability, and trend in banana arrivals and prices at APMC Kalamna, Nagpur, Maharashtra, during 2015-2025. Monthly secondary data on banana arrivals and prices were analysed using the Compound Growth Rate (CGR), Coefficient of Variation (CV), Cuddy-Della Valle Instability Index (CDVI), and trend models. The results indicated that banana arrivals recorded a positive but very low growth rate of 0.004 per cent, which was statistically significant. Arrivals indicated a high coefficient of variation (81.17%) and instability index (35.79%), indicating substantial fluctuations over time. Banana prices recorded a positive and statistically significant growth rate of 0.18 per cent, while their coefficient of variation and instability index were both 3.15 per cent, indicating comparatively lower variability and instability. Trend analysis revealed that the Cubic model provided the best fit for banana arrivals, with an R² value of 0.84, whereas the Inverse model was the best-fitting model for banana prices, with an R² value of 0.13. The low R² for prices suggests that time trend alone did not adequately explain their variation. Overall, banana arrivals were considerably more variable and unstable than prices during the study period. The findings provide useful insights into banana market behaviour and may assist farmers, traders, and market authorities in making informed marketing decisions at APMC Kalamna, Nagpur.
Summary
Source-checkedPlain-language reading of the full paper, prepared with AI and checked against the text. Each point links to the authors' own words.
Why it matters
- Banana is a significant fruit crop in India and is commonly traded via wholesale markets. View evidence ↗
- Because bananas are perishable, proper management of harvesting, handling, and transport is critical to prevent quality decline. View evidence ↗
- Nagpur serves as an important wholesale trading hub for bananas, even though it is not one of India's primary banana-producing districts. View evidence ↗
The question
- The study aimed to analyze the growth, variability, instability, and trends of banana arrivals and prices at the APMC Kalamna market in Nagpur from 2015 to 2025. View evidence ↗
What they did
- The researchers analyzed monthly time-series data on banana arrivals and prices over an 11-year period from 2015 to 2025. View evidence ↗
- Secondary data were sourced from the AGMARKNET portal and the official records of APMC Kalamna, Nagpur. View evidence ↗
- The analysis employed the Compound Growth Rate (CGR), Coefficient of Variation (CV), Cuddy-Della Valle Instability Index (CDVI), and various trend models. View evidence ↗
What they found
- Banana arrivals showed a statistically significant but very small positive compound growth rate of 0.004% between 2015 and 2025. View evidence ↗
- Banana prices experienced a positive and statistically significant compound growth rate of 0.18%. View evidence ↗
- The Inverse model was the best fit for banana prices, although its R² value of 0.13 indicates a very low explanatory power. View evidence ↗
- There was a distinct difference in behavior between the two variables: arrivals were highly unstable and variable, while prices remained relatively stable. View evidence ↗
What it means
- The authors conclude that fluctuations in banana market arrivals did not lead to corresponding changes in prices. View evidence ↗
- The study's findings are intended to help farmers, traders, and market authorities make better-informed marketing decisions. View evidence ↗
- The authors note that time trends alone could not adequately explain price variations, suggesting other influencing factors were at play. View evidence ↗
Visual summary
1 visualsIllustrations explain the paper; they do not show study data.
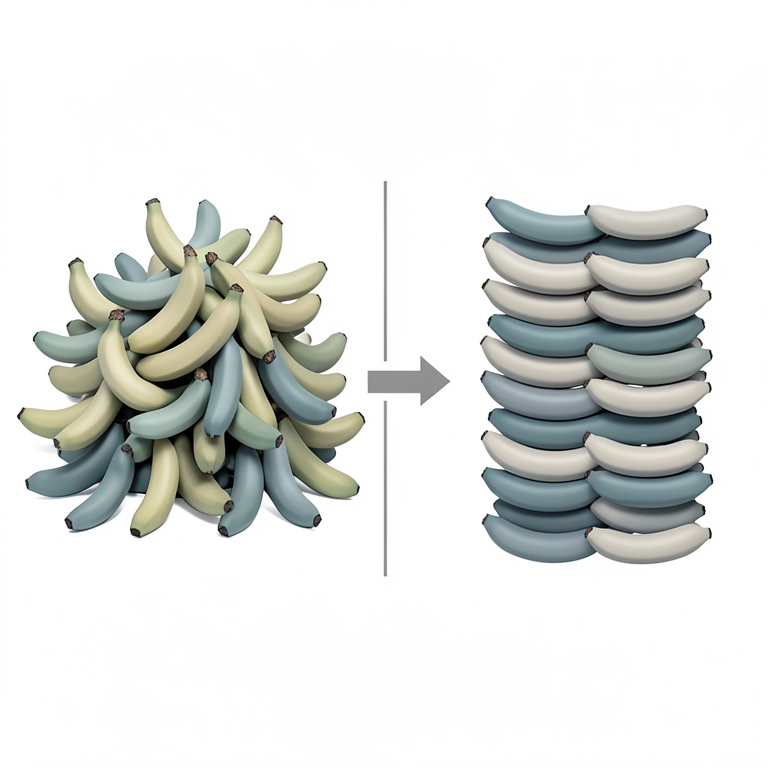
Arrivals vs. Price Stability
AI-generated conceptual illustration (bananas in a wholesale agricultural market setting). It explains the idea and does not show study data.
View source evidence ↗Figures & tables
From the original paper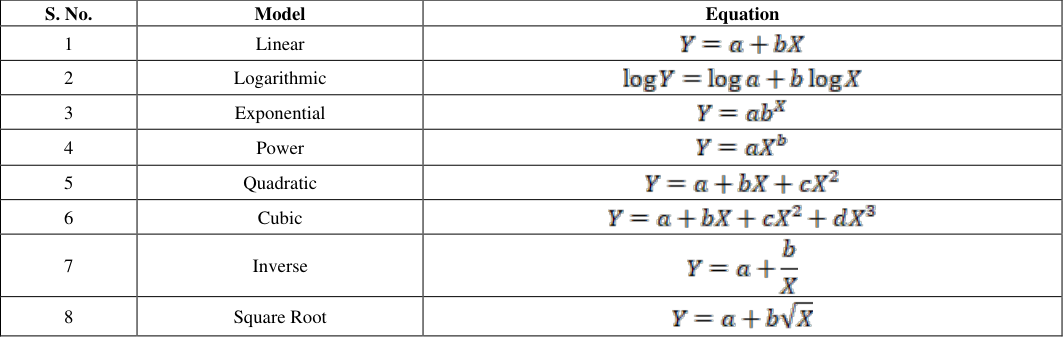 Table 1
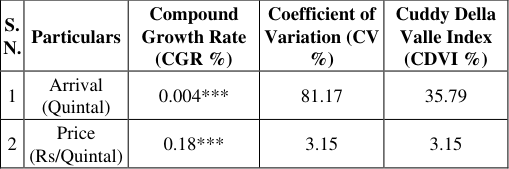 Table 2
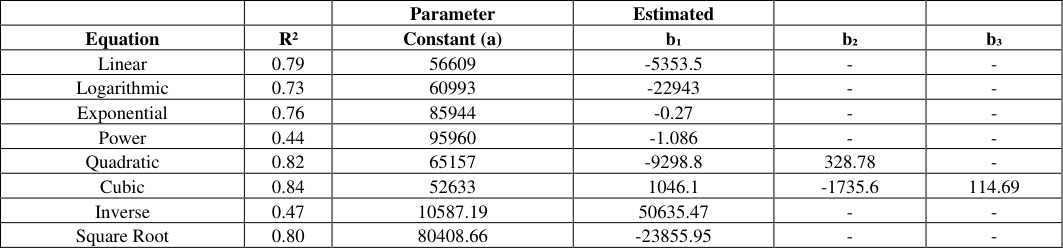 Table 3
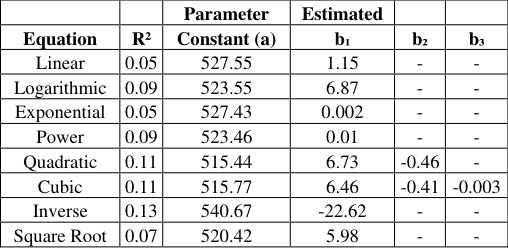 Table 4
Introduction
Banana is one of the important fruit crops cultivated and traded in many parts of the world. The crop supports a wide range of people involved in production, harvesting, transportation, wholesale trading and retail marketing. Since banana is a perishable fruit, its quality can decline quickly when harvesting, handling, transportation and marketing are not properly managed. Efficient movement of the produce is therefore important for reducing losses and maintaining market quality. India has a major role in world banana production. APEDA data show that banana covered about 994 thousand hectares in India during 2022-23, with production of approximately 36.61 million tonnes. The major banana-producing states include Tamil Nadu, Gujarat, Andhra Pradesh, Uttar Pradesh and Maharashtra. Important commercial varieties grown in India include Dwarf Cavendish, Robusta, Rasthali and Poovan. Maharashtra is an important banana-producing state, with major producing districts including Jalgaon, Nanded, Solapur, Akola and Pune. The importance of banana production in Maharashtra also creates a need for efficient marketing arrangements that can connect producing areas with wholesale and consuming markets. Although Nagpur is not identified among the major banana-producing districts listed by APEDA, the city has an important position as a wholesale trading centre. Banana entering the wholesale market may originate from different producing regions and may subsequently be supplied to different consumption centres. Therefore, analysis of banana arrivals and prices at Nagpur can provide useful information about the marketing behaviour of the commodity rather than only its production within Nagpur district. Agricultural Produce Market Committees provide an organised platform for the sale and purchase of agricultural commodities. Their activities include bringing produce to the market, weighing, auctioning and facilitating trade. Such facilities are especially relevant for perishable commodities because delays during handling, transportation or sale can affect product quality and market returns. APMC Kalamna, Nagpur is a major regulated agricultural market. The Nagpur Agricultural Produce Market Committee was notified on 16 November 1974 and began functioning on 21 January 1975. The market later developed into the Kalamna market yard, where different commodity markets were brought together. The Orange and Fruit Market is one of its sub-market yards, and banana is included among the notified commodities traded through the market. The market uses open auction as a method of sale. Market infrastructure is an important part of agricultural marketing. APMC Kalamna provides facilities such as auction halls, warehouses, roads, weighing facilities, shops and cold-storage units. The Fruit Market has five auction halls covering approximately 8,744 square metres. The market also has warehouse facilities and four cold-storage units. Such infrastructure helps in the handling, temporary storage and movement of agricultural and horticultural commodities. Transportation has particular importance in banana marketing because the fruit is easily affected by improper handling and delays. Timely movement from producing areas to the wholesale market and from the wholesale market to consuming centres can help maintain quality and reduce losses. Efficient market infrastructure and transport arrangements can therefore contribute to smoother movement of banana through the marketing chain. Storage is another component of the marketing system. Unlike non-perishable commodities, banana has a limited shelf life and requires suitable post-harvest handling. APMC Kalamna has warehouse and cold-storage facilities that support market operations and temporary holding of agricultural produce. The available facilities include warehouses of 1,000 MT, 1,000 MT and 3,300 MT capacity, along with four cold-storage units. Market arrivals and prices are important indicators of commodity market behaviour. Arrivals may change because of harvesting patterns, production conditions, weather, transportation and the quantity supplied from different producing areas. Prices may be influenced by supply and demand, product quality, seasonal conditions and other market factors. Studying the growth and instability of arrivals and prices helps in understanding the extent of market variation, while trend analysis provides information about their movement over time. In this context, the present study was undertaken to examine the growth, instability and trend of banana arrivals and prices at APMC Kalamna, Nagpur during 2015-2025. The findings are expected to improve understanding of the behaviour of banana in the wholesale market and provide useful information for farmers, traders and market authorities.
Objectives of the study
The study was undertaken with the following objectives 1. To estimate the growth rate and instability in banana arrivals and prices in APMC Kalamna, Nagpur. 2. To analyse the trend in banana arrivals and prices in APMC Kalamna, Nagpur.
Materials and Methods
Materials and Methods
Selection of market
APMC Kalamna, Nagpur, Maharashtra was selected for the study. The market is an important regulated agricultural market where a wide range of agricultural and horticultural commodities are traded. Banana was selected as the commodity for the present analysis.
Selection of commodity
Banana was selected because it is an important fruit commodity traded at APMC Kalamna. The study specifically examined the behaviour of banana market arrivals and prices during the selected study period.
Period of study
The study covered 11 years, from 2015 to 2025. Monthly time-series data on banana arrivals and prices were considered for the analysis. The data were organised according to the requirements of the statistical methods used in the study.
Source of data
The study was based on secondary data. Monthly information on banana arrivals and prices for the period 2015-2025 was collected from APMC Kalamna, Nagpur records and the AGMARKNET portal. The collected information was compiled and analysed in accordance with the objectives of the study.
Analytical tools and techniques
Statistical techniques were used to examine the growth, variation, instability and trend of banana arrivals and prices.
The main analytical methods used were Compound Growth Rate, Coefficient of Variation, Cuddy-Della Valle Instability Index and trend analysis.
Compound Growth Rate (CGR)
Compound Growth Rate was used to measure the rate of change in banana arrivals and prices over the study period. It indicates the average rate at which a variable changed over time on a compound basis.
The CGR was estimated using the following formula: CGR = [Antilog (b) -1] × 100 A positive CGR indicates an increase over the study period, while a negative CGR indicates a decline.
Coefficient of Variation (CV)
The Coefficient of Variation was used to measure the degree of variation in banana arrivals and prices. It also provides a basis for comparing the relative variation between the two variables.
Where, CV = Coefficient of Variation (per cent)
A high CV indicates greater variation, while a lower CV indicates comparatively lower variation.
Cuddy-Della Valle Instability Index (CDVI)
The Cuddy-Della Valle Instability Index was used to measure instability after considering the effect of the longterm trend in the series.
CDVI = Cuddy-Della Valle Instability Index CV = Coefficient of Variation R² = Coefficient of determination obtained from the trend equation.
A high CDVI indicates greater instability, whereas a lower value indicates greater stability in the series.
Trend analysis
Trend analysis was carried out to study the direction and pattern of banana arrivals and prices during the study period. Different functional forms were fitted to the data. The coefficient of determination (R²) was used as the main basis for comparing the fitted models. The model with the highest R² value was considered the best-fitting model among those examined. The results presented in Table 2 show that banana arrivals recorded a compound growth rate of 0.004 per cent during 2015-2025. Although the growth rate was positive and statistically significant, its magnitude was very small. This indicates that the overall increase in banana arrivals during the study period was limited. The coefficient of variation for banana arrivals was 81.17 per cent, which indicates a high degree of variation. Thus, the quantity of banana entering the market differed considerably over the study period.
Results and Discussion
Results and Discussion
Growth rate and instability in banana arrivals and prices
The CDVI for banana arrivals was 35.79 per cent. This indicates considerable instability in arrivals even after accounting for the underlying trend. The combination of a very low growth rate and high instability suggests that banana arrivals did not follow a consistent pattern during the study period. Banana prices indicated a compound growth rate of 0.18 per cent, which was positive and statistically significant. The growth rate was higher than that recorded for arrivals, although it remained relatively small. The coefficient of variation for banana prices was only 3.15 per cent, showing that prices varied much less than arrivals.
Similarly, the CDVI of 3.15 per cent indicates a low level of instability in prices.
Overall, the results show a clear difference between the behaviour of arrivals and prices. Banana arrivals experienced substantial variation and instability, whereas prices remained comparatively stable. This indicates that fluctuations in market arrivals were not accompanied by equally large changes in prices during the study period. For the Cubic model, the estimated constant was 52633, while the coefficients of b₁, b₂ and b₃ were 1046.1, -1735.6 and 114.69, respectively. The combination of positive and negative coefficients indicates that the movement of arrivals was not uniform throughout the study period. The higher R² value of the Cubic model suggests that changes in banana arrivals were better represented by a cubic relationship than by the other functional forms tested. The result also reflects the irregular nature of banana arrivals over the study period. Therefore, the Cubic model was selected as the best-fitting model for banana arrivals, based on its highest R² value of 0.84. The Quadratic model had an R² value of 0.11, with coefficients of 6.73 and -0.46. The Cubic model also recorded an R² value of 0.11, with coefficients of 6.46, -0.41 and -0.003. Although these models provided slightly better fits than some of the simpler models, their overall explanatory power remained low. Thus, the Inverse model was selected as the best-fitting model for banana prices because it recorded the highest R² value of 0.13. However, the low R² indicates that the trend in banana prices was not adequately explained by the tested functional forms. This suggests that factors other than the simple time trend may have influenced price behaviour during the study period.
Trends in banana arrivals and prices
Trends in banana arrivals and prices
Conclusion
The study examined the growth, instability and trend of banana arrivals and prices at APMC Kalamna, Nagpur during 2015-2025. The findings show that banana arrivals and prices behaved differently during the study period. Banana arrivals recorded a very small positive growth rate of 0.004 per cent. At the same time, arrivals indicated a high coefficient of variation of 81.17 per cent and an instability index of 35.79 per cent. These results indicate that banana arrivals fluctuated considerably over time despite showing only limited overall growth. Banana prices recorded a positive growth rate of 0.18 per cent. In contrast to arrivals, the coefficient of variation and instability index for prices were both 3.15 per cent, indicating comparatively low variation and instability. Trend analysis further confirmed the different behaviour of the two variables. For banana arrivals, the Cubic model provided the best fit with an R² value of 0.84. This indicates that the movement of arrivals over time was better represented by the cubic functional form than by the other models tested.
For banana prices, the Inverse model recorded the highest R² value of 0.13. However, the low R² indicates that the model explained only a small part of the observed price variation. Therefore, the movement of banana prices cannot be adequately explained by time trend alone.
Overall, the study indicates that banana arrivals were considerably more variable and unstable than banana prices during the study period. The large difference between arrival variability and price variability suggests that changes in market arrivals were not directly reflected in similar changes in prices. The findings can be useful to farmers, traders and market authorities for understanding the behaviour of banana in the wholesale market and for improving marketing decisions.
Figures and tables from the paper
| S. No. | Model | Equation |
|---|---|---|
| 1 | Linear | |
| 2 | Logarithmic | |
| 3 | Exponential | |
| 4 | Power | |
| 5 | Quadratic | |
| 6 | Cubic | |
| 7 | Inverse | |
| 8 | Square Root |
Table text extracted from the original PDF; superscript letters are shown inline. The original table image is below.
View original table image
| — | — | Parameter | Estimated | — | — |
|---|---|---|---|---|---|
| Equation | R² | Constant (a) | b₁ | b₂ | b₃ |
| Linear | 0.79 | 56609 | -5353.5 | - | - |
| Logarithmic | 0.73 | 60993 | -22943 | - | - |
| Exponential | 0.76 | 85944 | -0.27 | - | - |
| Power | 0.44 | 95960 | -1.086 | - | - |
| Quadratic | 0.82 | 65157 | -9298.8 | 328.78 | - |
| Cubic | 0.84 | 52633 | 1046.1 | -1735.6 | 114.69 |
| Inverse | 0.47 | 10587.19 | 50635.47 | - | - |
| Square Root | 0.80 | 80408.66 | -23855.95 | - | - |
Table text extracted from the original PDF; superscript letters are shown inline. The original table image is below.
View original table image
| — | — | Parameter | Estimated | — | — |
|---|---|---|---|---|---|
| Equation | R² | Constant (a) | b₁ | b₂ | b₃ |
| Linear | 0.05 | 527.55 | 1.15 | - | - |
| Logarithmic | 0.09 | 523.55 | 6.87 | - | - |
| Exponential | 0.05 | 527.43 | 0.002 | - | - |
| Power | 0.09 | 523.46 | 0.01 | - | - |
| Quadratic | 0.11 | 515.44 | 6.73 | -0.46 | - |
| Cubic | 0.11 | 515.77 | 6.46 | -0.41 | -0.003 |
| Inverse | 0.13 | 540.67 | -22.62 | - | - |
| Square Root | 0.07 | 520.42 | 5.98 | - | - |
Table text extracted from the original PDF; superscript letters are shown inline. The original table image is below.
View original table image
References
8 in the original paper- Bhagat AA, Gondhali BV, Lad DB, Bansod RD. Price transmission in major banana markets of India. International Journal of Statistics and Applied Mathematics. 2023;8(6S):263-268.
- Nawadkar DS, Naik RB, Amale AJ. Trends in arrivals and prices of green gram in western Maharashtra. International Journal of Social Sciences Development and Agricultural Technology. 2015;10:2454-6003.
- Priya VSM, Jyothi SH, Kumar PG, Naidu GM. Diverging trends in banana prices and market arrivals: a case study of Ravulapalem Regulated Market, Andhra Pradesh. International Journal of Agriculture Extension and Social Development. 2025;8(10):391-394.
- Saha N, Kar A, Jha GK, Venkatesh P, Kumar P. Market arrival and price behaviour analysis of potato in four major markets in India. Economic Affairs. 2020;65:529533.
- Thakur N, Shilpa, Sharma A, Kumari S, Sharma R. Dynamics of prices and arrivals of major vegetables: a case of North Indian markets. Agro Economist -An International Journal. 2022;9(1):31-42.
- Neerugatti MP, Chavan RV, Bharati SV. Trends and seasonality in arrivals and prices of soybean in APMC, Parbhani. Environment and Ecology. 2023;41(4C):28272831.
- Jagannath J, Jagrati D, Wali VB, Vinodakumar SN. Growth and instability in agriculture: Western Vidarbha of Maharashtra, India. Trends in Biosciences. 2014;7(4):267-270.
- Patil SD, Tingre AS, Bagde NT, Warade S. Dynamics of arrivals and prices of apple and banana in APMC Nagpur. International Journal of Agriculture and Food Science. 2025;7(8):1103-1108.