
Research article · 2026 · Full text
International Journal of Advanced Chemistry ResearchDetermination of cobalt and chromium by Atomic Absorption Spectrometry (AAS) and comparison with Inductively Coupled Plasma Optical Emission Spectrometry (ICP OES)
Volume 8(8) · Pages 28–33 · DOI: 10.33545/26646781.2026.v8.i8a.729 ↗
Research areasAnalytical chemistry methods developmentLaser-induced spectroscopy and plasmaEnvironmental and Analytical Chemistry Studies
Abstract
Author-writtenIdentifying individual elements can be done using different atomic spectroscopic (AS) methods. These methods vary mainly based on their sensitivity, selectivity, speed in processing samples, and cost. The reliability of these methods is checked during validation, and parameters like precision, accuracy, and detection limits are among the most commonly assessed. The book uses trace element techniques to measure the purity of reagent chemicals, including atomic absorption spectroscopy (AAS) and inductively coupled plasma–optical emission spectroscopy (ICP–OES). It's important to note that many labs now use inductively coupled plasma–mass spectrometry for detecting very small amounts of metals. The proposed method is recommended for the preconcentration and determination of cobalt (II) at minor and trace levels, and it's also used for analyzing real samples like industrial effluent.
Summary
Source-checkedPlain-language reading of the full paper, prepared with AI and checked against the text. Each point links to the authors' own words.
Why it matters
- Cobalt is a critical micronutrient for mammals and other life forms because it activates various enzymes. View evidence ↗
- Due to its strength and corrosion resistance, cobalt is widely used in industrial applications such as high-temperature alloys, magnets, and tool steels. View evidence ↗
- The biological and industrial importance of cobalt has increased the necessity for accurate measurement methods. View evidence ↗
The question
- The study aims to develop and recommend a method for the preconcentration and determination of cobalt (II) at trace levels, including in industrial effluents. View evidence ↗
What they did
- Methyl isobutyl ketone (MIBK) was selected as the effective solvent for extracting the cobalt (II)-potassium benzyl xanthate (KBX) complex. View evidence ↗
- The effect of pH was tested using 60µg of cobalt (II) in 100 ml of water with 2.0 ml of 0.5% KBX, varying the pH from 2.0 to 9.0. View evidence ↗
- The recommended procedure involves adjusting a 100 ml sample to pH 4.0, adding 5.0 ml of 0.5% KBX, and shaking with 10.0 ml of MIBK for 3 minutes. View evidence ↗
What they found
- The optimum pH for cobalt (II) extraction was found to be 4.0, where the maximum absorbance of 0.459 was recorded. View evidence ↗
- A reagent concentration of 2.0 ml of 0.5% KBX was determined to be sufficient for maximum extraction, yielding an absorbance of 0.584. View evidence ↗
- The method tolerates various cations, including Cd(II), Se(IV), and Bi(III) up to 3000µg, and Ni(II) up to 2000µg, without interference. View evidence ↗
- Severe interference from Fe(III) and Pb(II) can be suppressed by adding 1.0 ml of 0.3% citrate solution. View evidence ↗
- The method is applicable for spiked water samples, achieving a recovery rate of up to 99.5%. View evidence ↗
- Analysis of industrial effluents showed cobalt (II) concentrations between 0.396 ppm and 1.683 ppm, with results in good agreement with the ICP OES method. View evidence ↗
What it means
- The authors recommend this AAS-based method for the preconcentration and determination of cobalt (II) at trace levels in real samples and industrial effluents. View evidence ↗
Visual summary
3 visualsIllustrations explain the paper; charts are replotted from the paper's own table values.
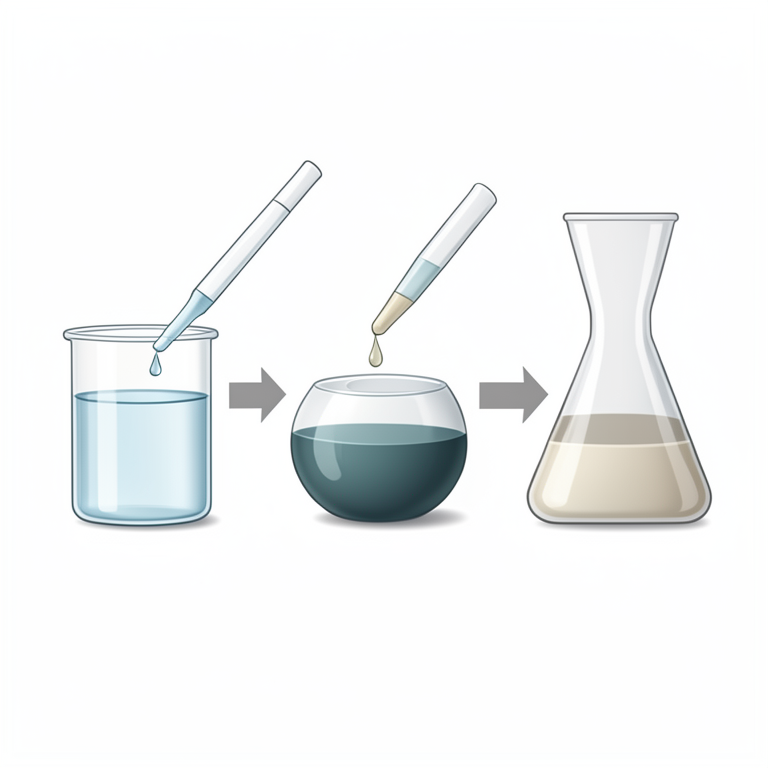
Cobalt Extraction Process Flow
AI-generated conceptual illustration (water sample in laboratory glassware). It explains the idea and does not show study data.
View source evidence ↗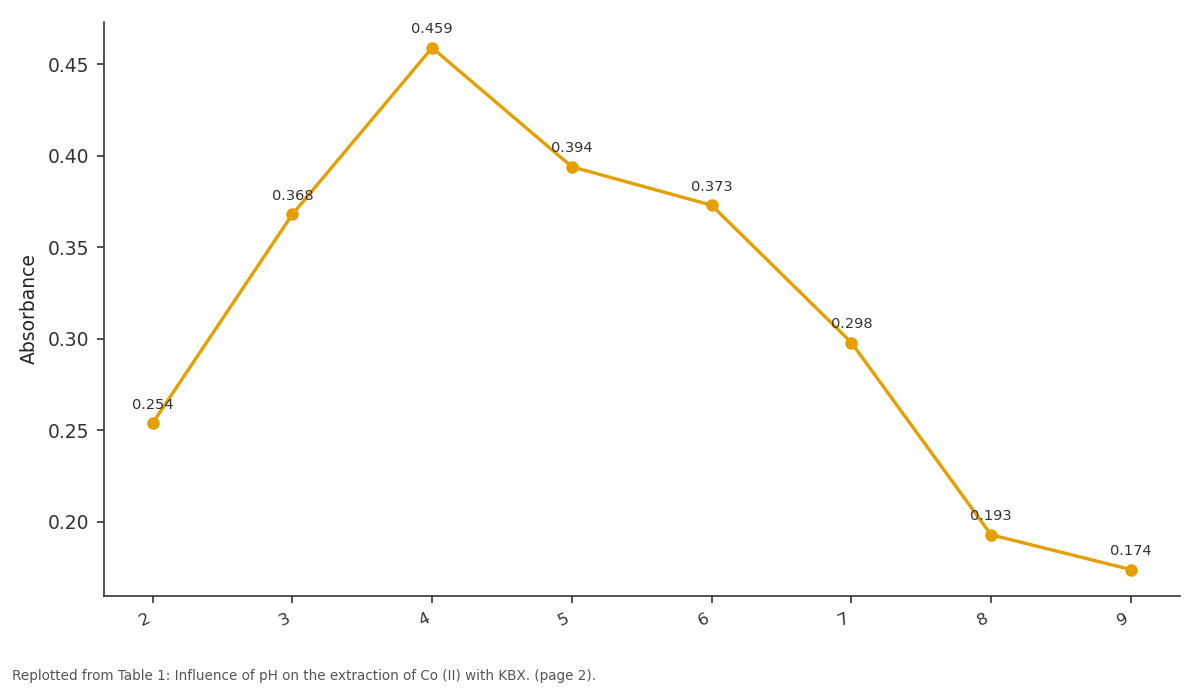
Absorbance / Co: 2 vs 3 vs 4 vs 5 vs 6
Replotted from Table 1 (page 2) of the original paper. Every bar is the paper's own table value.
View source evidence ↗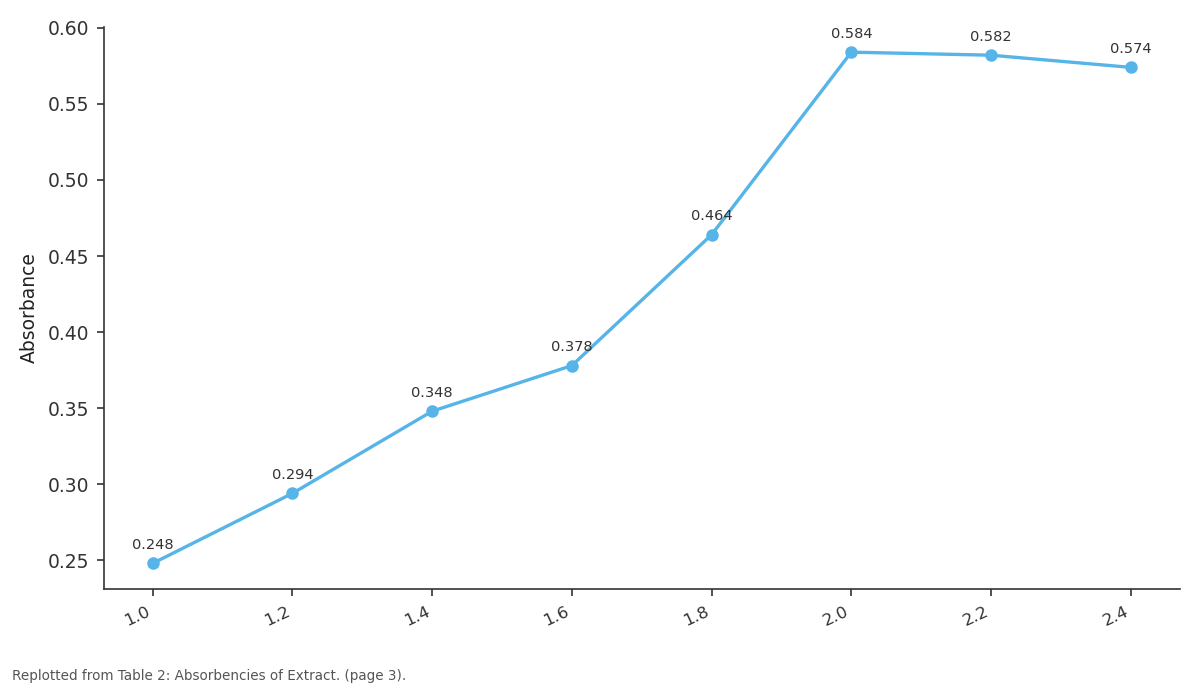
Absorbance / Co: 1.0 vs 1.2 vs 1.4 vs 1.6 vs 1.8
Replotted from Table 2 (page 3) of the original paper. Every bar is the paper's own table value.
View source evidence ↗Figures & tables
From the original paper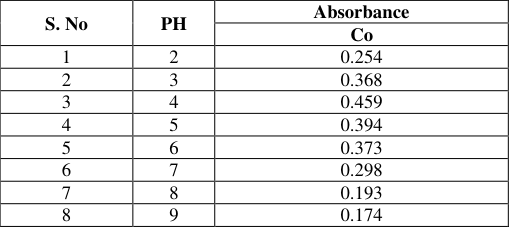 Table 1
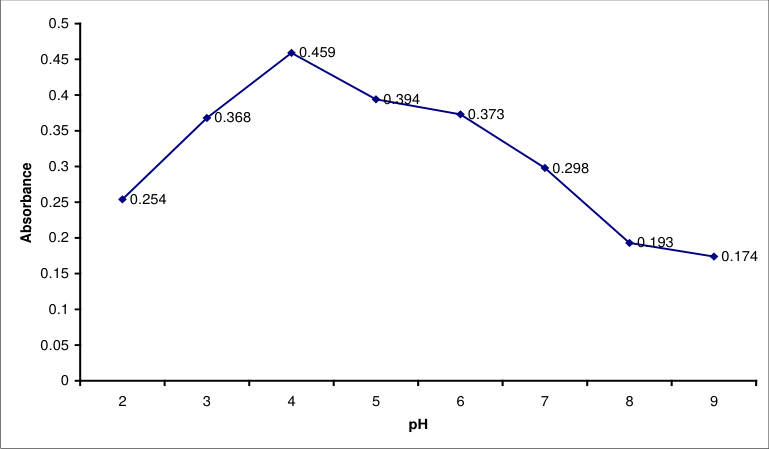 Figure 1
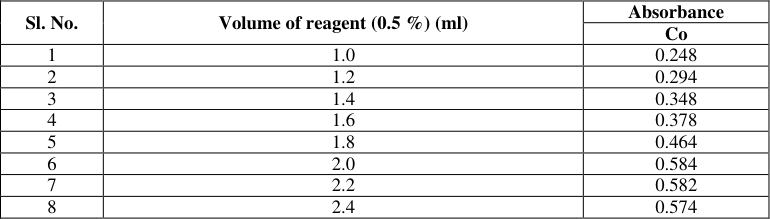 Table 2
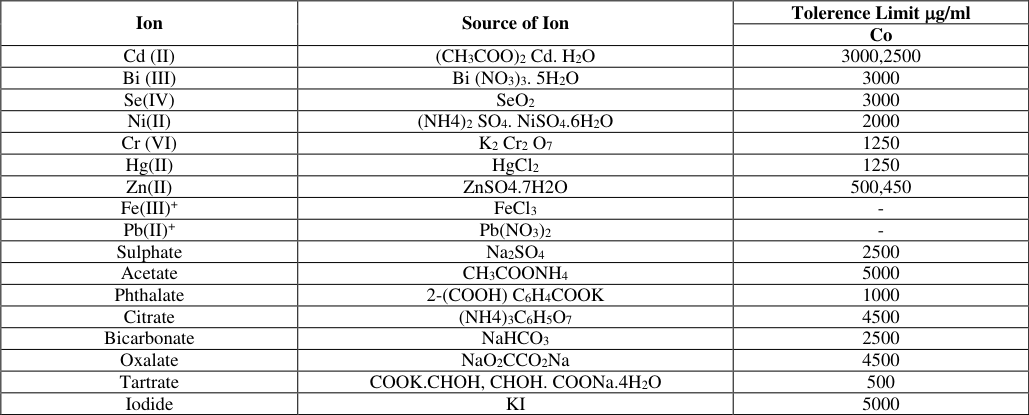 Table 3
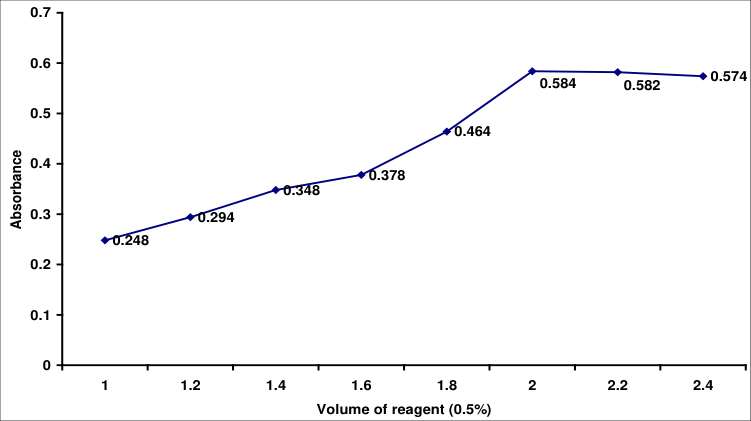 Figure 2
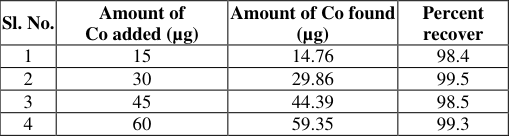 Table 5
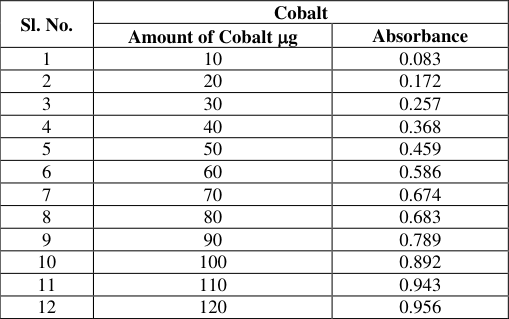 Table 4
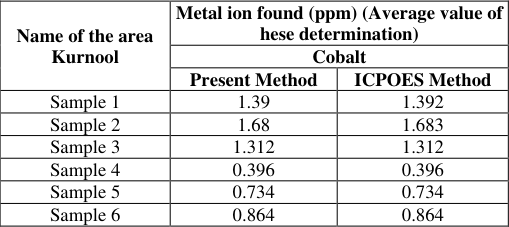 Table 6
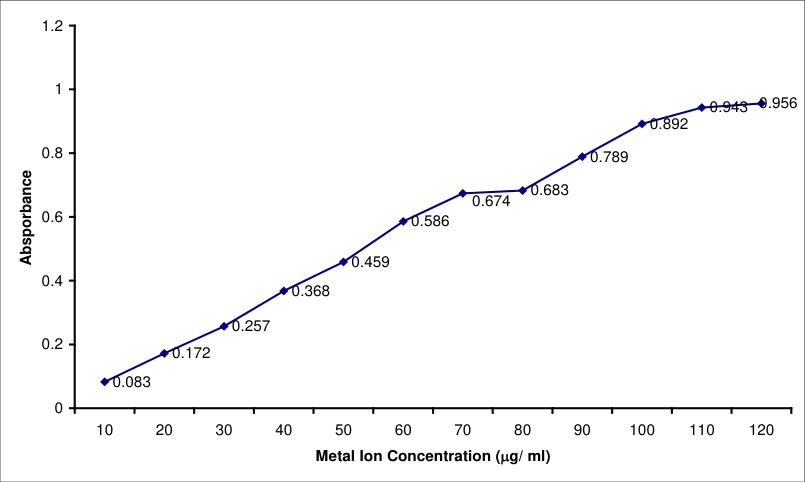 Fig. 3
 Table 7
Introduction
Cobalt is a very important micronutrient for living organisms. It is essential for many life forms, including mammals, where it helps activate several enzymes. Cobalt is also key in the process of nitrogen fixation in plants by bacteria and is a vital component of the B-vitamin complex, specifically vitamin B12. Plants and various food sources have very low levels of cobalt. A lack of cobalt can lead to slow growth, loss of appetite, and pernicious anemia in humans. Just 3 micrograms per day can help prevent pernicious anemia. In animals, cobalt deficiency can cause several health issues. Too much cobalt can irritate the stomach and intestines, leading to nausea, diarrhea, and other problems. High levels of cobalt can significantly block the production of heme and stop enzyme functions. However, cobalt is harmful when ingested directly. Besides its role in the body, cobalt has many uses in industry. Because of its strength and ability to resist corrosion in different environments, it is commonly used in high-speed tool steels, magnets, and high-temperature alloys. The metal is used in making aircraft, electromagnets, paints, and ceramics. Cobalt is also used as a catalyst in various industrial processes. The need to measure cobalt has increased because of its importance in both essential biological processes and industrial applications, as discussed earlier.
A detailed review of the literature shows that many different chemicals have been used to concentrate and measure cobalt (II) using atomic absorption spectroscopy. Various substances such as 2-nitroso-1-napthol (1), Poly (ethylene mine) and its thiourea derivatives (2), thiocyanate (3), meso-tetra (P-sulphonato) prophine (4), 2-acetic pyridine benzoyl hydrazone (5), 2-(5-bromo-2-pyridylazo) 5 diethyl amino phenol (6), dithiocarbamate (7), natural waters (8), 8-hydroxy quinolene (9), dithizone in ethyl propionate (10), 1,10phenanthroline (11), 1-nitroso-2-napthol-3,6-disulfonic acid (12), nitroso-R salt (13), 2-(5bromo-2-pyridylazo-5-diethylaminophenol (14) have been used as reagents to extract cobalt (II) with atomic absorption spectrometry.
In addition, several more atomic absorption spectrometric and extractive atomic absorption spectrometric methods have been developed to measure cobalt. A first study of the reaction between cobalt (II) and potassium benzyl xanthate (KBX) in a neutral solution showed that the solution becomes cloudy and the precipitate becomes more visible when the pH is lowered to 7.0. To understand the nature of this precipitate, an attempt was made to dissolve it into an organic phase using several solvents like n-butanol, benzene, methyl isobutyl ketone, namyl alcohol, isoamyl alcohol, carbon tetrachloride, chloroform, chlorobenzene, cyclohexane, nitrobenzene, and propyl acetate to study the extraction of the Co (II)-KBX complex. Among the solvents tested, methyl isobutyl ketone was found to extract the complex effectively. The organic phase, which is the solution of the precipitate in MIBK, is separated from the aqueous phase and then analyzed for cobalt (II) using atomic absorption spectrometry.
Results and Discussion
Various parameters such as pH, reagent concentration, shaking time, sample volume, metal ion concentration and the effect of foreign ones which influence quantitative recovery of cobalt (II) were studied.
Effect of pH on the extraction of cobalt (II) KBX
The extraction behaviour of Co (II)-KBX complex was studied over a wide range of p H values. The pH studies were carried out varying the pH from 2.0. to 9.0.In each case, a mixture containing 60µg of cobalt (II) in 100 ml of double distilled water, 2.0 ml of 0.5 per cent KBX solution was maintained constant and varying the p H values of the aqueous phase from 2.0 to 9.0 using suitable buffer solutions. The solution was shaken with 10.0 ml of methyl isobutyl ketone (MIBK) for 3.0 minutes. The organic phase was collected and the optical densities of the organic extracts were measured. The values are reported in the Table 1. From Fig. 1, it is observed that the extraction of cobalt (II) commenced at p H 2.0, reached a maximum at p H 4.0 and decreased beyond p H 4.0. Hence the optimum pH of 4.0 is recommended.
| S. No | PH | Absorbance |
|---|---|---|
| Co | ||
| 1 | 2 | 0.254 |
| 2 | 3 | 0.368 |
| 3 | 4 | 0.459 |
| 4 | 5 | 0.394 |
| 5 | 6 | 0.373 |
| 6 | 7 | 0.298 |
| 7 | 8 | 0.193 |
| 8 | 9 | 0.174 |
Table text extracted from the original PDF; superscript letters are shown inline. The original table image is below.
View original table image
Effect of sample volume on the extraction of cobalt with KBX
The extraction of cobalt (II) was studied using different volumes of the water sample from 100-300 ml. The study revealed that extraction was quantitative from 100-200 ml of the water sample. Hence, 100 ml of water was employed in the course of this study.
Effect of shaking time on the extraction of cobalt (II) with KBX
The effect of shaking time on the extraction of cobalt (II) was studied. The extraction remains constant for shaking time beyond two minutes. Hence, three minutes shaking time was employed in the course of this study.
Effect of reagent concentration on the extraction of cobalt (II) with KBX
The effect of reagent concentration has been studied by using different solutions containing 60µg of cobalt (II) in 100 ml double distilled water and the pH was adjusted to 4.0 with acetic acid -sodium acetate solution. To this solution1.0 to 2.4 ml of 0.5 per cent KBX was added. The metal complexes were extracted individually into 10.0 ml portions of MIBK. The absorbencies of these extract were measured. The values are given in Table No.2 and Fig. 2. The above data reveals that 2.0 ml of 0.5 of the reagent (KBX) was sufficient for maximum extraction of co (II). Hence, this concentration was used for all further studies.
Effect of foreign ions on the extraction of cobalt (II) with KBX
A known amounts of various cations and anions were added to fixed amounts of cobalt (II) (60 µg each) in order to study the effect of interference of such ions on the extraction and determination of cobalt (II) using the proposed procedure. The criterion for interference is an absorbance varying more than ± 2 percent from the expected value for Co (II) alone. The results are presented in Table 3. During the determination of cobalt (II) with potassium benzyl xanthate by atomic absorption spectrometry, cations like Cd(II), Se (IV) and Bi (III) do not interfere up to 3000µg, Ni (II) can be tolerated up to 2000µg Chromium (VI) and Hg (II) do not have any effect up to 1250 µg whereas Zn (II) can be tolerated up to 500µg. The Fe (III) and Pb (II) interfere severely in the present investigation. The interference due to Fe (III) and Pb (II) can be suppressed using 1.0 ml of 0.3% citrate solution. Anions like acetate, iodide up to 500 µg, citrate and oxalate up to 4500 µg, sulphate, bicarbonate up to 2500 µg, phthalate up to 1000 µg and tartrate up to 500 µg do not interfere in the determination.
| Ion | Source of Ion | Tolerence Limit µg/ml |
|---|---|---|
| Co | ||
| Cd (II) | (CH3COO)2 Cd. H2O | 3000,2500 |
| Bi (III) | Bi (NO3)3. 5H2O | 3000 |
| Se(IV) | SeO2 | 3000 |
| Ni(II) | (NH4)2 SO4. NiSO4.6H2O | 2000 |
| Cr (VI) | K2 Cr2 O7 | 1250 |
| Hg(II) | HgCl2 | 1250 |
| Zn(II) | ZnSO4.7H2O | 500,450 |
| Fe(III)+ | FeCl3 | - |
| Pb(II)+ | Pb(NO3)2 | - |
| Sulphate | Na2SO4 | 2500 |
| Acetate | CH3COONH4 | 5000 |
| Phthalate | 2-(COOH) C6H4COOK | 1000 |
| Citrate | (NH4)3C6H5O7 | 4500 |
| Bicarbonate | NaHCO3 | 2500 |
| Oxalate | NaO2CCO2Na | 4500 |
| Tartrate | COOK.CHOH, CHOH. COONa.4H2O | 500 |
| Iodide | KI | 5000 |
Table text extracted from the original PDF; superscript letters are shown inline. The original table image is below.
View original table image
Absorbance
Fig. 3 Effect of metal ion concentration on the extraction of Co (II) with KBX
Effect of metal ion concentration on the extraction of cobalt (II) with KBX
Based on the optimum conditions described above, a calibration curve was constructed. To the 100 ml of water sample, metal ion solution containing 10-120µg of cobalt (II) was added, and the analysis was carried out using the general procedure. The data is presented in Table 3 and the corresponding graph is shown in the Table 4 and Fig. 1. The sensitivity was found to be 9.4196ng/ml for cobalt (II). The calibration plot discloses linearity in the concentration range 1.0 to10.0 µg of cobalt (II) aliquots 8.0 µg/ml of cobalt (II) gave a standard deviation of 0.8426 x10 -3 while the coefficient of variation is 0.3286 per cent.
| Sl. No. | Cobalt | — |
|---|---|---|
| Amount of Cobalt µg | Absorbance | |
| 1 | 10 | 0.083 |
| 2 | 20 | 0.172 |
| 3 | 30 | 0.257 |
| 4 | 40 | 0.368 |
| 5 | 50 | 0.459 |
| 6 | 60 | 0.586 |
| 7 | 70 | 0.674 |
| 8 | 80 | 0.683 |
| 9 | 90 | 0.789 |
| 10 | 100 | 0.892 |
| 11 | 110 | 0.943 |
| 12 | 120 | 0.956 |
Table text extracted from the original PDF; superscript letters are shown inline. The original table image is below.
View original table image
Application of the developed method
The developed atomic absorption spectrometry methods for cobalt (II) was applied for determination industrial effluents 2.8 Analysis of spiked water samples for the determination of cobalt (II) using the proposed new method The recovery of cobalt (II) from spiked water samples was examine using the general and recommended procedure. The results are given in table 5. The results show that the developed method is applicable to analyses the spiked water samples with the percentage recovery being 99.5% this method was applicable for the analysis of real samples like fruit samples, industrial effluents samples.
| Sl. No. | Amount of Co added (µg) | Amount of Co found (µg) | Percent recover |
|---|---|---|---|
| 1 | 15 | 14.76 | 98.4 |
| 2 | 30 | 29.86 | 99.5 |
| 3 | 45 | 44.39 | 98.5 |
| 4 | 60 | 59.35 | 99.3 |
Table text extracted from the original PDF; superscript letters are shown inline. The original table image is below.
View original table image
Analysis of Industrial Effluents for the determination of cobalt (II)
The proposed method was applied for the determination of cobalt (II) in industrial effluents. Industrial effluents were collected in different industrial areas in Kurnool town (India). The analysis of was carried out according to the recommended procedure. The data is presented in Table 6. The results obtained by the present method are in good agreement with ICOPES. Of the six sample anlaysed all the samples contain cobalt (II) in the concentrations from 0.396 ppm to 1.683 ppm.
| Name of the area Kurnool | Metal ion found (ppm) (Average value of hese determination) | — |
|---|---|---|
| Cobalt | ||
| Present Method | ICPOES Method | |
| Sample 1 | 1.39 | 1.392 |
| Sample 2 | 1.68 | 1.683 |
| Sample 3 | 1.312 | 1.312 |
| Sample 4 | 0.396 | 0.396 |
| Sample 5 | 0.734 | 0.734 |
| Sample 6 | 0.864 | 0.864 |
Table text extracted from the original PDF; superscript letters are shown inline. The original table image is below.
View original table image
General and recommended procedure
To the 100 ml of water sample, an aliquot of standard metal ion solution containing 10-120 μg of cobalt (11) was added the pH was adjusted to 4.0 with acetic acid -sodium acetate buffer solution. The solution was transferred into a separator funnel. To this, 5.0 ml of 0.5 percent potassium benzyl xanthate (KBX) was added and the mixture was shaken vigorously for 3 minutes with 10.0 ml of methyl isobutyl ketone (MIBK). The two phases were allowed to separate, the organic layer was collected and analysed for cobalt (II) by atomic absorption spectrometry. The metal content was estimated at the conditions mentioned in Table 7.
Conclusions
The results from the validation process show that this method is effective. The method was tested throughout every stage of the analytical process. This is the first time this adsorbent has been used to extract heavy metal ions. Flame atomic absorption spectrometry was used to measure the levels of the elements being studied. A detailed study was conducted to find the best conditions for the extraction process. Adsorption isotherms were created to determine how much metal can be adsorbed. This method has several advantages, including being simple, fast, and cost-effective, along with being sensitive. Several other elements do not interfere with the analysis. The selectivity of the reagent is improved by using suitable masking agents, which help reduce interference from ions like Fe (II), Fe (III), and Pb (II). Therefore, this method is recommended for the preconcentration and determination of cobalt (II) using AAS, especially at minor and trace levels, and it can also be used for analyzing real samples or industrial effluents.
Acknowledgement
AcknowledgementThe authors thank Sri Venkateswara University, Tirupati, for technical support during this study.
Figures and tables from the paper
| Sl. No. | Volume of reagent (0.5 %) (ml) | Absorbance |
|---|---|---|
| Co | ||
| 1 | 1.0 | 0.248 |
| 2 | 1.2 | 0.294 |
| 3 | 1.4 | 0.348 |
| 4 | 1.6 | 0.378 |
| 5 | 1.8 | 0.464 |
| 6 | 2.0 | 0.584 |
| 7 | 2.2 | 0.582 |
| 8 | 2.4 | 0.574 |
Table text extracted from the original PDF; superscript letters are shown inline. The original table image is below.
View original table image
References
41 in the original paper- Motojima K, Tetenuma K, Uchino K, Yonetai A. Analytical Sciences. 1988;4(3):287.
- Shkinev VM, Gomolitskii VN, Spivakov BYa, Geckeler KE, Bayer E. Talanta. 1989;36(8):861.
- Shimizu T, Koyanagi H, Shijo V, Saki K. Chemical Letters. 1986;3:319.
- Corsini A, Di Fruscia R, Harrmann O. Talanta. 1985;32(8B):791.
- Gareia V, Hernandez AM, Perez BJA. Analytica Chimica Acta. 1984;157(2):363.
- Satake M, Nagahiro T, Pura BK. Analyst. 1993;118(1):85.
- Danielsson LG, Magnusson B, Westerlund S, Zhang K. Analytica Chimica Acta. 1982;144:183.
- Ryabinin AI, Lammreva EA. Zhurnal Analiticheskoi Khimii. 1979;33(2):298.
- Gulp JH, Windham RL, Whealy RD. Analytical Chemistry. 1971;43(10):1321.
- Sachdev SL, West PW. Analytica Chimica Acta. 1969;44(2):301.
- Ali A, Yin X, Shin H, Ye M, Gu X. Analytica Chimica Acta. 1999;392(2):283.
- Kenderzder E, Turker AR. Analytica Chimica Acta. 2003;480(2):259.
- Taher MA. Asian Journal of Chemistry. 2003;15(34):1266.
- Mohammad Ali T, Ali M, Taherch R. Asian Journal of Chemistry. 2003;15(3-4):1331.
- Ueda K, Kubo K, Yoshimura O, Yamamoto Y. Bulletin of the Chemical Society of Japan. 1988;61(8):279.
- Nakashima S, Sturgeon PE, Willie SN, Berman SS. Analytica Chimica Acta. 1988;207(1-2):291.
- Kumamaru T, Okamoto Y, Kara S, Matsuo H, Kiboku M. Analytica Chimica Acta. 1989;218(1):173.
- Lachowicz E, Kaliszuk A. Analytical Chemistry. 1986;323(1):54.
- Nebot J, Figuerola E. International Journal of Environmental Analytical Chemistry. 1989;36(4):241. 21. De la Guardia M, Vital MT. Talanta. 1984;31(10A):799.
- At Suya I, Aryu K, Zhang Q. Analytical Sciences. 1992;8(3):433.
- Liu ZS, Huang SD. Analytica Chimica Acta. 1992;267(1):31.
- Borggaard OK, Christensen HEM, Nielson TK, Willems SM. Analyst. 1982;107(1281):1479.
- Darnemann A, Kleist H. Zeitschrift für Analytische Chemie. 1978;291(5):349.
- Sturgeon RE, Berman SS, Dasaulniers A, Rusdl DS. Talanta. 1980;22(2):85.
- Frigge C, Jackwerten E. Analytica Chimica Acta. 1993;271(2):299.
- Elci L, Sahin U, Ulgen A. Trace Elements and Electrolytes. 1998;15(2):106.
- Abdellatef HE, Ayad MM, Taha EA. Journal of Pharmaceutical and Biomedical Analysis. 1999;18(6):1021.
- Gucler K, Hugul M, Demirci Cekic S, Resat A. Talanta. 2000;53(1):213.
- Miller K, Mayer E, Haritz E, Wieteska E, Zioek A, Dizewinska A. Analytica Chimica Acta. 1996;330(2):251.
- Edel H, Quick L, Cammann K. Analytica Chimica Acta. 1995;310(1):181.
- Lazak A, Soltyk K, Ostapczuk P, Fijalek Z. The Science of the Total Environment. 2002;289(1):33.
- Anzano JM, Gonzalez P. Microchimica Journal. 2000;64(2):141.
- Satake M, Kano G, Puri BK, Usami S. Analytica Chimica Acta. 1987;199:209.
- Kumamaru T, Okamoto Y, Yamamoto M, Obata Y, Onizuku K. Analytica Chimica Acta. 1990;232(2):389.
- Capeool JL, Filgueiras AV, Lavilla L, Bendicho C. Talanta. 1999;50(4):905.
- Edel H, Quick L, Cammann K. Analytica Chimica Acta. 1995;310(1):181.
- Komarek J, Stavinoha P, Gomiscek S, Somnier L. Talanta. 1996;43(8):1321.
- Pena YPD, Lopez W, Burguera JL, Burguera M, Gallignani M, Brunette R, et al. Analytica Chimica Acta. 2000;403(1-2):249.
- Mandi CM, Mesaric S. Zeitschrift für Analytische Chemie. 1982;313(5):403.
- Vidal Gandia MT, De la Guardia CM. Analysis. 1983;13(5):233.
- Bhattacharya S, Das AK. Journal of the Indian Chemical Society. 1988;65(1):71.