
Research article · 2026 · Full text
International Journal of Agriculture and NutritionConsumption pattern of millets in Amravati district of Maharashtra
Volume 8(8) · Pages 95–98 · DOI: 10.33545/26646064.2026.v8.i8b.738 ↗
Research areasAgricultural Economics and PracticesEconomics of Agriculture and Food MarketsNutrition, Health and Food Behavior
Abstract
Author-writtenMillets are nutritionally rich and climate-resilient cereal crops that have traditionally been an important component of the Indian diet. They are valued for their nutritional qualities, adaptability to diverse agro-climatic conditions and relatively lower water requirements. However, changing dietary preferences, urbanization and increasing dependence on rice and wheat have contributed to relatively low millet consumption. In this context, the present study was undertaken to examine the consumption pattern of millets and determine the factors influencing millet consumption among selected cultivators in Amravati district of Maharashtra. The study was based on primary data collected from 120 respondents selected from eight villages of two randomly selected tehsils of Amravati district for the year 2025. Simple tabular analysis, multiple linear regression and Garrett’s ranking technique were used for analysing the data. The findings revealed that average annual household consumption increased with farm size, from 2520.40 kg among small farm households to 3369.14 kg among large farm households. Non-food items constituted the major share of total household consumption, accounting for 75.64 per cent, whereas food items accounted for 24.36 per cent. Among the selected millets, jowar was consumed in substantially greater quantity than bajra across all farm-size groups. Overall, jowar accounted for 3.00 per cent of total household consumption, while bajra accounted for 0.67 per cent. Household expenditure also increased with farm size, and non-food items accounted for 56.46 per cent of total expenditure. Jowar expenditure was higher than bajra, accounting for 2.62 and 0.39 per cent of total household expenditure, respectively. The regression analysis showed that education was the only significant factor influencing millet consumption. Education had a negative and significant effect on both quantity-wise and expenditure-wise millet consumption, while age, family size and income were statistically non-significant. The R² values of 0.09 in both models indicated that the selected socio-economic variables explained a limited proportion of the variation in millet consumption. The Garrett ranking analysis identified habitual consumption of other cereals as the major constraint to millet consumption, followed by taste preferences and limited knowledge regarding millet culinary preparation. Health concerns and high price were other important constraints, whereas lack of availability was ranked as the least important constraint. Overall, the study indicated that millet consumption among the selected households remained relatively low, with jowar being more preferred than bajra. The findings highlighted the importance of addressing traditional cereal preferences, taste-related concerns and limited culinary knowledge to promote millet consumption. Nutrition awareness programmes, recipe demonstrations, consumer education and promotional activities focusing on the nutritional benefits and diverse uses of millets could contribute to increasing their consumption, improving dietary diversity and strengthening household nutritional well-being in Amravati district.
Summary
Source-checkedPlain-language reading of the full paper, prepared with AI and checked against the text. Each point links to the authors' own words.
Why it matters
- Millets are traditionally important in India because they are nutritionally rich and resilient to climate changes. View evidence ↗
- Millet consumption has declined due to urbanization, shifting dietary preferences, and a greater reliance on wheat and rice. View evidence ↗
The question
- The study aimed to analyze millet consumption patterns and the factors that influence this consumption among cultivators in the Amravati district of Maharashtra. View evidence ↗
What they did
- Researchers collected primary data for the year 2025 from 120 respondents across eight villages in two randomly selected tehsils of Amravati. View evidence ↗
- The data were analyzed using simple tabular analysis, multiple linear regression, and Garrett's ranking technique. View evidence ↗
What they found
- Average annual household consumption rose as farm size increased, ranging from 2520.40 kg for small farms to 3369.14 kg for large farms. View evidence ↗
- Non-food items made up the majority of total household consumption at 75.64%, while food items accounted for 24.36%. View evidence ↗
- Jowar was consumed more than bajra, representing 3.00% of total household consumption compared to 0.67% for bajra. View evidence ↗
- Annual household expenditure increased with farm size, from ₹1,09,928.52 for small farms to ₹1,33,907.63 for large farms. View evidence ↗
- Expenditure on jowar (2.62% of total household expenditure) was higher than that on bajra (0.39%). View evidence ↗
- Regression analysis identified education as the only significant factor affecting the quantity of millet consumed, showing a negative effect (coefficient of -3.90). View evidence ↗
- Education was also the only significant factor influencing expenditure on millets, with a negative coefficient of -114.49. View evidence ↗
- The primary barriers to millet consumption were the habit of eating rice and wheat (score 60.73), taste (56.47), and limited knowledge of how to prepare millets (52.46). View evidence ↗
- Health concerns and high prices were less significant constraints, while lack of availability was the least important factor. View evidence ↗
What it means
- The authors conclude that millet consumption can be increased through nutrition awareness, recipe promotion, and culinary demonstrations to improve acceptance. View evidence ↗
Visual summary
2 visualsIllustrations explain the paper; charts are replotted from the paper's own table values.
Hierarchy of Constraints to Millet Consumption
AI-generated conceptual illustration (Various millet grains (pearl millet, finger millet, foxtail millet) and common cereals (rice, wheat)). It explains the idea and does not show study data.
View source evidence ↗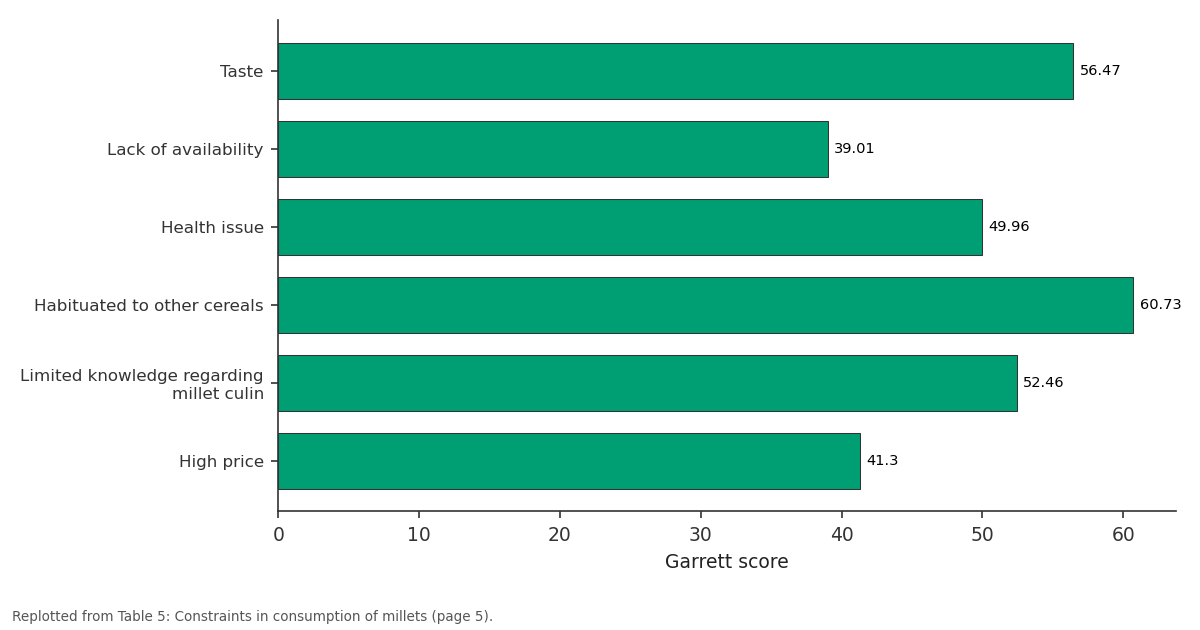
Garrett score: Taste vs Lack of availability vs Health issue vs Habituated to other... vs Limited knowledge...
Replotted from Table 5 (page 5) of the original paper. Every bar is the paper's own table value.
View source evidence ↗Figures & tables
From the original paper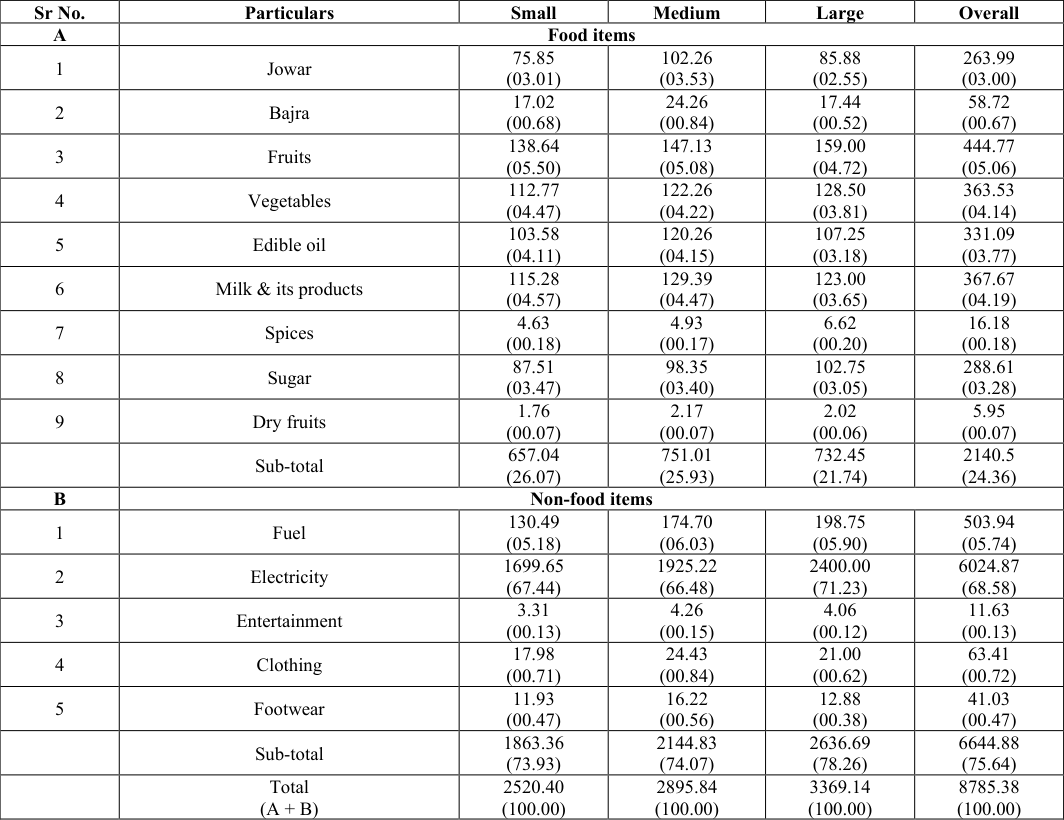 Table 1
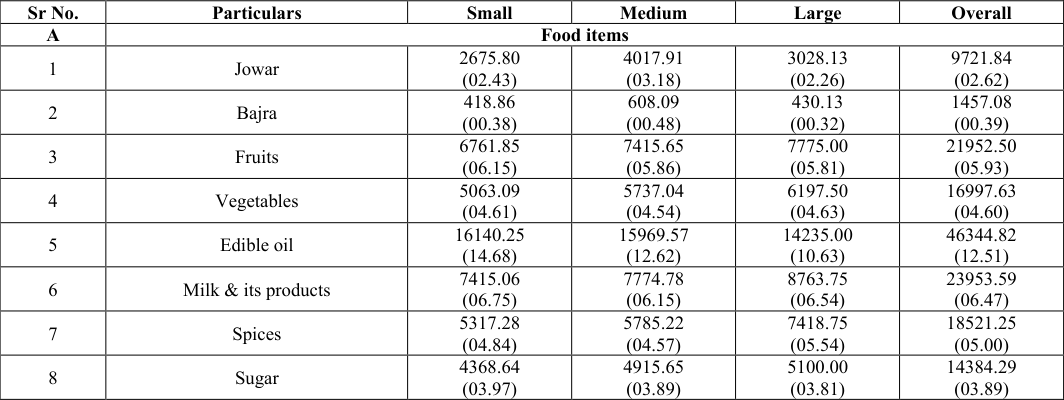 Table 2
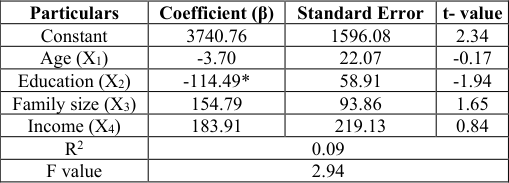 Table 4
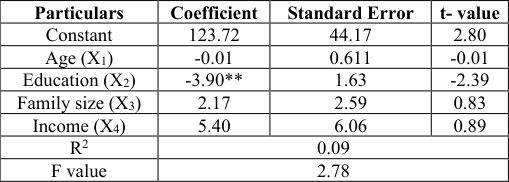 Table 3
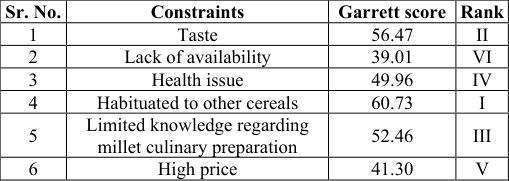 Table 5
Introduction
Millets are small-seeded cereal crops that have traditionally formed an important part of the food systems of many regions, particularly in Asia and Africa. They are valued for their nutritional composition, adaptability to diverse agro-climatic conditions and relatively lower water requirements. In recent years, growing awareness of healthy diets, nutritional security and climate-resilient agriculture has renewed interest in millet consumption. Millets provide carbohydrates, dietary fibre, minerals, vitamins and other beneficial nutrients, making them suitable for inclusion in balanced diets. In India, millets have historically been consumed in the form of traditional foods such as rotis, porridges and other preparations. However, changes in dietary preferences, urbanization, rising incomes and the increasing availability of rice and wheat have influenced millet consumption patterns over time. Despite their nutritional and environmental advantages, their consumption has remained relatively limited compared with major cereals. Factors such as taste preferences, limited knowledge of millet-based recipes, changing food habits, availability and price may influence consumer demand.
The renewed emphasis on millets, particularly following the declaration of 2023 as the International Year of Millets, has encouraged greater attention towards their production, processing and consumption. Understanding consumption trends is therefore important for assessing the changing role of millets in household diets and nutritional security.
Studying millet consumption can also help identify the factors influencing consumer choices and the constraints limiting wider adoption. Against this background, the present study examined the trends and changes in millet consumption and explored the factors influencing consumption behaviour, with a view to understanding the emerging consumption pattern of millets in India.
The study was undertaken to examine the consumption pattern of millets in Amravati district and to determine the factors influencing millet consumption among the selected respondents.
Methodology
Methodology
Sources of data
The study is based on primary data of consumption of millets. The annual data on consumption patterns of millets in Amravati district was collected for calendar year 2025.
Collection of data
The study was conducted in the Amravati district of Maharashtra state for the year 2025-2026. There are fourteen tehsils in Amravati district, out of which two tehsils were selected randomly. From each tehsil, four villages were selected i.e. total eight villages. Fifteen farmers from each village were selected. As such total 120 respondence was selected for present study.
Sampling procedure
A well-structured interview schedule was used for the collection of data. The schedule was prepared by taking into consideration the objectives of the study. The schedule was pre-tested, modified and then the personal enquiry can be done in the selected villages for obtaining information. The primary data for this study was collected through a survey.
Method of Analysis
The collected data were analyzed and the results were presented in the tables in order to bring out generalization of facts from which meaningful inference could be drawn.
Tools of Analysis
The choice of the statistical and econometric tools of analysis was decided with reference to the objectives of the study and the nature of data collected. The analytical techniques used in the study are presented below.
Consumption pattern
The simple tabular analysis, frequency and percentage was used for study the consumption pattern of millets in Amravati district and that pattern was studied on the basis of primary data collected from 120 farmers from Amravati district for the calendar year 2025.
Factors influencing the consumption of millets
Multiple linear regression model was used to determine the factors affecting millet consumption in Amravati district.
The regression function used in this regard as follows:
Where, Y = Total annual household quantity/ expenditure
Garrett's ranking technique
Garrett's ranking technique was adopted for analyzing the factors affecting the consumption pattern of millets. In this method the respondents were asked to rank the factors identified for the purpose of study according to their preferences. Thus, the assigned ranks were calculated by using the following formula:
Where, R ij -Rank given for the i th item by the j th , respondent and N j -Number of items ranked by the j th , respondent
Results and discussion
Results and discussion
Consumption pattern of selected households in Amravati district
The study of consumption patterns helps understand household spending behaviour, income allocation and living standards. In Amravati district, it provides insights into expenditure on food and non-food items and reflects the socio-economic conditions and consumption preferences of households.
Composition of average annual household food quantity consumption
The composition of average annual consumption of food and non-food items among small, medium and large farmers in Amravati district is presented in table 1. The average annual household consumption increased with farm size, from 2520.40 kg for small farms to 3369.14 kg for large farms. Food consumption was highest among medium farm households (751.01 kg), while non-food items constituted the major share of total consumption (75.64%). Among millets, jowar consumption was higher than bajra across all farm-size groups, accounting for 3.00 per cent and 0.67 per cent of total consumption, respectively. Overall, non-food items dominated household consumption, while millet consumption remained relatively low.
Composition of average annual household food consumption expenditure
The composition of average annual food and non-food consumption expenditure among small, medium and large farmers in Amravati district is presented in table 2. The average annual household expenditure increased with farm size, from ₹1,09,928.52 for small farm households to ₹1,33,907.63 for large farm households. Food expenditure was highest among large farm households (₹55,457.63), while non-food items accounted for the major share of total expenditure (56.46%). Among food items, edible oil recorded the highest expenditure, followed by milk and milk products and fruits. Jowar expenditure was higher than bajra across all farm-size groups, accounting for 2.62 per cent and 0.39 per cent of total household expenditure, respectively. Overall, non-food items dominated household expenditure, and total expenditure increased progressively with farm size.
Factors influencing consumption of millets
Food consumption patterns were influenced by various socio-economic and demographic factors such as age, education, family size, occupation and household income. These factors affected the quantity, quality, variety and expenditure on food. Therefore, an attempt was made to identify and analyse the major factors influencing the food consumption pattern of the selected households.
Factors influencing food consumption pattern of millets (Quantity wise)
The factors influencing food consumption pattern of millets (Quantity wise) is presented in table 3. The regression analysis showed that education was the only factor significantly influencing the quantity of millet consumption, with a negative coefficient of -3.90, significant at the 5 per cent level. Age (-0.01), family size (2.17) and income (5.40) had non-significant effects, indicating that these variables did not have a meaningful influence on millet consumption. The R² value of 0.09 indicated that the selected variables explained 9 per cent of the variation in millet consumption. The F-value of 2.78 indicated that the model had overall explanatory power. Overall, education emerged as the major significant determinant of quantity-wise millet consumption among the selected respondents.
| Particulars | Coefficient | Standard Error | t- value |
|---|---|---|---|
| Constant | 123.72 | 44.17 | 2.80 |
| Age (X1) | -0.01 | 0.611 | -0.01 |
| Education (X2) | -3.90** | 1.63 | -2.39 |
| Family size (X3) | 2.17 | 2.59 | 0.83 |
| Income (X4) | 5.40 | 6.06 | 0.89 |
| R2 | 0.09 | ||
| F value | 2.78 |
Table text extracted from the original PDF; superscript letters are shown inline. The original table image is below.
View original table image
Factors influencing food consumption pattern of millets (Expenditure wise)
The factors influencing food consumption pattern of millets (Expenditure wise) is presented in table 4. The regression analysis indicated that education was the only significant factor influencing expenditure on millet consumption, with a negative coefficient of -114.49, significant at the 10 per cent level. Age (-3.70), family size (154.79) and income (183.91) had positive or negative but statistically non-significant effects. The R² value of 0.09 indicated that the selected variables explained 9 per cent of the variation in millet consumption expenditure. The Fvalue of 2.94 indicated the overall explanatory power of the model. Overall, education emerged as the only significant determinant of expenditure-wise millet consumption among the selected respondents.
| Particulars | Coefficient (β) | Standard Error | t- value |
|---|---|---|---|
| Constant | 3740.76 | 1596.08 | 2.34 |
| Age (X1) | -3.70 | 22.07 | -0.17 |
| Education (X2) | -114.49* | 58.91 | -1.94 |
| Family size (X3) | 154.79 | 93.86 | 1.65 |
| Income (X4) | 183.91 | 219.13 | 0.84 |
| R2 | 0.09 | ||
| F value | 2.94 |
Table text extracted from the original PDF; superscript letters are shown inline. The original table image is below.
View original table image
suitable strategies to promote millet consumption, dietary diversity and nutritional well-being. The Garrett ranking analysis was undertaken to identify and prioritize the major constraints influencing the food consumption pattern of millets among households and presented in table 5.
| Sr. No. | Constraints | Garrett score | Rank |
|---|---|---|---|
| 1 | Taste | 56.47 | II |
| 2 | Lack of availability | 39.01 | VI |
| 3 | Health issue | 49.96 | IV |
| 4 | Habituated to other cereals | 60.73 | I |
| 5 | Limited knowledge regarding millet culinary preparation | 52.46 | III |
| 6 | High price | 41.30 | V |
Table text extracted from the original PDF; superscript letters are shown inline. The original table image is below.
View original table image
Conclusion
The study concluded that millet consumption among the selected households in Amravati district was relatively low, with non-food items accounting for the major share of household consumption and expenditure. Jowar was consumed and purchased in greater quantity than bajra across all farm-size groups, indicating its greater preference among the selected households. Total household consumption and expenditure increased with farm size, while food expenditure formed a comparatively smaller share than non-food expenditure. The regression analysis revealed that education was the only significant factor influencing both the quantity and expenditure on millet consumption, whereas age, family size and income were not statistically significant. The major constraints affecting millet consumption were habitual consumption of rice and wheat, taste preferences and limited knowledge of millet preparation, while lack of availability was the least important constraint. Overall, the findings indicated that millet consumption could be encouraged through nutrition awareness, promotion of millet-based recipes, culinary demonstrations and measures to improve consumer acceptance of millets.
References
9 in the original paper- Agarkar KD, Shende NV, Bagde NT, Warade SV. Food consumption pattern of Maharashtra. International Journal of Agriculture and Food Science. 2025;7(8):1401-1407.
- Anushree RK, Agarkar BS, Kapse PS, Pawar VS. Household survey on sociodemographic factors, suggestions and constraints of millet consumption in Parbhani city, Maharashtra. International Journal of Agriculture Extension and Social Development. 2024;7(7):555-559.
- Baliarsingh RK, Dhal S, Nath SC, Swain D. Factors influencing millet consumption in Odisha: an empirical review from consumer perspective. Srusti Management Review. 2024;17(2).
- Dakulge SG, Deshmukh PR, Kadam RP, Jakkawad SR, Pathrikar DT. Constraints experienced by youngsters in millet consumption in Parbhani district. International Journal of Research in Agronomy. 2025;8(8S):437-439.
- Gali B, Rao PP. Regional analysis of household consumption of sorghum in major sorghum-producing and sorghum-consuming states in India. Food Security. 2012;4(2):209-217.
- Kaur M, Banga G. Understanding consumer perception and factors influencing consumption of millets and millet-based products. IJSAT-International Journal on Science and Technology. 2025;16(2).
- Mohan AR, George A, George G. Consumer perception and factors influencing consumption of millets. Journal of Tropical Agriculture. 2021;59(2).
- Reddy MM, Babu GP, Vasanthi R, Murthy BR. Factors influencing the consumption pattern of millets and millet based products in Kurnool district of Andhra Pradesh. Health. 2023;112:1.
- Shende NV, Ganvir BN, Wayakar MR. Food consumption pattern in Maharashtra. 2015.