
Research article · 2026 · Full text
International Journal of Agriculture and NutritionChanges in Women’s Minimum Dietary Diversity through High-Value Fruits and Crops Farming: Evidence from the RMTP Baseline, Endline and Control Group Evaluation in Mirsarai, Sitakunda and Hathazari Upazilas, Chattogram, Bangladesh
Volume 8(8) · Pages 100–106 · DOI: 10.33545/26646064.2026.v8.i8b.739 ↗
Research areasChild Nutrition and Water AccessAgricultural Innovations and PracticesFood Security and Socioeconomic Dynamics
Abstract
Author-writtenAdequate dietary diversity is a critical determinant of maternal health, micronutrient adequacy and intergenerational nutritional status in low and middle income countries. Agricultural commercialization through high-value crops offers a strategic pathway to alleviate household food insecurity and enhance women's nutritional outcomes. This study evaluates the empirical impact of the “High-Value Fruit and Crops Varieties Extension and Marketing Sub-Project” on the Minimum Dietary Diversity for Women (MDD-W) in Chattogram, Bangladesh. A cross sectional comparative endline assessment was conducted involving N=433 households (361 beneficiaries in Mirsarai and Sitakunda upazilas; 72 control group households in Hathazari upazila). Dietary intake among women of reproductive age (15-49 years) was assessed using a 24-hour recall tool covering 10 defined food groups following FAO/INDDEX guidelines. Endline data revealed a substantial progression in dietary diversity among the treatment group. Among direct female respondents, 69.86% of women in the beneficiary group achieved the minimum dietary diversity threshold (MDD-W≤5), compared to only 33.33% in the control group. Factoring in proxy household data, 91.69% of the total beneficiary sample achieved adequate dietary diversity, juxtaposed against 19.44% to 25.00% across varied demographic subsets in the control group. Severe disparities emerged in specific food group consumption; 99.72% of beneficiaries consumed meat, poultry and fish compared to 40.28% in the control group, while pulse consumption reached 100% for beneficiaries versus 34.72% for the control. Despite wealth driven shifts toward proteins and lipids, dairy and vitamin A rich fruits consumption remained critically low across both cohorts. Marital status exhibited a statistically significant association with meeting the MDD-W threshold in both the beneficiary (p=0.041) and control (p=0.043) populations. The transition from subsistence farming to high-value, market oriented agriculture significantly elevates women's dietary diversity, primarily by facilitating the purchase of expensive animal source proteins and fats. However, structural dietary blind spots persist, indicating that agricultural income generation must be explicitly paired with behavioral change communication to achieve holistic micronutrient adequacy.
Summary
Source-checkedPlain-language reading of the full paper, prepared with AI and checked against the text. Each point links to the authors' own words.
Why it matters
- Dietary diversity is essential for maternal health and micronutrient adequacy in low- and middle-income countries. View evidence ↗
- Commercializing high-value fruits and crops is a strategy used to increase household income and improve the quality of diets. View evidence ↗
The question
- The study aims to evaluate how the RMTP high-value agriculture intervention impacts the dietary diversity of women. View evidence ↗
What they did
- The researchers compared dietary diversity outcomes between beneficiary groups in Mirsarai and Sitakunda and a control group in Hathazari. View evidence ↗
- The quantitative sample included 361 beneficiary households and 72 control households, totaling 433 households. View evidence ↗
- Minimum Dietary Diversity for Women (MDD-W) was measured using a standardized 24-hour dietary recall for women aged 15-49, following FAO and INDDEX guidelines. View evidence ↗
What they found
- Among direct respondents, 69.86% of women in the beneficiary group met the minimum dietary diversity threshold, compared to 33.33% in the control group. View evidence ↗
- When including proxy data, 91.69% of the beneficiary sample achieved adequate dietary diversity, while only 19.44% to 25.00% of the control group did. View evidence ↗
- Beneficiaries had much higher consumption of proteins: 99.72% consumed meat, poultry, and fish (vs 40.28% control) and 100% consumed pulses (vs 34.72% control). View evidence ↗
- Consumption of dairy, vitamin A-rich produce, and general fruits remained low for both groups, regardless of the intervention. View evidence ↗
- For beneficiaries, marital status was the only statistically significant factor for dietary diversity, with married women making up 87.81% of those meeting the threshold. View evidence ↗
- 98.60% of beneficiary women received nutrition training, and 87.00% of those households reported improved dietary habits. View evidence ↗
What it means
- The authors conclude that agricultural commercialization alone is not enough for full micronutrient coverage and must be paired with Behavioral Change Communication. View evidence ↗
- The authors note that structural barriers, such as financial constraints (85.10%) and limited market access (84.40%), continue to impede total dietary adequacy. View evidence ↗
Visual summary
2 visualsIllustrations explain the paper; charts are replotted from the paper's own table values.
Dietary Shift Analysis
AI-generated conceptual illustration (Assorted food groups including grains, meat, fish, pulses, dairy, and vitamin A-rich fruits). It explains the idea and does not show study data.
View source evidence ↗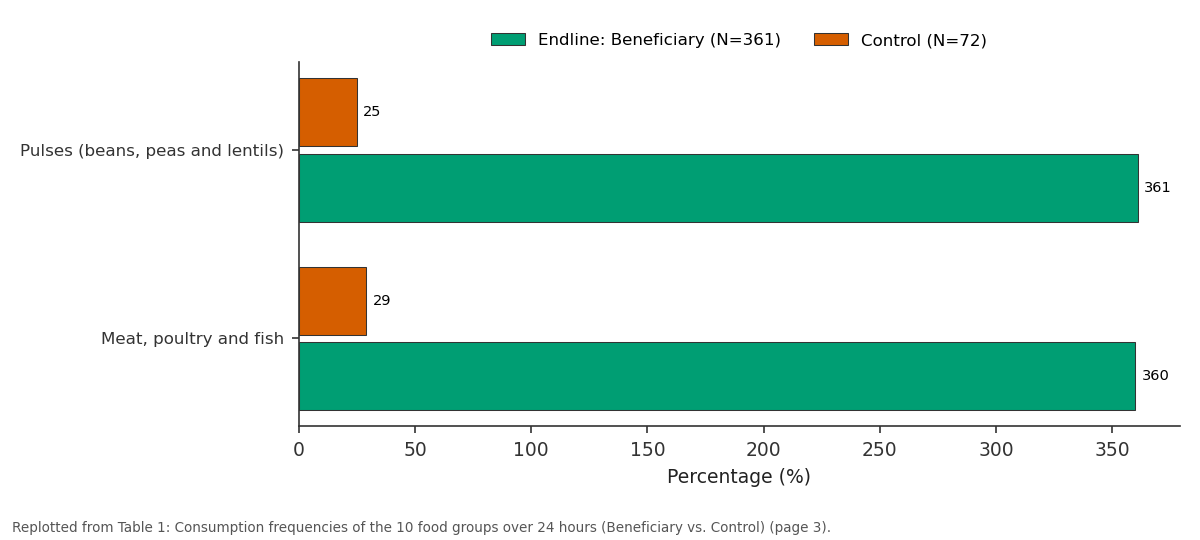
Endline: Beneficiary (N=361) and Control (N=72): Pulses (beans, peas and... vs Meat, poultry and fish
Replotted from Table 1 (page 3) of the original paper. Every bar is the paper's own table value.
View source evidence ↗Figures & tables
From the original paper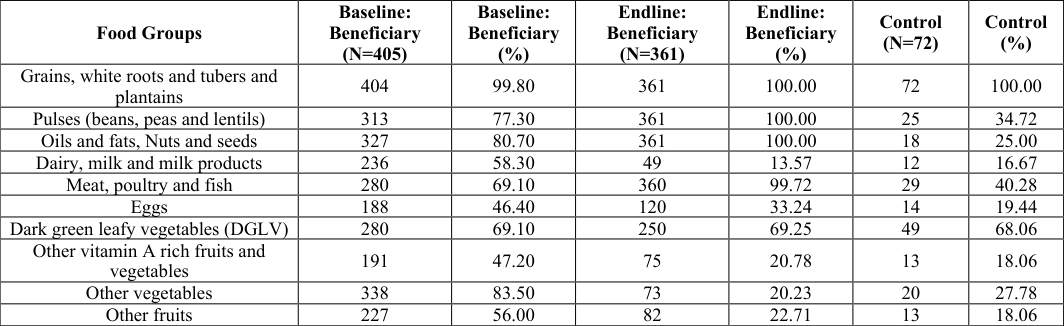 Table 1
 Table 2
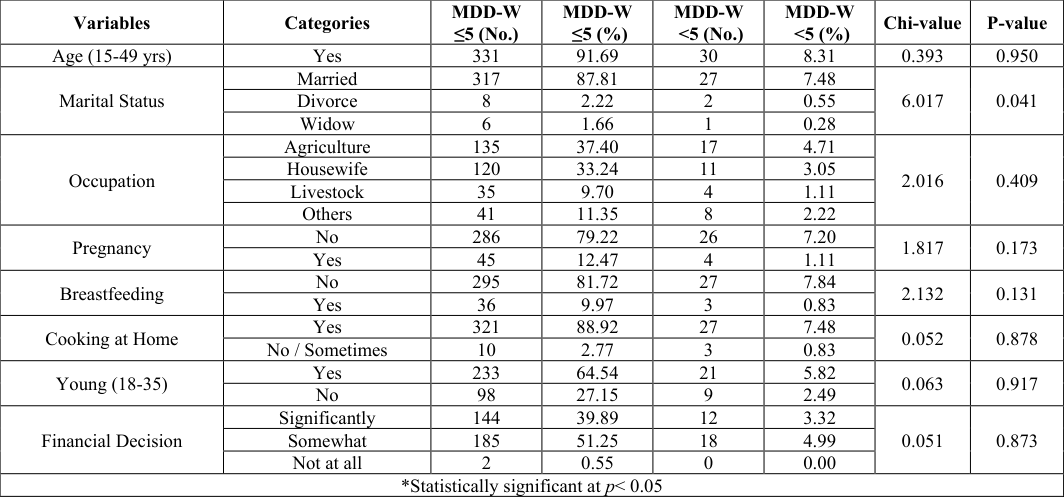 Table 3
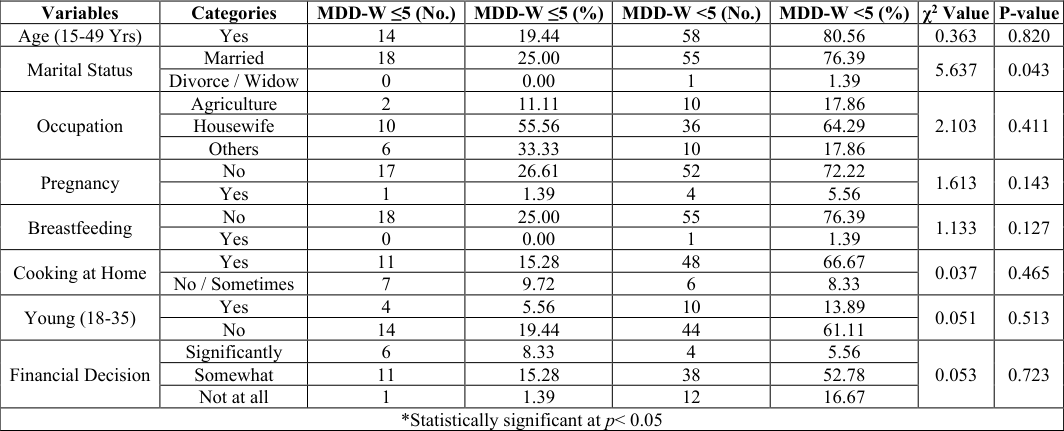 Table 4
Introduction
Micronutrient malnutrition and chronic food insecurity remain pervasive public health challenges across South Asia, disproportionately affecting women of reproductive age (15-49 years). This demographic bears unique physiological burdens and socio-economic vulnerabilities, rendering them highly susceptible to hidden hunger a deficiency in essential vitamins and minerals that compromises immune function, maternal survival and fetal development (Black et al., 2013; International Food Policy Research Institute, 2020) [5,14] . In agrarian economies like Bangladesh, rural agricultural transitions play a foundational role in shaping household food environments and intra household dietary distribution patterns (Hossain, 2004; Headey et al., 2012) [11,10] . Historically, agricultural policies heavily favored traditional subsistence farming biased toward high yield cereal production. While successful in ensuring caloric sufficiency, this paradigm frequently fails to supply the diverse spectrum of micronutrients required for optimal metabolic and maternal health (Bouis et al., 2011; Pingali, 2012) [6,21] . To rectify this systemic imbalance, nutrition sensitive agricultural interventions particularly the cultivation, integration and commercialization of High-Value Fruits and Crops (HVFC) have emerged as indispensable strategic pathways designed to simultaneously augment household income and catalyze improvements in dietary quality (Hawkes et al., 2012; Ruel and Alderman, 2013) [9,22] . The Minimum Dietary Diversity for Women (MDD-W) indicator, validated by the Food and Agriculture Organization (FAO) and the INDDEX Project, serves as a globally recognized proxy for assessing the probability of micronutrient adequacy in the diets of women of reproductive age (FAO, 2011; INDDEX Project, 2018) [8,13] . MDD-W is defined by the consumption of at least five out of ten specific food groups over a standard 24h recall period. Extensive epidemiological research indicates that achieving this ≤5 threshold significantly increases the likelihood of adequate daily intake of 11 critical micronutrients, thereby buffering vulnerable populations against hidden hunger and bolstering long-term physiological resilience (Becquey and Martin-Prevel, 2010; Martin-Prével et al., 2017) [3,18] . In rural Bangladesh, the baseline dietary reality frequently exhibits a heavy, monotonous reliance on starchy staples (grains, white roots and tubers) coupled with highly variable and seasonal inclusion of animal source proteins, dairy and vitamin A rich produce (Ahmed et al., 2007; Sraboni et al., 2014) [1,24] . [4] . Although increased agricultural commercialization is widely theorized to drive food security (Carletto et al., 2017; Kuma et al., 2019) [7,16] , the empirical pathway from cash crop commercialization to intra household nutritional equity specifically impacting women's dietary choices requires rigorous, localized comparative evaluation to distinguish income effects from substitution effects. Therefore, the primary objective of this manuscript is to comprehensively evaluate the empirical impact of the RMTP high-value agriculture intervention on women's dietary diversity. By conducting an endline comparative analysis of the MDD-W outcomes between the beneficiary (treatment) groups in Mirsarai and Sitakunda upazilas and a geographically contiguous non-beneficiary (control) group in Hathazari upazila, this study elucidates how commercial agricultural extension definitively reshapes consumption habits. Furthermore, the research investigates the underlying socio-demographic determinants including age, occupation, marital status and financial empowerment that govern a woman's capacity to achieve the recommended MDD-W threshold in transitioning rural economies.
Materials and Methods
Materials and Methods
Study area and research design
The research employed a rigorous cross-sectional comparative endline evaluation design to assess dietary diversity and socio-demographic indicators across targeted populations. The study was conducted in the Chattogram district of Bangladesh between September to October, 2025. The treatment (beneficiary) group was sampled from Sitakunda upazila (encompassing unions such as Bariyardhala, Sitakunda Sadar, Muradpur, Barbakund, Banshbaria, Bara Kumira, Sonaichari and Bhatiari) and Mirsarai upazila (including Wahedpur, Khaiyachara and Mirsarai Municipality). To isolate the specific effects of the RMTP intervention and ensure analytical rigor, Hathazari upazila (including unions such as Fatehpur, Chikomdondi and Ward 1 of Chattogram City Corporation) was purposively selected as the control area. Hathazari shares similar agro ecological and baseline socio-economic characteristics with the treatment sites but did not receive the high-value agricultural extension and marketing support.
Sampling strategy and participants
A mixed methods sampling approach was utilized to gather both statistically significant empirical data and nuanced socio cultural contexts. For the quantitative survey, the sample size was determined using Cochran's formula based on a total established beneficiary population of 6,038 households. The required treatment sample was calculated to be N=361 households. In adherence to the strict project evaluation protocol, a control group equivalent to 20% of the treatment sample (N=72) was surveyed, culminating in a total quantitative sample of N=433 households. Stratified cluster sampling was systematically applied to ensure proportionate representation across unions and villages, stratifying by gender, age group and socio economic vulnerability.
Concurrently, an extensive qualitative assessment was executed to triangulate the quantitative nutritional findings. Purposive sampling targeting data saturation yielded a qualitative cohort of N=75 stakeholders. This comprehensive qualitative matrix included 63 Key Informant Interviews (KIIs) with local fruit processors, biofertilizer and biopesticide dealers, market aggregators (arotders), agricultural officers and transport agencies, alongside 6 Focus Group Discussions (FGDs) and 6 In-Depth Interviews (IDIs) specifically focusing on women, youth entrepreneurs and highly successful micro enterprise case studies.
Measurement of Minimum Dietary Diversity for Women (MDD-W)
The primary dependent variable, Minimum Dietary Diversity for Women (MDD-W), was empirically measured using the standardized 24h dietary recall methodology for women of reproductive age (15-49 years). The protocol strictly adhered to the guidelines established by the Food and Agriculture Organization (FAO) and the INDDEX project (FAO, 2011; INDDEX Project, 2018) [8,13] . The survey instrument categorized all food and beverages consumed by the respondent during the preceding day and night into 10 distinct, nutritionally significant groups: ( For the strict MDD-W direct respondent analysis, 73 women from the treatment group and 9 women from the control group falling precisely within the 15-49 age bracket were interviewed directly. To construct a holistic dataset representing the dietary reality of the entire sampled household base, eligible female household members (e.g. wife, mother, sister, or adult daughter) provided proxy 24h dietary recall data for the remaining households where the primary respondent fell outside the demographic criteria. A woman was classified as achieving adequate micronutrient probability if her computed dietary diversity score was ≤5 out of the 10 food groups.
Data processing and statistical analysis
Quantitative field data were digitally recorded, cleaned and analyzed using the Statistical Package for the Social Sciences (SPSS) and Microsoft Excel. Descriptive statistics, specifically frequencies and percentages, were calculated to delineate the consumption rates of the 10 food groups and chart the distribution of aggregate MDD-W scores. Bivariate analyses, relying on Pearson's Chi-square (χ 2 ) tests, were conducted to evaluate the statistical significance of associations between various socio-demographic independent variables (age, marital status, pregnancy, lactation, cooking status, young adult demographics and financial decision making power) and the binary achievement of the MDD-W threshold (<5 vs. ≤5). The critical threshold for statistical significance was established at p< 0.05. Qualitative narratives were subjected to rigorous thematic analysis to contextualize and explain the quantitative dietary shifts.
Results
Results
Shifts in dietary diversity: Baseline to Endline progression
Evaluating the programmatic trajectory reveals a profound structural shift in dietary adequacy among the beneficiary population. The regional baseline assessment indicated that approximately 80.2% of sampled women achieved the ≤5 MDD-W threshold; however, this foundational diversity masked severe inadequacies in critical micronutrient categories, notably dairy (54.6%), eggs (42.7%) and vitamin A rich fruits (45.9%). Following the RMTP high-value agriculture intervention, the endline evaluation demonstrated a marked consolidation of dietary security. When analyzing the aggregate proxy data encompassing the entire treatment sample (N=361), an overwhelming 91.69% of beneficiary households met or exceeded the 5-food group minimum. This trajectory highlights a robust ecosystem wide improvement in household nutritional purchasing power consequent to commercial agricultural integration.
Direct MDD-W comparison: Beneficiary vs. Control group
A highly focused analysis isolating direct female respondents (women aged 15-49 directly executing the 24h recall) decisively delineates the intervention's impact. In the treatment group (N=73), 51 participants (69.86%) successfully consumed foods from 5 or more distinct groups, satisfying the FAO requirements for a highly diverse diet. Conversely, within the un-intervened control group in Hathazari upazila (N=9 direct respondents), merely 3 participants (33.33%) met the MDD-W ≤5 criterion. This empirical contrast demonstrates that women operating within the beneficiary agricultural zones are more than twice as likely to maintain micronutrient adequate diets compared to their non-beneficiary counterparts.
Comparative consumption patterns of the ten food groups
Table 1 provides a granular breakdown of the exact consumption frequencies across the 10 defined food groups for the complete aggregate sample of beneficiary and control households, exposing stark differences in nutrient sourcing. Critically, despite the overarching dietary superiority generated by commercial agricultural income, specific micronutrient dense categories proved highly resistant to improvement in both cohorts. Dairy consumption languished at critically depressed levels (13.57% for beneficiaries vs. 16.67% for controls). Similarly, the ingestion of other vitamin A rich fruits and vegetables (20.78% vs. 18.06%) and general fruits (22.71% vs. 18.06%) remained uniformly poor, indicating deeply entrenched structural blind spots in regional consumption habits regardless of income bracket.
Distribution of MDD-W total scores
The aggregate distribution of total MDD-W scores, mapping the breadth of dietary diversity, is detailed in Table 2. The beneficiary population data is heavily skewed toward highdiversity outcomes, with a massive 55.13% consuming between 6 and 7 unique food groups daily. Conversely, the control population is overwhelmingly trapped in a state of nutritional monotony, with 77.78% restricted to consuming only 3 or 4 food groups.
| MDD-W Score | Beneficiary (N=361) | Beneficiary (%) | Control (N=72) | Control (%) |
|---|---|---|---|---|
| 3 - 4 | 30 | 8.31 | 56 | 77.78 |
| 5 | 112 | 31.02 | 9 | 12.50 |
| 6 | 137 | 37.95 | 8 | 11.11 |
| 7 | 62 | 17.18 | 1 | 1.39 |
| 8 | 20 | 5.54 | 0 | 0.00 |
| Total ≤5 | 331 | 91.69 | 16 | 25.00 |
Table text extracted from the original PDF; superscript letters are shown inline. The original table image is below.
View original table image
Socio demographic determinants of dietary diversity
To isolate the specific household and individual characteristics influencing dietary adequacy, crosstabulations and Pearson's Chi-square tests were performed.
Tables 3 and4 detail the statistical relationship between socio-demographic indicators and the binary achievement of the MDD-W ≤5 threshold for the beneficiary and control cohorts, respectively. In the beneficiary ecosystem, marital status emerged as the sole statistically significant socio-demographic determinant of dietary diversity (χ 2 = 6.017, p = 0.041). Married women heavily dominated the ≤5 category (87.81%). While not achieving formal statistical significance due to the overwhelming uniformity of the positive responses (p = 0.873), it is analytically crucial to observe that 91.14% of women achieving adequate dietary diversity simultaneously reported being "significantly" or "somewhat" more involved in household financial decision-making compared to the pre-project era. Variables such as specific occupation, pregnancy status and age did not present statistically significant barriers to achieving diversity, suggesting the intervention's benefits were broad-based. Parallel to the treatment findings, marital status operated as the only statistically significant predictor of MDD-W in the control group (χ 2 = 5.637, p = 0.043). Married women constituted the entirety of the control subset that successfully navigated the nutritional threshold. The control group exhibited a heavily constrained occupational profile heavily dominated by house wives, where a staggering 64.29% failed to achieve MDD-W adequacy, underscoring how an absence of agricultural commercialization limits household purchasing power and, by extension, nutritional diversity.
Nutrition training and perceived food security challenges
Alongside agricultural extension, the RMTP intervention heavily integrated nutritional capacity building. Endline data reveals that an overwhelming 98.60% of beneficiary women received formal nutrition related training, directly resulting in 87.00% of these households reporting improved, balanced dietary habits. In stark contrast, 0.00% of the control group reported receiving any equivalent nutritional training. However, despite this enhanced knowledge base, significant structural barriers remain. When assessing ongoing food security challenges, 85.10% of beneficiaries cited 'financial barriers to quality food,' and 84.40% identified 'limited access to diverse foods' as primary obstacles, while 54.70% still pointed to 'poor nutrition knowledge' within the broader community. This indicates that while awareness has drastically improved, systemic market and financial constraints continue to impede total dietary adequacy.
Discussion
The fundamental objective of this investigation was to empirically assess shifts in women's dietary diversity stemming from the RMTP high-value agriculture intervention. The resultant endline data furnish compelling evidence that integrating smallholder and marginal farmers into modernized, lucrative agricultural value chains induces a rapid and profound positive shock to household dietary profiles.
The efficacy of agricultural commercialization on dietary diversity
The comparative analysis uncovers a vast nutritional chasm between the beneficiary and control cohorts. The achievement of the MDD-W threshold by 69.86% of direct female respondents in the treatment zones and up to 91.69% when factoring household level proxy integration stands in severe contrast to the 33.33% achievement rate within the Hathazari control group. Historical baseline data for the region indicated MDD-W adequacy hovered around 80.2% (Bhowmik et al., 2026) [4] , suggesting that the RMTP intervention robustly insulated and expanded the nutritional capacity of participating households against broader macroeconomic or seasonal stresses that evidently depressed the control group. This trajectory corroborates leading regional scholarship which posits that crop diversification and formalized market commercialization natively augment rural dietary profiles. By transitioning from rigid subsistence cereal farming toward high-value crops (e.g. dragon fruit, mango), households generate the liquid surplus cash requisite for accessing varied retail food markets (Pingali, 2015; Kuma et al., 2019) [20,16] . This "income effect" empowers families to purchase higher-cost, micronutrient-dense items that are notoriously difficult to cultivate on small, fragmented rural landholdings.
Unpacking the income effect: dietary shifts and enduring blind spots
A granular examination of the 10 food groups exposes the complex anatomy of the rural Bangladeshi diet transitioning through commercialization. The intervention triggered an extraordinary surge in the consumption of culturally highly valued proteins and lipids. Beneficiaries achieved a near absolute 100% saturation in the consumption of pulses and oils, while flesh foods (meat, poultry and fish) exploded to 99.72% dwarfing the control group's flesh food intake of 40.28%. As liquid capital scales through the sale of commercial crops, families prioritize these protein dense animal source foods, a behavioral economic pattern well documented in transitioning rural economies (Murphy and Allen, 2003; Ruel and Alderman, 2013) [19,22] . Paradoxically, the data also unmasks deep seated, culturally entrenched nutritional blind spots that are highly resistant to simple income elasticity. Despite immense wealth driven shifts toward meat and fish, dairy consumption remained dangerously suppressed (13.57% in beneficiaries vs. 16.67% in control) actually falling below the regional historical baseline of 54.6%. Furthermore, egg consumption for beneficiaries settled at a modest 33.24% and the intake of vitamin A rich produce stagnated near 20%. This discrepancy suggests a distinct "substitution effect" in agricultural labor and capital allocation. As households pivot aggressively toward lucrative cash crops, traditional, time intensive subsistence activities like homestead poultry rearing and dairy management may be de-prioritized or abandoned. Consequently, while overall MDD-W scores rocket upward fueled by purchased meats, oils and pulses, specific essential micronutrients derived from dairy and eggs are marginalized. This critical phenomenon confirms that while agricultural commercialization is a powerful engine for general food security, it is insufficient in isolation. It must be tightly coupled with targeted Behavioral Change Communication (BCC) to rectify rigid cultural omissions and ensure holistic micronutrient coverage (Saha et al., 2008; Iannotti et al., 2014) [23,12] .
Socio demographic drivers: Empowerment and nutrition
The statistical analysis highlights marital status as the primary determinant of achieving dietary diversity in both populations (p< 0.05). The protective effect of marriage on dietary adequacy is frequently theorized to stem from dual income pooling, consolidated household agricultural labor and stronger community safety nets that stabilize food access during shocks (Sraboni et al., 2014; Malapit et al., 2015) [24,17] . Crucially, the endline data illuminates the profound intersection of female financial agency and household nutrition. Within the beneficiary ecosystem, an overwhelming 91.14% of women achieving MDD-W adequacy simultaneously reported enhanced, active involvement in household financial decision-making compared to the pre-intervention era. When rural women possess direct agency over agricultural revenues and strategic budget allocation, capital is disproportionately funneled toward improved intra household nutrition, dietary diversification and child welfare validating the core theoretical premise of gender integrated, nutrition sensitive agriculture (Arimond and Ruel, 2004; Kennedy et al., 2011) [2, 15] . Furthermore, the under consumption of dairy and specific fruits persists despite highly successful educational interventions. The endline survey indicates that 98.60% of beneficiary women received nutrition related training (compared to 0% in the control) and 87.00% actively reported improving their family's dietary practices. Therefore, the stagnant consumption of dairy and vitamin A rich fruits is not merely a deficit of knowledge. Rather, as self-reported by the beneficiaries, the primary ongoing constraints are structural 85.10% face 'financial barriers to quality food' and 84.40% suffer from 'limited access to diverse foods' within their immediate rural markets. This demonstrates that while educational awareness successfully reshapes general dietary habits, it cannot overcome absolute market absences. Future interventions must move beyond mere nutritional education to actively subsidize or establish localized supply chains for these specific, missing nutrient dense foods.
Conclusion
The RMTP High-Value Fruits and Crops Varieties Extension and Marketing Sub-Project has demonstrably succeeded in elevating the nutritional baseline of rural women in Chattogram. By systematically integrating marginal smallholders into profitable commercial value chains, the intervention catalyzed a massive expansion in household dietary diversity, driven primarily by the newfound financial capacity to purchase essential animal proteins and lipids. With beneficiary adequacy rates exceeding 91%, the treatment cohort drastically outperformed the stagnating control baseline. Nevertheless, the persistent, systemic under-consumption of dairy and specialized vitamin-rich produce amidst rising general incomes serves as a critical caveat. The fusion of high-value commercial agriculture with targeted women's financial empowerment is a highly potent engine for poverty alleviation; however, to entirely eradicate hidden hunger, this economic engine must be explicitly steered by continuous, culturally sensitive nutritional education.
Administrative Statements
Administrative Statements
Acknowledgement
AcknowledgmentsFor their financial assistance, motivation, and helpful advice
Figures and tables from the paper
| Variables | Categories | MDD-W ≤5 (No.) | MDD-W ≤5 (%) | MDD-W <5 (No.) | MDD-W <5 (%) | Chi-value | P-value |
|---|---|---|---|---|---|---|---|
| Age (15-49 yrs) | Yes | 331 | 91.69 | 30 | 8.31 | 0.393 | 0.950 |
| Marital Status | Married | 317 | 87.81 | 27 | 7.48 | 6.017 | 0.041 |
| Divorce | 8 | 2.22 | 2 | 0.55 | |||
| Widow | 6 | 1.66 | 1 | 0.28 | |||
| Occupation | Agriculture | 135 | 37.40 | 17 | 4.71 | 2.016 | 0.409 |
| Housewife | 120 | 33.24 | 11 | 3.05 | |||
| Livestock | 35 | 9.70 | 4 | 1.11 | |||
| Others | 41 | 11.35 | 8 | 2.22 | |||
| Pregnancy | No | 286 | 79.22 | 26 | 7.20 | 1.817 | 0.173 |
| Yes | 45 | 12.47 | 4 | 1.11 | |||
| Breastfeeding | No | 295 | 81.72 | 27 | 7.84 | 2.132 | 0.131 |
| Yes | 36 | 9.97 | 3 | 0.83 | |||
| Cooking at Home | Yes | 321 | 88.92 | 27 | 7.48 | 0.052 | 0.878 |
| No / Sometimes | 10 | 2.77 | 3 | 0.83 | |||
| Young (18-35) | Yes | 233 | 64.54 | 21 | 5.82 | 0.063 | 0.917 |
| No | 98 | 27.15 | 9 | 2.49 | |||
| Financial Decision | Significantly | 144 | 39.89 | 12 | 3.32 | 0.051 | 0.873 |
| Somewhat | 185 | 51.25 | 18 | 4.99 | |||
| Not at all | 2 | 0.55 | 0 | 0.00 | |||
| *Statistically significant at p< 0.05 |
Table text extracted from the original PDF; superscript letters are shown inline. The original table image is below.
View original table image
| Variables | Categories | MDD-W ≤5 (No.) | MDD-W ≤5 (%) | MDD-W <5 (No.) | MDD-W <5 (%) | χ2 Value | P-value |
|---|---|---|---|---|---|---|---|
| Age (15-49 Yrs) | Yes | 14 | 19.44 | 58 | 80.56 | 0.363 | 0.820 |
| Marital Status | Married | 18 | 25.00 | 55 | 76.39 | 5.637 | 0.043 |
| Divorce / Widow | 0 | 0.00 | 1 | 1.39 | |||
| Occupation | Agriculture | 2 | 11.11 | 10 | 17.86 | 2.103 | 0.411 |
| Housewife | 10 | 55.56 | 36 | 64.29 | |||
| Others | 6 | 33.33 | 10 | 17.86 | |||
| Pregnancy | No | 17 | 26.61 | 52 | 72.22 | 1.613 | 0.143 |
| Yes | 1 | 1.39 | 4 | 5.56 | |||
| Breastfeeding | No | 18 | 25.00 | 55 | 76.39 | 1.133 | 0.127 |
| Yes | 0 | 0.00 | 1 | 1.39 | |||
| Cooking at Home | Yes | 11 | 15.28 | 48 | 66.67 | 0.037 | 0.465 |
| No / Sometimes | 7 | 9.72 | 6 | 8.33 | |||
| Young (18-35) | Yes | 4 | 5.56 | 10 | 13.89 | 0.051 | 0.513 |
| No | 14 | 19.44 | 44 | 61.11 | |||
| Financial Decision | Significantly | 6 | 8.33 | 4 | 5.56 | 0.053 | 0.723 |
| Somewhat | 11 | 15.28 | 38 | 52.78 | |||
| Not at all | 1 | 1.39 | 12 | 16.67 | |||
| *Statistically significant at p< 0.05 |
Table text extracted from the original PDF; superscript letters are shown inline. The original table image is below.
View original table image
References
23 in the original paper- Ahmed AU, Hill RV, Smith LC, Wiesmann DM, Frankenberger T. The world's most deprived: characteristics and causes of extreme poverty and hunger. Washington, DC: International Food Policy Research Institute; 2007. doi:10.2499/0896297705.
- Arimond M, Ruel MT. Dietary diversity is associated with child nutritional status: evidence from 11 demographic and health surveys. J Nutr. 2004;134(10):2579-2585. DOI:10.1093/jn/134.10.2579.
- Becquey E, Martin-Prevel Y. Micronutrient adequacy of women's diet in urban Burkina Faso is low. J Nutr. 2010;140(11):2079S-2085S. Doi:10.3945/jn.110.123356.
- Bhowmik TK, Rahman M, Kashem MA, Rudra S, Mazumder P, Hossain M, et al. Factors influencing dietary diversity among women in two upazilla of Chattogram, Bangladesh: a cross-sectional study. Int J Food Sci Nutr. 2026;11(2):244-249. doi:10.66856/ijfsn.2026.11.2.11091.
- Black RE, Victora CG, Walker SP, Bhutta ZA, Christian P, De Onis M, et al. Maternal and child undernutrition and overweight in low-income and middle-income countries. Lancet. 2013;382(9890):427451. doi:10.1016/S0140-6736(13)60937-X.
- Bouis HE, Hotz C, McClafferty B, Meenakshi JV, Pfeiffer WH. Biofortification: a new tool to reduce micronutrient malnutrition. Food Nutr Bull. 2011;32(1 Suppl):S31-S40. doi:10.1177/15648265110321S105.
- Carletto C, Corral P, Guelfi A. Agricultural commercialization and nutrition revisited: empirical evidence from three African countries. Food Policy. 2017;67:106-118. doi:10.1016/j.foodpol.2016.09.020.
- FAO. Guidelines for measuring household and individual dietary diversity. Rome: Food and Agriculture Organization of the United Nations; 2011.
- Hawkes C, Turner LR, Waqa G. Policies to support healthy food choices and diets. Rome: FAO; 2012. 10. Headey D, Chiu A, Kadiyala S. Agriculture's role in the Indian enigma: help or hindrance to the crisis of undernutrition? Food Secur. 2012;4(1):87-102. doi:10.1007/s12571-011-0161-0.
- Hossain M. Rural non-farm economy in Bangladesh: a view from household surveys. Dhaka: Centre for Policy Dialogue; 2004.
- Iannotti LL, Lutter CK, Bunn DA, Stewart CP. Eggs: the uncracked potential for improving maternal and young child nutrition among the world's poor. Nutr Rev. 2014;72(6):355-368. doi:10.1111/nure.12107.
- INDDEX Project. Data4Diets: building blocks for dietrelated food security analysis. Boston: Tufts University; 2018.
- International Food Policy Research Institute. Global Nutrition Report 2020: action on equity to end malnutrition. Bristol: Development Initiatives; 2020.
- Kennedy G, Ballard T, Dop MC. Guidelines for measuring household and individual dietary diversity. Rome: Food and Agriculture Organization of the United Nations; 2011.
- Kuma T, Dereje M, Hirvonen K, Minten B. Cash crops and food security: evidence from Ethiopian smallholder coffee producers. J Dev Stud. 2019;55(6):1267-1284. doi:10.1080/00220388.2018.1425396.
- Malapit HJL, Kadiyala S, Quisumbing AR, Cunningham K, Tyagi P. Women's empowerment mitigates the negative effects of low production diversity on maternal and child nutrition in Nepal. J Dev Stud. 2015;51(8):1097-1123. doi:10.1080/00220388.2015.1018904.
- Martin-Prevel Y, Arimond M, Allemand P, Wiesmann D, Ballard TJ, Deitchler M, et al. Development of a dichotomous indicator for population-level assessment of the dietary diversity of women of reproductive age. Curr Dev Nutr. 2017;1(12):1-10. doi:10.3945/cdn.117.001701.
- Murphy SP, Allen LH. Nutritional importance of animal source foods. J Nutr. 2003;133(11 Suppl 2):3932S-3935S.
- Pingali P. Agricultural policy and nutrition outcomes: getting beyond the preoccupation with staple grains. Food Secur. 2015;7(3):583-591. doi:10.1007/s12571015-0461.
- Pingali PL. Green revolution: impacts, limits, and the path ahead. Proc Natl Acad Sci U S A. 2012;109(31):12302-12308. doi:10.1073/pnas.0912953109.
- Ruel MT, Alderman H; Maternal and Child Nutrition Study Group. Nutrition-sensitive interventions and programmes: how can they help to accelerate progress in improving maternal and child nutrition? Lancet. 2013;382(9891):536-551. doi:10.1016/S01406736(13)60843-0.
- Saha KK, Frongillo EA, Alam DS, Arifeen SE, Persson LA, Rasmussen KM. Appropriate infant feeding practices result in better growth of infants and young children in rural Bangladesh. Am J Clin Nutr. 2008;87(6):1852-1859. doi:10.1093/ajcn/87.6.1852.
- Sraboni E, Malapit HJ, Quisumbing AR, Ahmed AU. Women's empowerment in agriculture: what role for food security in Bangladesh? World Dev. 2014;61:1152. doi:10.1016/j.worlddev.2014.03.025.