
Research article · 2026 · Full text
International Journal of Biology SciencesLong-term Climate Variability and Potential Vulnerability of Mammalian Diversity in the Shekhawati Region of Rajasthan, India
Volume 8(8) · Pages 49–55 · DOI: 10.33545/26649926.2026.v8.i8a.977 ↗
Research areasSpecies Distribution and Climate ChangeWildlife Ecology and ConservationAnimal Ecology and Behavior Studies
Abstract
Author-writtenThe Shekhawati region of northeastern Rajasthan contains a diverse mammalian assemblage surrounded within an arid to semi-arid landscape. This study integrates a historical climatic assessment for Churu, Sikar and Jhunjhunu with a previously documented mammalian inventory to establish a quantitative climate-fauna baseline for conservation planning. Annual records for 1981-2025 were analysed for mean temperature, rainfall, relative humidity and wind speed using five-year period means, five-year moving averages and linear regression. Mann-Kendall and Sen’s slope statistics were additionally used to assess monotonic trends. The mammalian diversity comprised 40 species belonging to 8 orders, 20 families and 31 genera. Rodentia was the richest order (14 species), followed by Carnivora (9) and Chiroptera (8). Mean temperature showed weak, non-significant positive linear slopes in all three districts. In contrast, rainfall increased significantly in Churu (3.714 mm year−1), Sikar (5.028 mm year−1) and Jhunjhunu (4.533 mm year−1). Relative humidity increased significantly in all districts, whereas wind speed declined significantly. Mann-Kendall results corroborated the rainfall, humidity and wind-speed trends. The 2021-2025 period recorded particularly high rainfall and humidity relative to earlier five-year periods.
Summary
Source-checkedPlain-language reading of the full paper, prepared with AI and checked against the text. Each point links to the authors' own words.
Why it matters
- Climate variability significantly influences the ecological structure and function of drylands, as water availability limits primary productivity and affects entire food webs. View evidence ↗
- Arid and semi-arid ecosystems are highly sensitive to changes in rainfall and moisture, which in turn affect soil, vegetation, and the resources available to herbivores and predators. View evidence ↗
- Animal biodiversity in the region faces pressures from human activities, including urbanization, mining, agriculture, and habitat degradation. View evidence ↗
The question
- The study aimed to analyze trends in mean temperature, rainfall, relative humidity, and wind speed from 1981 to 2025, while also documenting mammalian biodiversity and feeding habits. View evidence ↗
What they did
- The researchers analyzed annual data for mean temperature, rainfall, relative humidity, and wind speed across the Churu, Sikar, and Jhunjhunu districts from 1981 to 2025. View evidence ↗
- Climatic trends were evaluated using linear regression, Mann-Kendall statistics for monotonic trends, and Sen's slope estimates. View evidence ↗
- Mammalian diversity was assessed through field surveys employing camera trapping, quadrat sampling, and transect walks. View evidence ↗
What they found
- Annual rainfall increased significantly across all three districts, with linear slopes ranging from 3.714 mm/year in Churu to 5.028 mm/year in Sikar. View evidence ↗
- Relative humidity showed a significant increase in all districts, with annual increases between 0.235 and 0.269 percentage points. View evidence ↗
- Mean wind speed declined significantly in all three districts, with the steepest decline observed in Jhunjhunu (-0.00549 m/s per year). View evidence ↗
What it means
- The authors recommend establishing an integrated climate-wildlife monitoring and conservation program for the Churu, Sikar, and Jhunjhunu districts. View evidence ↗
- The study did not directly measure microclimate, insect abundance, or bat activity, meaning it cannot demonstrate the specific mechanisms by which humidity affects these species. View evidence ↗
Visual summary
3 visualsIllustrations explain the paper; charts are replotted from the paper's own table values.
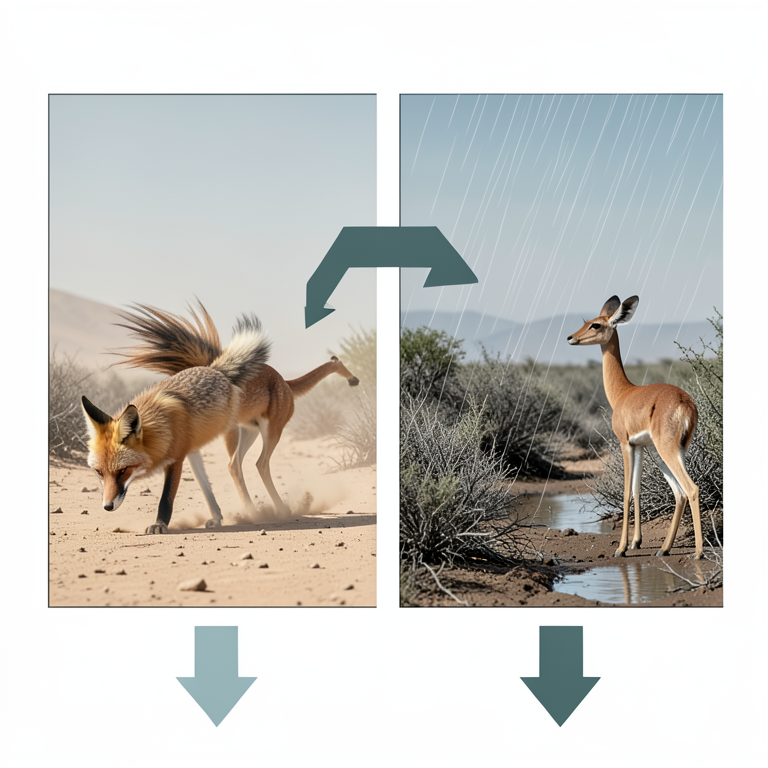
Hydroclimatic Shift in Shekhawati
AI-generated conceptual illustration (Arid landscape of the Shekhawati region with native mammals). It explains the idea and does not show study data.
View source evidence ↗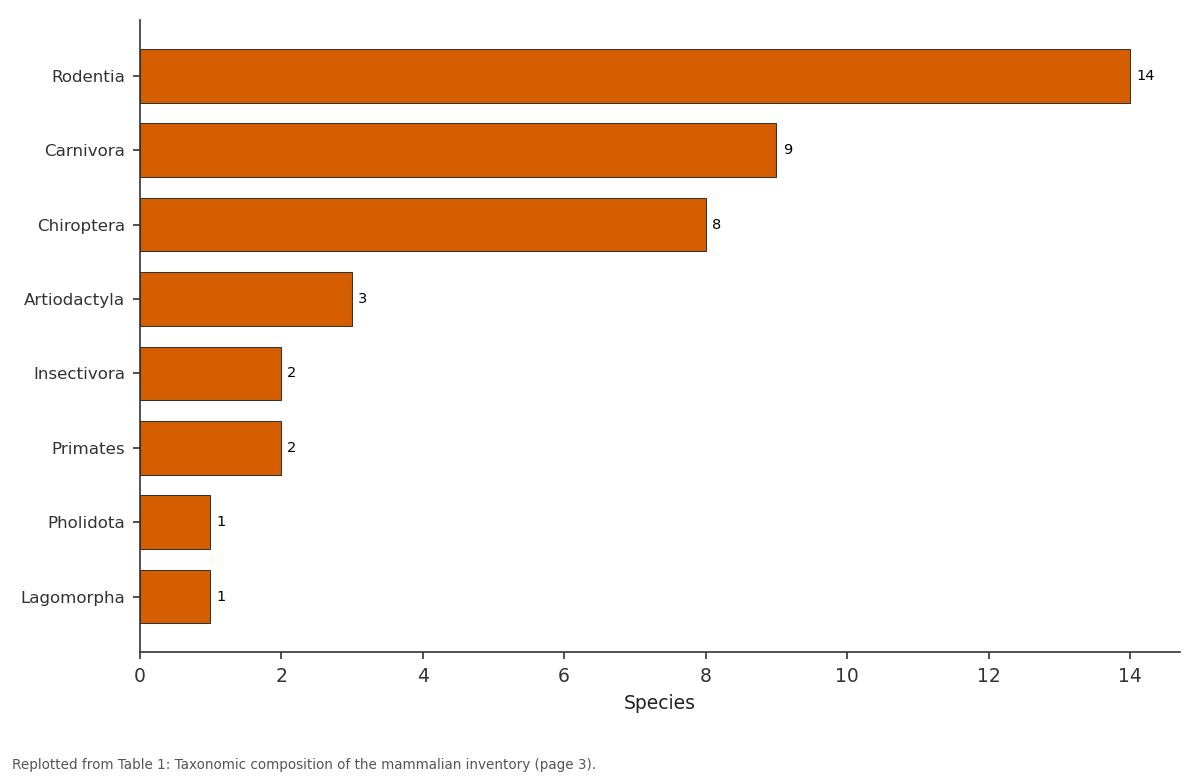
Species: Rodentia vs Carnivora vs Chiroptera vs Artiodactyla vs Insectivora
Replotted from Table 1 (page 3) of the original paper. Every bar is the paper's own table value.
View source evidence ↗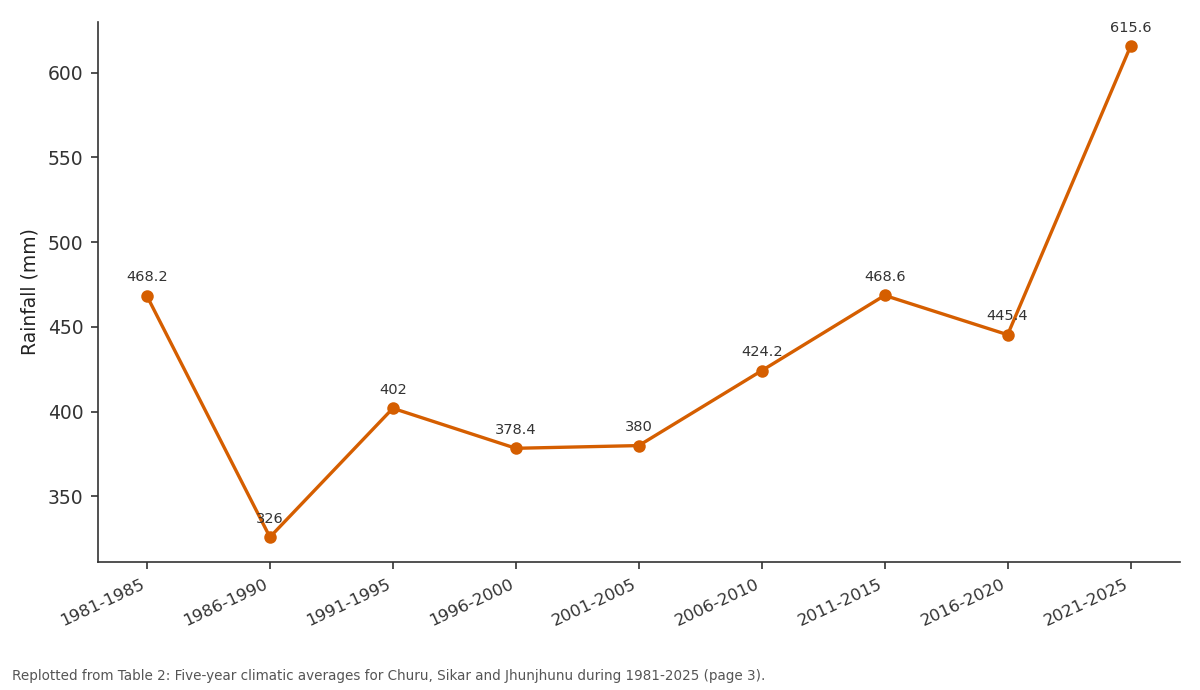
Rainfall (mm): 1981-1985 vs 1986-1990 vs 1991-1995 vs 1996-2000 vs 2001-2005
Replotted from Table 2 (page 3) of the original paper. Every bar is the paper's own table value.
View source evidence ↗Figures & tables
From the original paper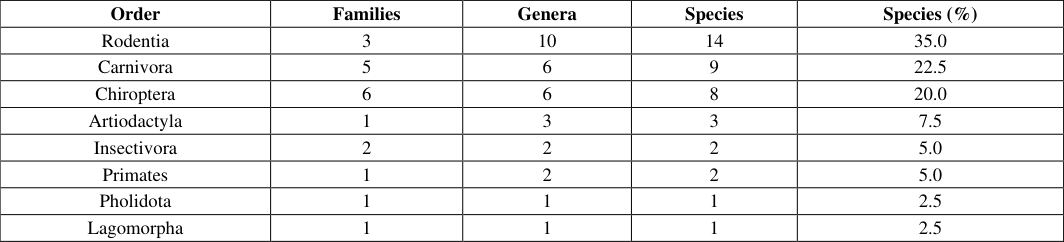 Table 1
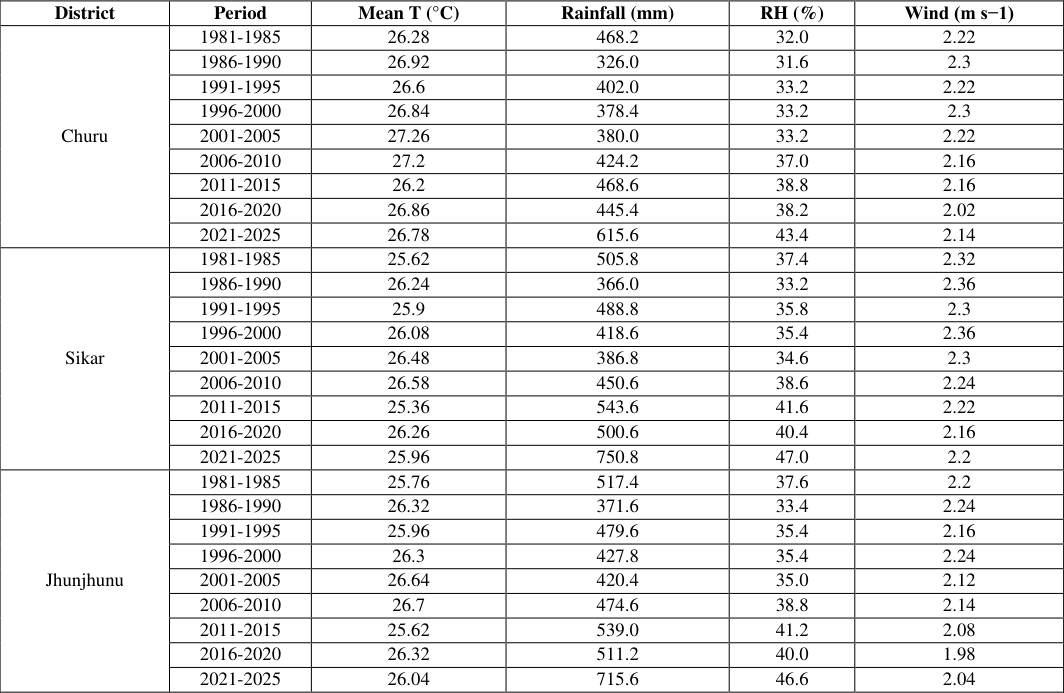 Table 2
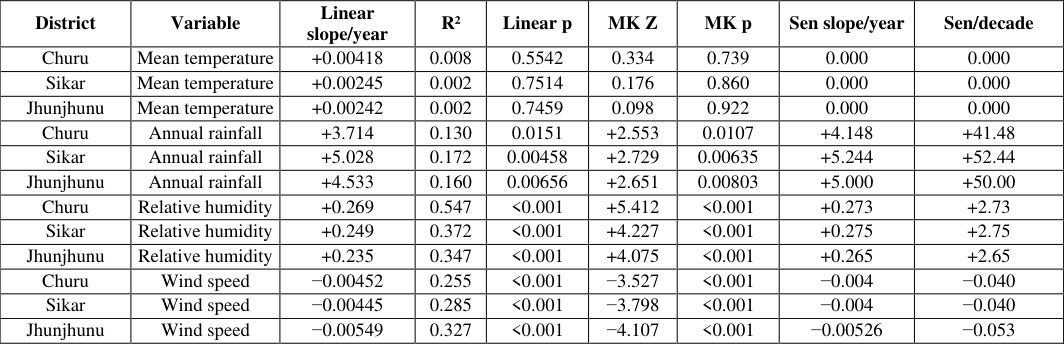 Table 3
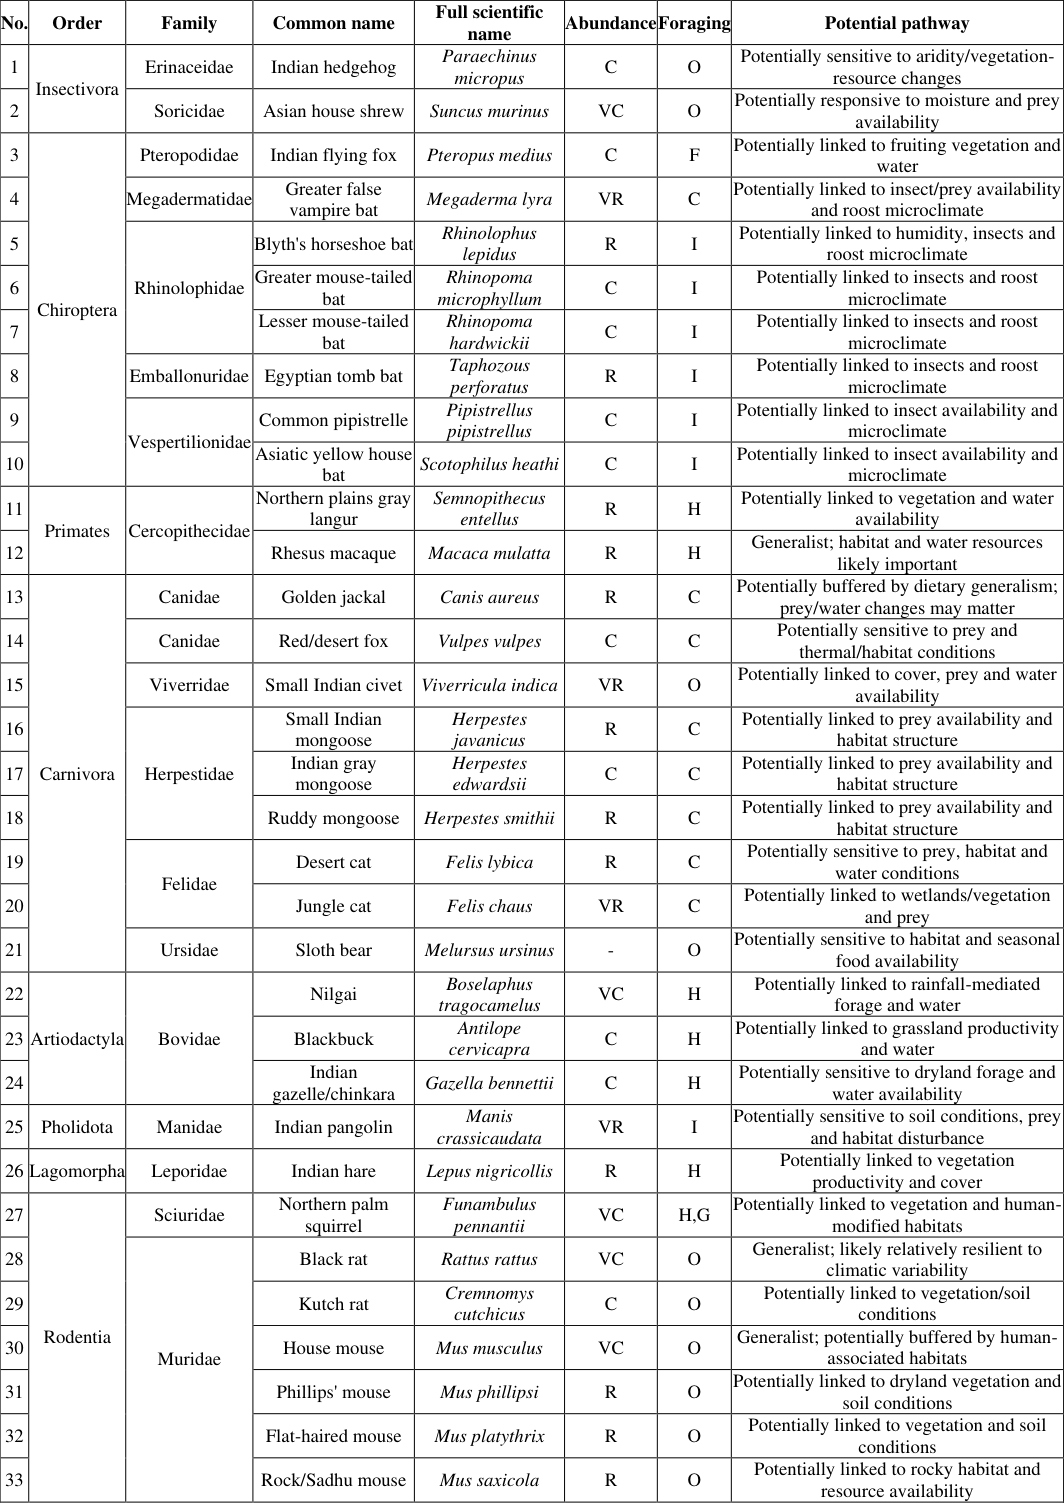 Table 4
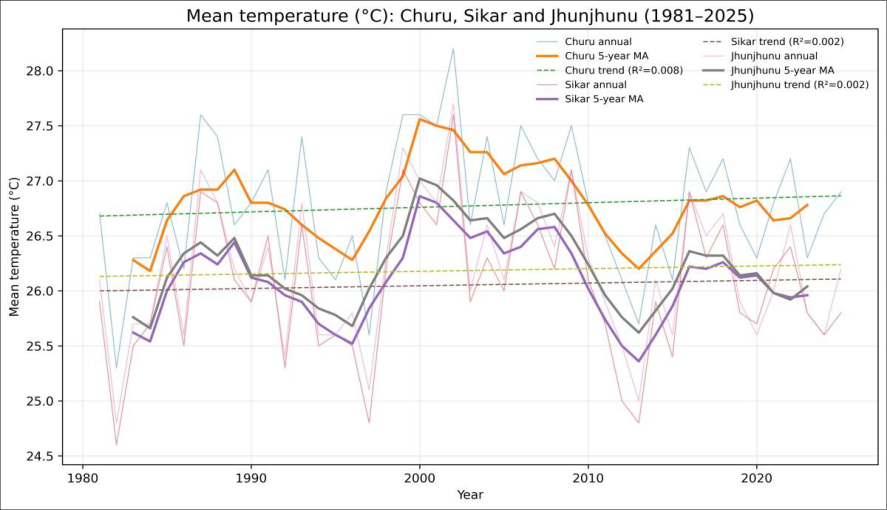 Figure 1
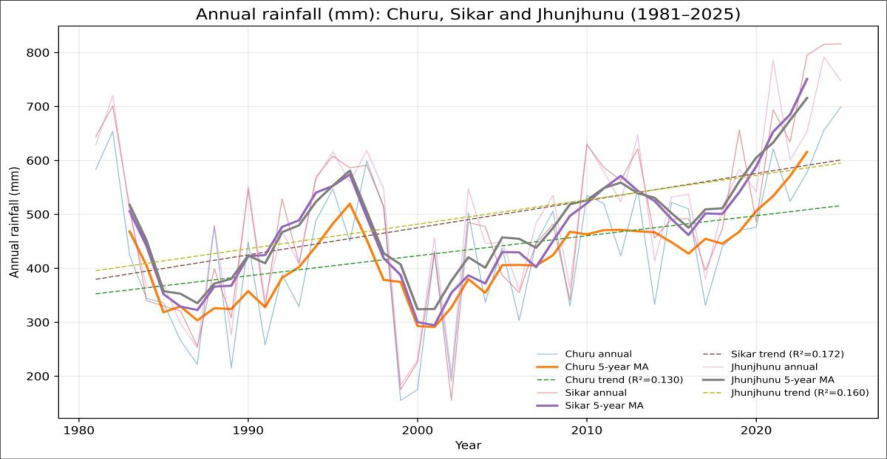 Figure 2
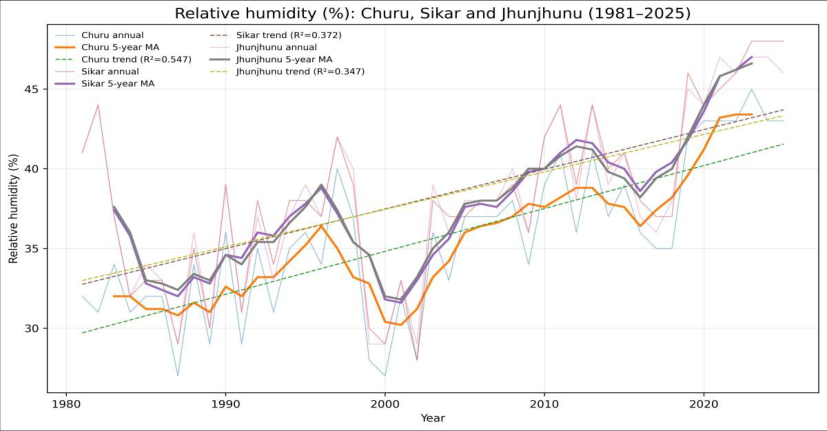 Figure 3
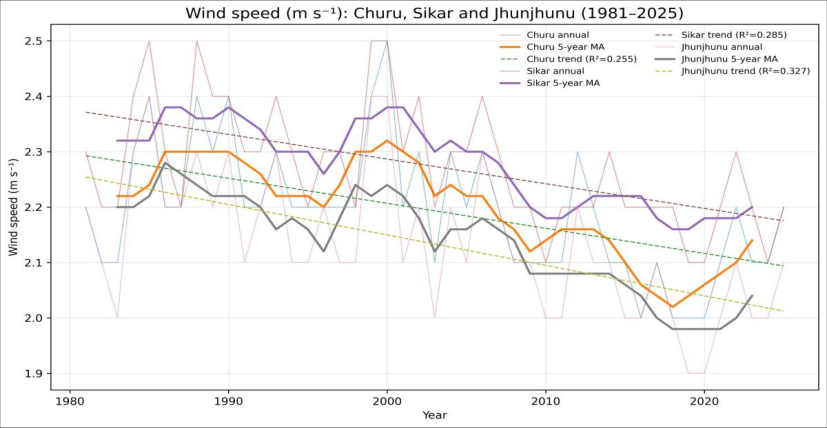 Figure 4
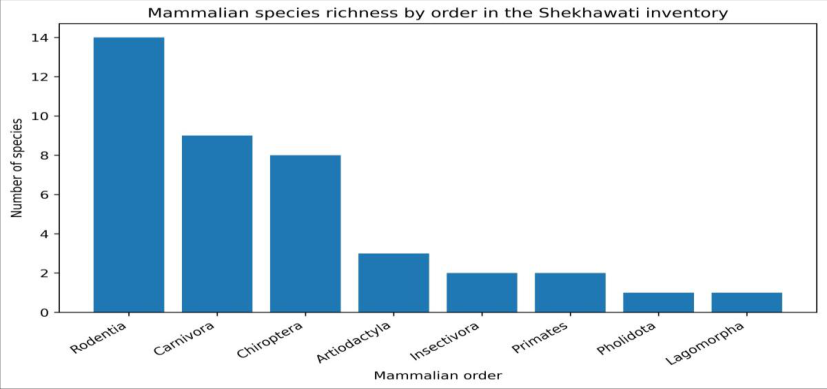 Figure 5
Introduction
Climate variability is a major factor of ecological structure and function. It plays a key determining role in drylands where water availability constrains primary productivity and propagates through food webs. Climate change can affect organisms through physiological stress, shifts in resource availability, habitat suitability, phenology, distribution and ecological interactions (Bellard et al., 2012; IPCC, 2022) [1,8] . Broad-scale assessments have documented coherent climate-associated changes in species distributions and biological timing. It also emphasized that local responses are mediated by land use, habitat condition and other anthropogenic pressures (Parmesan and Yohe, 2003) [19] . Arid and semi-arid ecosystems are subtle to changes in rainfall amount, timing and atmospheric moisture. Rainfall influences soil moisture, vegetation productivity, surfacewater availability and prey resources, potentially affecting herbivores and predators. Rajasthan has climatic variability significantly across space and through time. Earlier studies have reported significant spatial heterogeneity in temperature and precipitation trends across Rajasthan (Sharma et al., 2021; Porwal & Choudhary, 2023) [26,20] . Shekhawati area is comprised of Churu, Sikar and Jhunjhunu districts. It contains sandy and desertic landscapes, agricultural plains, scrub, grassland, settlements and localized foothill habitats. Previous studies have reported that irrigation, agriculture, mining, urbanization, transportation and habitat degradation as important pressures on animal biodiversity (Dev and Singh, 2016) [4] . The present study addresses this gap by linking the mammalian assemblage with long-term climatic variability. The objectives of the present study were to enumerate 1981-2025 trends in mean temperature, rainfall, relative humidity and wind speed. The five-year climatic variability and evaluation of monotonic trends is also carried out. It also undertaken to study the mammalian biodiversity and feeding composition.
Study area
The Shekhawati region is in northeastern Rajasthan and forms part of the broader arid and semi-arid landscape associated with the Thar Desert. The supplied faunal study describes the region as extending approximately from 27°24′ to 29°02′ N and 73°04′ to 76°05′ E, covering about 27,529.44 km². The region has strong seasonal contrasts, with hot summers and relatively cool winters, and includes extensive sandy areas and dunes in the north-western sector. Agricultural expansion, irrigation, mining, roads and urbanization have modified habitats across the region.
Materials and methods
In the present study, the annual climatic observations for Churu, Sikar and Jhunjhunu (1981-2025) were carried out. Four climatic variables were analyzed such as annual mean temperature (°C), annual rainfall (mm), relative humidity (%) and mean wind speed (m s-1). Long-term meteorological data for the Shekhawati region were obtained from the India Meteorological Department (IMD), Pune. Annual observations were summarized into nine fiveyear periods (1981-1985 through 2021-2025), and centred five-year moving averages were calculated. Linear regression was fitted with year as the predictor. Slope, R² and p-value were reported. Mann-Kendall (MK) statistics were calculated using the sign of all pairwise temporal differences, with tie correction in the variance. Sen's slope was estimated as the median of all pairwise slopes. A twosided p<0.05 criterion was used for statistical significance. Mammalian diversity analysis was carried out through surveys to document the presence and abundance of key species, using techniques such as transect walks, quadrat sampling, and camera trapping.
Results
Mean temperature varied substantially among years, but linear trends were not significant. Slopes were +0.00418 °C year-1 for Churu (R²=0.008, p=0.554), +0.00245 °C year-1 for Sikar (R²=0.002, p=0.751), and +0.00242 °C year-1 for Jhunjhunu (R²=0.002, p=0.746). Mann-Kendall tests were also non-significant. Thus, the available annual meantemperature series does not support a statistically significant monotonic warming trend over 1981-2025. Rainfall increased significantly in all three districts. Linear slopes were 3.714 mm year-1 in Churu (R²=0.130, p=0.015), 5.028 mm year-1 in Sikar (R²=0.172, p=0.005), and 4.533 mm year-1 in Jhunjhunu (R²=0.160, p=0.007). Mann-Kendall tests were significant in Churu (Z=2.553, p=0.011), Sikar (Z=2.729, p=0.006) and Jhunjhunu (Z=2.651, p=0.008). Sen's slopes were 4.148, 5.244and 5.000-mm year-1, respectively. Relative humidity increased significantly in all districts. Linear slopes were +0.269, +0.249 and +0.235 percentage points year-1 for Churu, Sikar and Jhunjhunu, respectively (all p<0.001). Mann-Kendall Z values were 5.412, 4.227 and 4.075, respectively, with p<0.001 in all cases. Sen's slopes were +0.273, +0.275 and +0.265 percentage points year-1. Wind speed showed significant declines in all districts. Linear slopes were -0.00452 m s-1 year-1 in Churu, -0.00445 m s-1 year-1 in Sikar and -0.00549 m s-1 year-1 in Jhunjhunu (all p<0.001). Mann-Kendall Z values were -3.527, -3.798 and -4.107, respectively. Sen's slopes were approximately -0.00400, -0.00400 and -0.00526 m s-1 year-1. The 2021-2025 period had the highest rainfall among the nine five-year periods in each district: 615.6 mm in Churu, 750.8 mm in Sikar and 715.6 mm in Jhunjhunu. The same period also had the highest five-year relative humidity averages: 43.4%, 47.0% and 46.6%, respectively. In the present investigation, mammalian diversity contained 40 species, 8 orders, 20 families and 31 genera. Rodentia was the richest order with 14 species, followed by Carnivora with 9 species, and Chiroptera with 8 species. Artiodactyla contributed 3 species. Insectivora and Primates each contributed 2 species. Pholidota and Lagomorpha each contributed one species.
Discussion
The principal climatic signal in the Shekhawati dataset is a shift in hydroclimatic conditions rather than a statistically significant increase in annual mean temperature. Rainfall and relative humidity increased significantly across all three districts. The wind speed declined across all three districts. Earlier studies on Rajasthan climatic reported substantial heterogeneity among climatic variables and locations (Sharma et al., 2021; Porwal and Choudhary, 2023) [26,20] . The rainfall increase may alter water availability and dryland primary productivity. The improved rainfall can increase forage and seed resources and thereby influence herbivorous and granivorous mammals. However, the ecological outcome depends on rainfall timing, runoff, soil retention, agricultural land use and habitat connectivity. Increased rainfall therefore cannot be equated automatically with improved mammalian habitat quality. The strong increase in relative humidity may influence evaporative demand and local microclimatic conditions. Such changes could be relevant to bats and small mammals, particularly through insect abundance, roost conditions and water availability. Nevertheless, the present study did not measure bat activity, insect abundance or microclimate and therefore does not demonstrate these mechanisms. The decline in mean wind speed is another important environmental signal. Wind affects evapotranspiration, aeolian transport and surface conditions in sandy environments. A decline in annual mean wind speed may therefore alter some local habitat processes. The mammalian diversity was dominated by rodents, carnivores and bats. These groups potentially respond to climatic variability through different pathways. Herbivores may respond primarily through vegetation and water resources. The rodents may respond through seed availability, soil conditions and vegetation cover. The carnivores may respond indirectly through prey and water; and insectivorous bats may respond through insect resources and roost microclimate. These pathways are consistent with the broader understanding that climate can affect biodiversity through resource and habitat mechanisms (Bellard et al., 2012) [1] . The presence of species with different ecological strategies suggests that climate variability is unlikely to produce a uniform response across the assemblage. Generalist species associated with humanmodified habitats may be relatively buffered. The desertadapted or habitat-specialist species may be more dependent on combinations of vegetation, soil and water conditions. There should be an integrated climate-wildlife monitoring and conservation programme across Churu, Sikar and Jhunjhunu.
Acknowledgement
International Journal of Biology Sciences https://www.biologyjournal.net
Figures and tables from the paper
| Order | Families | Genera | Species | Species (%) |
|---|---|---|---|---|
| Rodentia | 3 | 10 | 14 | 35.0 |
| Carnivora | 5 | 6 | 9 | 22.5 |
| Chiroptera | 6 | 6 | 8 | 20.0 |
| Artiodactyla | 1 | 3 | 3 | 7.5 |
| Insectivora | 2 | 2 | 2 | 5.0 |
| Primates | 1 | 2 | 2 | 5.0 |
| Pholidota | 1 | 1 | 1 | 2.5 |
| Lagomorpha | 1 | 1 | 1 | 2.5 |
Table text extracted from the original PDF; superscript letters are shown inline. The original table image is below.
View original table image
| District | Period | Mean T (°C) | Rainfall (mm) | RH (%) | Wind (m s−1) |
|---|---|---|---|---|---|
| Churu | 1981-1985 | 26.28 | 468.2 | 32.0 | 2.22 |
| 1986-1990 | 26.92 | 326.0 | 31.6 | 2.3 | |
| 1991-1995 | 26.6 | 402.0 | 33.2 | 2.22 | |
| 1996-2000 | 26.84 | 378.4 | 33.2 | 2.3 | |
| 2001-2005 | 27.26 | 380.0 | 33.2 | 2.22 | |
| 2006-2010 | 27.2 | 424.2 | 37.0 | 2.16 | |
| 2011-2015 | 26.2 | 468.6 | 38.8 | 2.16 | |
| 2016-2020 | 26.86 | 445.4 | 38.2 | 2.02 | |
| 2021-2025 | 26.78 | 615.6 | 43.4 | 2.14 | |
| Sikar | 1981-1985 | 25.62 | 505.8 | 37.4 | 2.32 |
| 1986-1990 | 26.24 | 366.0 | 33.2 | 2.36 | |
| 1991-1995 | 25.9 | 488.8 | 35.8 | 2.3 | |
| 1996-2000 | 26.08 | 418.6 | 35.4 | 2.36 | |
| 2001-2005 | 26.48 | 386.8 | 34.6 | 2.3 | |
| 2006-2010 | 26.58 | 450.6 | 38.6 | 2.24 | |
| 2011-2015 | 25.36 | 543.6 | 41.6 | 2.22 | |
| 2016-2020 | 26.26 | 500.6 | 40.4 | 2.16 | |
| 2021-2025 | 25.96 | 750.8 | 47.0 | 2.2 | |
| Jhunjhunu | 1981-1985 | 25.76 | 517.4 | 37.6 | 2.2 |
| 1986-1990 | 26.32 | 371.6 | 33.4 | 2.24 | |
| 1991-1995 | 25.96 | 479.6 | 35.4 | 2.16 | |
| 1996-2000 | 26.3 | 427.8 | 35.4 | 2.24 | |
| 2001-2005 | 26.64 | 420.4 | 35.0 | 2.12 | |
| 2006-2010 | 26.7 | 474.6 | 38.8 | 2.14 | |
| 2011-2015 | 25.62 | 539.0 | 41.2 | 2.08 | |
| 2016-2020 | 26.32 | 511.2 | 40.0 | 1.98 | |
| 2021-2025 | 26.04 | 715.6 | 46.6 | 2.04 |
Table text extracted from the original PDF; superscript letters are shown inline. The original table image is below.
View original table image
| District | Variable | Linear slope/year | R² | Linear p | MK Z | MK p | Sen slope/year | Sen/decade |
|---|---|---|---|---|---|---|---|---|
| Churu | Mean temperature | +0.00418 | 0.008 | 0.5542 | 0.334 | 0.739 | 0.000 | 0.000 |
| Sikar | Mean temperature | +0.00245 | 0.002 | 0.7514 | 0.176 | 0.860 | 0.000 | 0.000 |
| Jhunjhunu | Mean temperature | +0.00242 | 0.002 | 0.7459 | 0.098 | 0.922 | 0.000 | 0.000 |
| Churu | Annual rainfall | +3.714 | 0.130 | 0.0151 | +2.553 | 0.0107 | +4.148 | +41.48 |
| Sikar | Annual rainfall | +5.028 | 0.172 | 0.00458 | +2.729 | 0.00635 | +5.244 | +52.44 |
| Jhunjhunu | Annual rainfall | +4.533 | 0.160 | 0.00656 | +2.651 | 0.00803 | +5.000 | +50.00 |
| Churu | Relative humidity | +0.269 | 0.547 | <0.001 | +5.412 | <0.001 | +0.273 | +2.73 |
| Sikar | Relative humidity | +0.249 | 0.372 | <0.001 | +4.227 | <0.001 | +0.275 | +2.75 |
| Jhunjhunu | Relative humidity | +0.235 | 0.347 | <0.001 | +4.075 | <0.001 | +0.265 | +2.65 |
| Churu | Wind speed | −0.00452 | 0.255 | <0.001 | −3.527 | <0.001 | −0.004 | −0.040 |
| Sikar | Wind speed | −0.00445 | 0.285 | <0.001 | −3.798 | <0.001 | −0.004 | −0.040 |
| Jhunjhunu | Wind speed | −0.00549 | 0.327 | <0.001 | −4.107 | <0.001 | −0.00526 | −0.053 |
Table text extracted from the original PDF; superscript letters are shown inline. The original table image is below.
View original table image
| No. | Order | Family | Common name | Full scientific name | Abundance | Foraging | Potential pathway |
|---|---|---|---|---|---|---|---|
| 1 | Insectivora | Erinaceidae | Indian hedgehog | Paraechinus micropus | C | O | Potentially sensitive to aridity/vegetation- resource changes |
| 2 | Soricidae | Asian house shrew | Suncus murinus | VC | O | Potentially responsive to moisture and prey availability | |
| 3 | Chiroptera | Pteropodidae | Indian flying fox | Pteropus medius | C | F | Potentially linked to fruiting vegetation and water |
| 4 | Megadermatidae | Greater false vampire bat | Megaderma lyra | VR | C | Potentially linked to insect/prey availability and roost microclimate | |
| 5 | Rhinolophidae | Blyth's horseshoe bat | Rhinolophus lepidus | R | I | Potentially linked to humidity, insects and roost microclimate | |
| 6 | Greater mouse-tailed bat | Rhinopoma microphyllum | C | I | Potentially linked to insects and roost microclimate | ||
| 7 | Lesser mouse-tailed bat | Rhinopoma hardwickii | C | I | Potentially linked to insects and roost microclimate | ||
| 8 | Emballonuridae | Egyptian tomb bat | Taphozous perforatus | R | I | Potentially linked to insects and roost microclimate | |
| 9 | Vespertilionidae | Common pipistrelle | Pipistrellus pipistrellus | C | I | Potentially linked to insect availability and microclimate | |
| 10 | Asiatic yellow house bat | Scotophilus heathi | C | I | Potentially linked to insect availability and microclimate | ||
| 11 | Primates | Cercopithecidae | Northern plains gray langur | Semnopithecus entellus | R | H | Potentially linked to vegetation and water availability |
| 12 | Rhesus macaque | Macaca mulatta | R | H | Generalist; habitat and water resources likely important | ||
| 13 | Carnivora | Canidae | Golden jackal | Canis aureus | R | C | Potentially buffered by dietary generalism; prey/water changes may matter |
| 14 | Canidae | Red/desert fox | Vulpes vulpes | C | C | Potentially sensitive to prey and thermal/habitat conditions | |
| 15 | Viverridae | Small Indian civet | Viverricula indica | VR | O | Potentially linked to cover, prey and water availability | |
| 16 | Herpestidae | Small Indian mongoose | Herpestes javanicus | R | C | Potentially linked to prey availability and habitat structure | |
| 17 | Indian gray mongoose | Herpestes edwardsii | C | C | Potentially linked to prey availability and habitat structure | ||
| 18 | Ruddy mongoose | Herpestes smithii | R | C | Potentially linked to prey availability and habitat structure | ||
| 19 | Felidae | Desert cat | Felis lybica | R | C | Potentially sensitive to prey, habitat and water conditions | |
| 20 | Jungle cat | Felis chaus | VR | C | Potentially linked to wetlands/vegetation and prey | ||
| 21 | Ursidae | Sloth bear | Melursus ursinus | - | O | Potentially sensitive to habitat and seasonal food availability | |
| 22 | Artiodactyla | Bovidae | Nilgai | Boselaphus tragocamelus | VC | H | Potentially linked to rainfall-mediated forage and water |
| 23 | Blackbuck | Antilope cervicapra | C | H | Potentially linked to grassland productivity and water | ||
| 24 | Indian gazelle/chinkara | Gazella bennettii | C | H | Potentially sensitive to dryland forage and water availability | ||
| 25 | Pholidota | Manidae | Indian pangolin | Manis crassicaudata | VR | I | Potentially sensitive to soil conditions, prey and habitat disturbance |
| 26 | Lagomorpha | Leporidae | Indian hare | Lepus nigricollis | R | H | Potentially linked to vegetation productivity and cover |
| 27 | Rodentia | Sciuridae | Northern palm squirrel | Funambulus pennantii | VC | H,G | Potentially linked to vegetation and human- modified habitats |
| 28 | Muridae | Black rat | Rattus rattus | VC | O | Generalist; likely relatively resilient to climatic variability | |
| 29 | Kutch rat | Cremnomys cutchicus | C | O | Potentially linked to vegetation/soil conditions | ||
| 30 | House mouse | Mus musculus | VC | O | Generalist; potentially buffered by human- associated habitats | ||
| 31 | Phillips' mouse | Mus phillipsi | R | O | Potentially linked to dryland vegetation and soil conditions | ||
| 32 | Flat-haired mouse | Mus platythrix | R | O | Potentially linked to vegetation and soil conditions | ||
| 33 | Rock/Sadhu mouse | Mus saxicola | R | O | Potentially linked to rocky habitat and resource availability |
Table text extracted from the original PDF; superscript letters are shown inline. The original table image is below.
View original table image
References
33 in the original paper- Bellard C, Bertelsmeier C, Leadley P, Thuiller W, Courchamp F. Impacts of climate change on the future of biodiversity. Ecol Lett. 2012;15:365-377.
- Beyer RM, Manica A. Historical and projected future range sizes of the world's mammals, birds, and amphibians. Nat Commun. 2020;11:5633.
- Briscoe NJ, Morris SD, Mathewson PD, Buckley LB, Jusup M, Levy O, Maclean IMD, Pincebourde S, Riddell EA, Roberts JA, Schouten R, Sears MW, Kearney MR. Mechanistic forecasts of species responses to climate change: The promise of biophysical ecology. Glob Change Biol. 2023;29:29792995.
- Dev K, Singh P. Mammalian diversity of Shekhawati region in arid zone of Thar Desert, India. Int J Fauna Biol Stud. 2016;3(5):16-22.
- Fuller A, Mitchell D, Maloney SK. The physiological challenge of climate change for free-living terrestrial mammals. Annu Rev Physiol. 2026;88:1-20.
- IPBES. Global assessment report on biodiversity and ecosystem services. Bonn: IPBES Secretariat; 2019.
- IPCC. Climate change 2022: Impacts, adaptation and vulnerability. Cambridge: Cambridge University Press; 2022.
- IPCC. Climate change 2023: Synthesis report. Geneva: Intergovernmental Panel on Climate Change; 2023.
- Krishnan R, Sanjay J, Gnanaseelan C, Mujumdar M, Kulkarni A, Chakraborty S, editors. Assessment of climate change over the Indian region: A report of the Ministry of Earth Sciences (MoES), Government of India. Cham: Springer; 2020.
- Lamba A, Zeng Y, Sreekar R, Rege A, Teo HC, Koh LP. Anchoring India's umbrella species to biodiversity and climate gains. Conserv Lett. 2026;19(3):e70059.
- Leclerc C, Courchamp F, Bellard C. Future climate change vulnerability of endemic island mammals. Nat Commun. 2020;11:4943.
- Mitchell D, Snelling EP, Hetem RS, Maloney SK, Strauss WM, Fuller A. Revisiting concepts of thermal physiology: Predicting responses of mammals to climate change. J Anim Ecol. 2018;87(4):956-973.
- National Tiger Conservation Authority, Wildlife Institute of India. Status of tigers, co-predators and prey in India, 2018. New Delhi: Government of India; 2019.
- National Tiger Conservation Authority, Wildlife Institute of India. Status of tigers, co-predators and prey in India, 2022. New Delhi: Government of India; 2023.
- Pacifici M, Foden WB, Watson JEM, Butchart SHM, Kovacs KM, Scheffers BR, Hole DG, Rondinini C. A framework for the identification of hotspots of climate change risk for mammals. Glob Change Biol. 2017;23:2492-2501.
- Pacifici M, Rondinini C, Rhodes JR, Burbidge AA, Cristiano A, Watson JEM, Woinarski JCZ, Di Marco M. Global correlates of range contractions and expansions in terrestrial mammals. Nat Commun. 2020;11:2840.
- Pacifici M, Visconti P, Butchart SHM, Watson JEM, Cassola FM, Rondinini C. Species' traits influenced their response to recent climate change. Nat Clim Change. 2017;7:205-208.
- Parmesan C, Yohe G. A globally coherent fingerprint of climate change impacts across natural systems. Nature. 2003;421:37-42.
- Porwal V, Choudhary MP. Investigating variations and trend analysis for temperature and precipitation as a result of climate change in Rajasthan, India. J Clim Change. 2023;9(3):33-40.
- Rajasthan State Biodiversity Board. Biodiversity of Rajasthan. Government of Rajasthan; 2026.
- Rajasthan State Biodiversity Board. Threatened species of Rajasthan. Government of Rajasthan; 2026.
- Rawat M, Dookia S. Climate change and anthropogenic pressures on the Great Indian Bustard's habitats in the Thar Desert of Rajasthan, India. Biol Forum Int J. 2025;17(12):31-38.
- Santini L, Cornulier T, Bullock JM, Palmer SCF, White SM, Hodgson JA, Bocedi G, Travis JMJ. A trait-based approach for predicting species responses to environmental change from sparse data: How well might terrestrial mammals track climate change? Glob Change Biol. 2016;22(7):2415-2424.
- Scheffers BR, De Meester L, Bridge TCL, Hoffmann AA, Pandolfi JM, Corlett RT, Butchart SHM, PearceKelly P, Kovacs KM, Dudgeon D, et al. The broad footprint of climate change from genes to biomes to people. Science. 2016;354(6313).
- Sharma SK, Sharma DP, Sharma MK, Gaur K, Manohar P. Trend analysis of temperature and rainfall of Rajasthan, India. J Probab Stat. 2021;2021:6296709. doi:10.1155/2021/6296709.
- Singh AP, Sharma LK, et al. Dryland refuge at risk: Climate and land-use change impacting habitat of chinkara on the Indian subcontinent. J Wildl Manage. 2026.
- Snook RR, Bretman A, Dougherty LR, Fricke C, et al. The consequences of rising temperatures for animal fertility. Nat Rev Biodivers. 2026;2:225-241.
- Theodoridis S, Fordham DA, Brown SC, Li S, Rahbek C, Nogués-Bravo D. Evolutionary history and past climate change shape the distribution of genetic diversity in terrestrial mammals. Nat Commun. 2020;11:2557.
- Urban MC, Bocedi G, Hendry AP, Mihoub JB, Pe'er G, Singer A, Bridle JR, Crozier LG, De Meester L, Godsoe W, et al. Improving the forecast for biodiversity under climate change. Science. 2016;353(6304):aad8466.
- Wildlife Institute of India. Status of tigers, co-predators and prey in India, 2022. New Delhi: National Tiger Conservation Authority & Wildlife Institute of India; 2023.
- Williams JW, Ordonez A, Svenning JC. A unifying framework for studying and managing climate-driven change in biodiversity. Nat Clim Change. 2021;11:259270.
- WWF. Living Planet Report 2024: A system in peril. Gland: World Wide Fund for Nature; 2024.
- Zubair AA. Marine mammals of the Indian Ocean: Diversity, distribution and climate change vulnerability: A review. Uttar Pradesh J Zool. 2026;47(1):193-209.