
Research article · 2026 · Full text
International Journal of Geography Geology and EnvironmentClimate-driven phenological restructuring and biodiversity conservation of tropical tree species in Balod district, Chhattisgarh, India
Volume 8(8) · Pages 44–53 · DOI: 10.22271/27067483.2026.v8.i8a.848 ↗
Research areasBotany and Plant Ecology StudiesForest Ecology and ConservationEcology and Vegetation Dynamics Studies
Abstract
Author-writtenThe effects of climate change on tropical forests are a pressing phenological concern, the consequences of climate change on the dry deciduous forest tree communities of central India are not well understood. This study assesses the phenological variations and patterns of biodiversity conservation in the light of climate change across five administrative blocks of Balod District, Chhattisgarh, India in 54 species of trees belonging to 31 families. We combined quadrat-based phytosociological features with the long-term monitoring of the seasons to evaluate the effects of climatic variability on leaf flushing, senescence, flowering and fruiting patterns.The phytosociological indicators show high dominance of core deciduous taxa and for some forest stands the highest IVI is obtained for Terminalia tomentosa. Dominant canopy trees are highly sensitive to climate change as shown by phenological regression modeling. The advance in flowering onset was very high at 7-21 days due to warmer pre-monsoon temperature and irregular winter chilling. The multivariate analyses prove the strong influence of temperature anomalies together with irregularity of rainfall and length of dry seasons, explaining 64.8% of all phenological variability. Species with specialised or narrow reproductive window, like Shorea robusta and Semecarpus anacardium suffer from acute functional vulnerability as a result of decreasing recruitment potential and increasing trophic mismatches. From a spatial perspective, the Dondi Lohara Dondi blocks were determined as hotspots of biodiversity and ecosystem services. In response to these challenges, we propose the Climate-Phenology-Conservation Framework (CPCF): a management model that combines empirical baseline ecology with site-specific and community forestry plans to maintain the structural continuity of central Indian forests under a changing climate.
Summary
Source-checkedPlain-language reading of the full paper, prepared with AI and checked against the text. Each point links to the authors' own words.
Why it matters
- Tropical Dry Deciduous Forests (TDDFs) are ecologically critical but threatened biomes, making up approximately 40-45% of India's tropical forest cover. View evidence ↗
- Indigenous communities, such as the Gond, Baiga, and Oraon tribes, depend heavily on these forests for medicinal plants and non-timber forest products (NTFPs) for their survival. View evidence ↗
- Recent trends in Chhattisgarh indicate increasing land surface temperatures, changing rainfall patterns, and a continuous decrease in soil moisture. View evidence ↗
The question
- The study aims to integrate the assessment of phytosociological structure, climate variability, and phenological sensitivity within the tropical dry deciduous forests of the Balod District. View evidence ↗
What they did
- Researchers established 150 permanent structural plots (50m x 50m), with 30 quadrats distributed across each of the five administrative blocks. View evidence ↗
- Four phenological phases, leaf senescence, vegetative bud break/flushing, flowering onset, and fruit maturation, were monitored twice weekly from June to December 2025. View evidence ↗
- Climate data was sourced from the ECMWF ERA5-Land gridded dataset at a spatial resolution of 0.1° x 0.1°. View evidence ↗
What they found
- Terminalia tomentosa was identified as the primary canopy-dominant species with the highest Importance Value Index (IVI) of 39.1. View evidence ↗
- On average, leaf flushing advanced by 12.8 days and flowering advanced by 17.4 days relative to historical baselines. View evidence ↗
- Shorea robusta was the most climate-sensitive species (PSI=0.89), followed by Semecarpus anacardium (PSI=0.86). View evidence ↗
- The Dondi Lohara and Dondi forest blocks were identified as the primary regional biodiversity reservoirs. View evidence ↗
- Madhuca longifolia is at critical risk, with potential complete collapse of traditional flower harvesting timelines due to high ecological vulnerability and very high socio-economic dependency. View evidence ↗
What it means
- The authors propose the Climate-Phenology-Conservation Framework (CPCF) to combine empirical ecology with community forestry plans to maintain forest structural continuity. View evidence ↗
- The authors conclude that integrating climate information into biodiversity conservation planning is essential for ecosystem stability and sustainable livelihoods. View evidence ↗
Visual summary
3 visualsIllustrations explain the paper; charts are replotted from the paper's own table values.
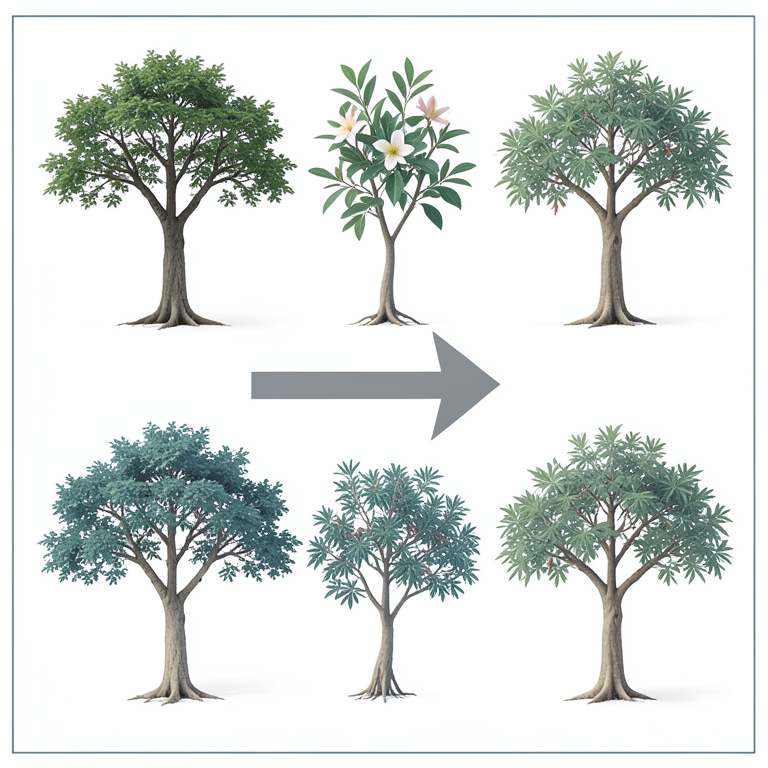
Phenological Shift Timeline
AI-generated conceptual illustration (Tropical tree species in Balod district, Chhattisgarh, India). It explains the idea and does not show study data.
View source evidence ↗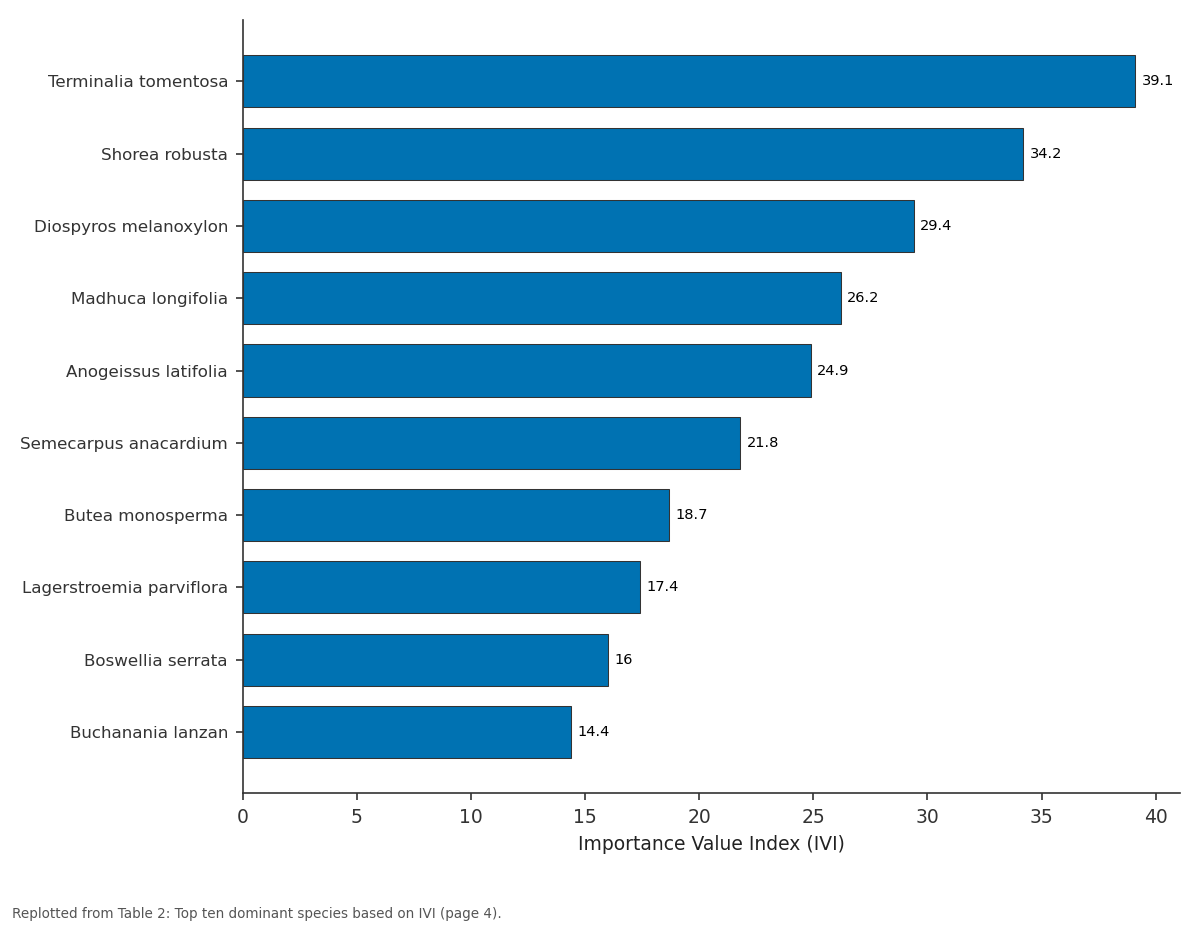
Importance Value Index (IVI): Terminalia tomentosa vs Shorea robusta vs Diospyros melanoxylon vs Madhuca longifolia vs Anogeissus latifolia
Replotted from Table 2 (page 4) of the original paper. Every bar is the paper's own table value.
View source evidence ↗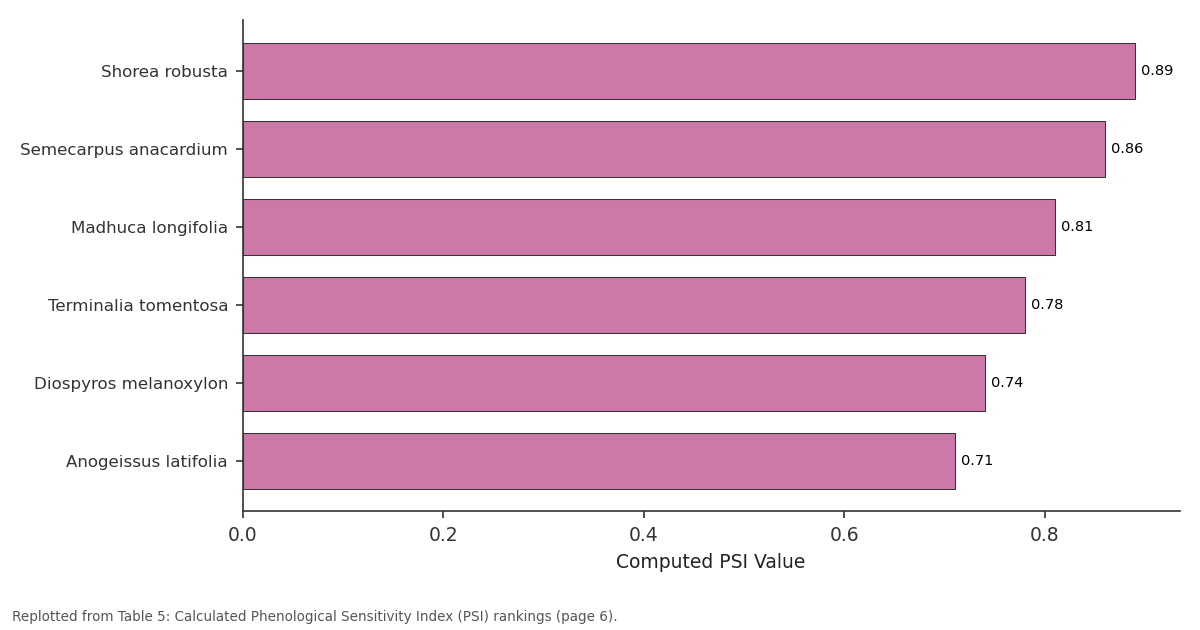
Computed PSI Value: Shorea robusta vs Semecarpus anacardium vs Madhuca longifolia vs Terminalia tomentosa vs Diospyros melanoxylon
Replotted from Table 5 (page 6) of the original paper. Every bar is the paper's own table value.
View source evidence ↗Figures & tables
From the original paper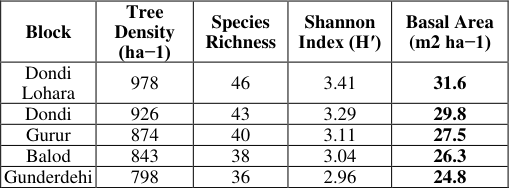 Table 1
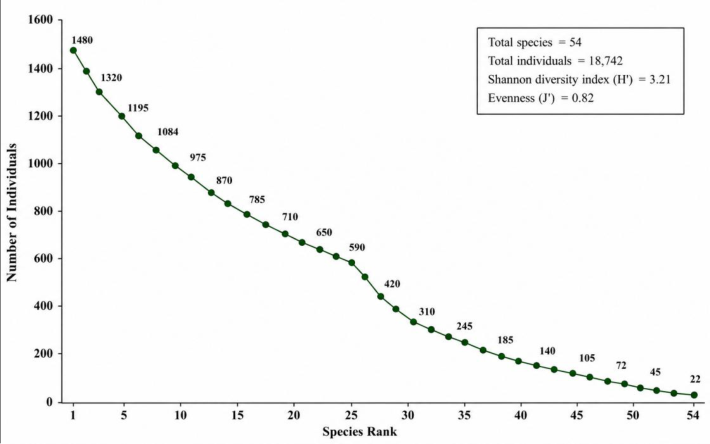 Figure 1
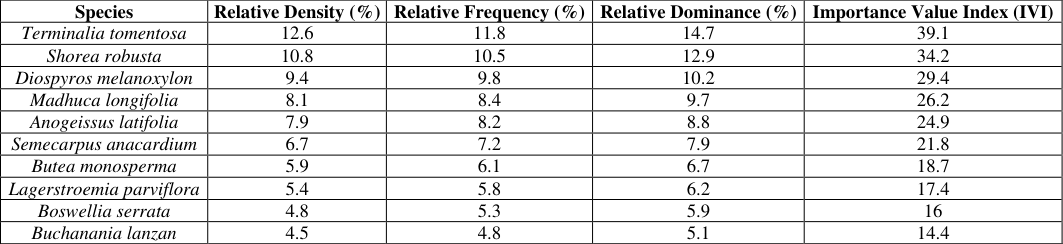 Table 2
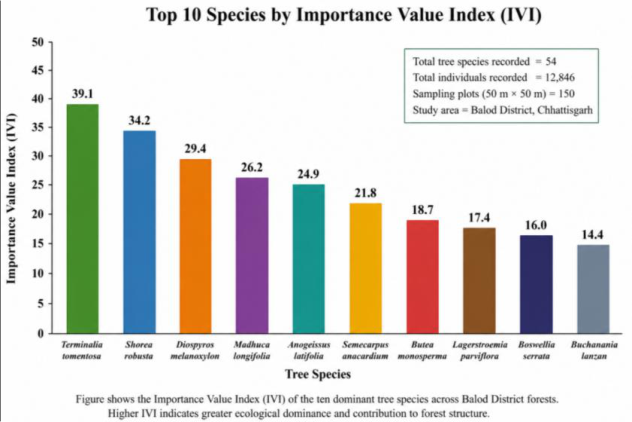 Figure 2
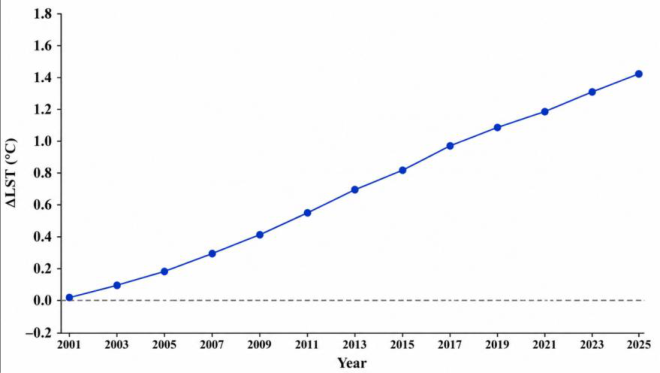 Figure 3
 Table 3
 Table 4
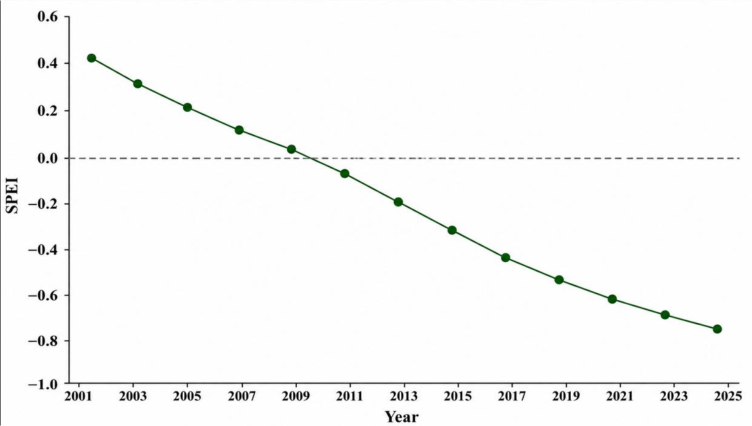 Figure 4
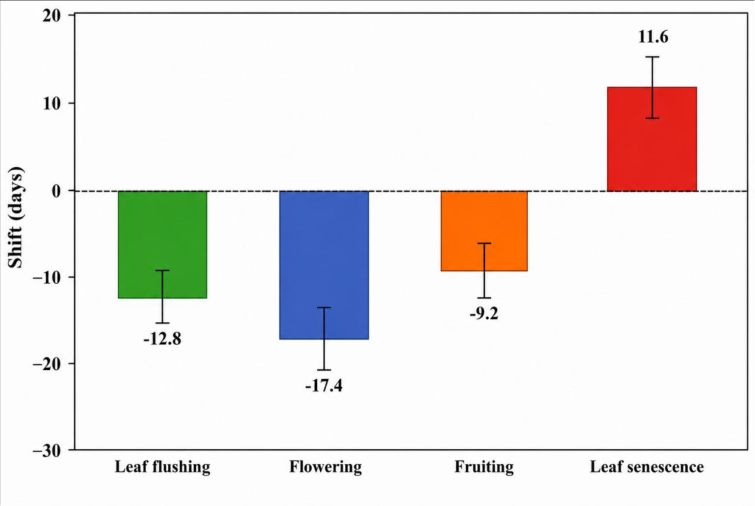 Figure 5
 Table 5
 Table 6
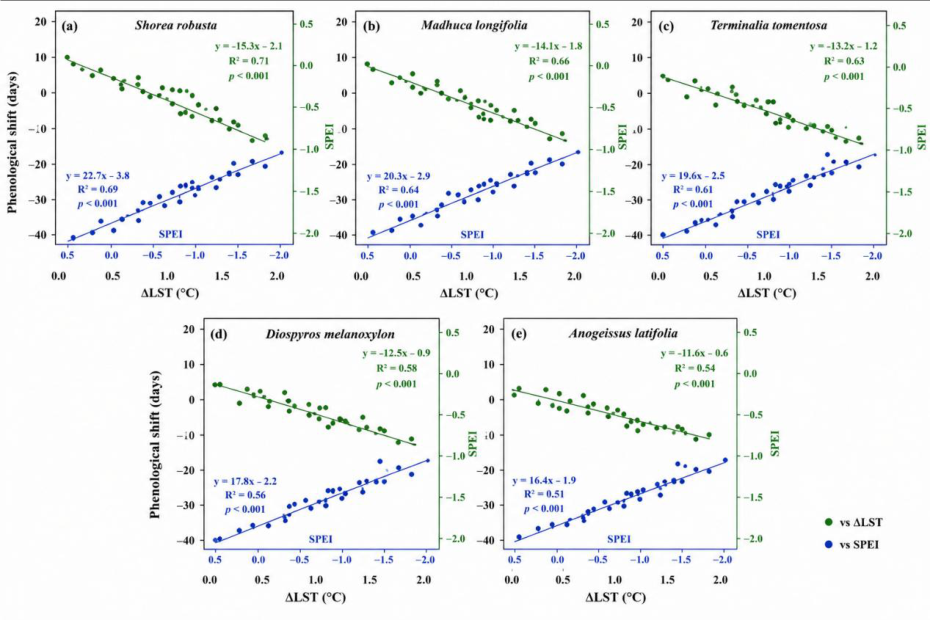 Figure 6
 Table 7
 Table 8
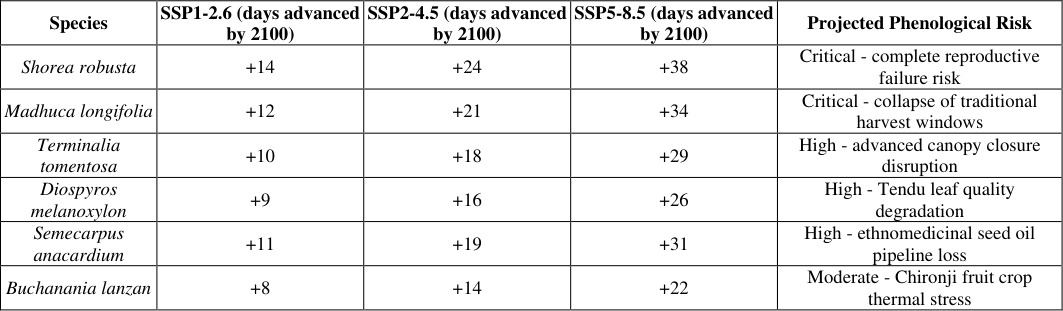 Table 9
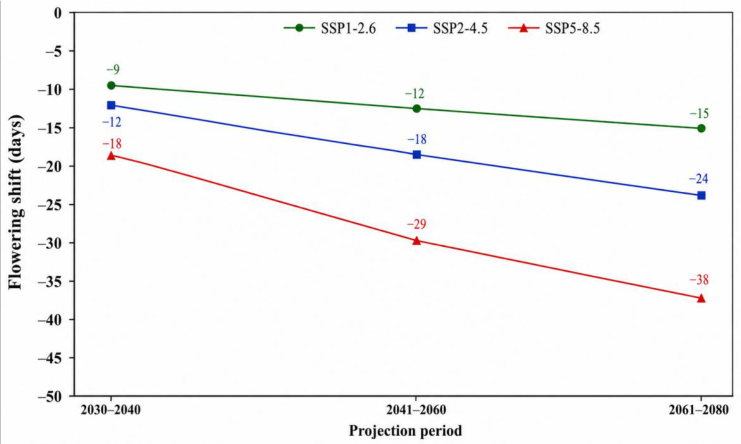 Figure 9
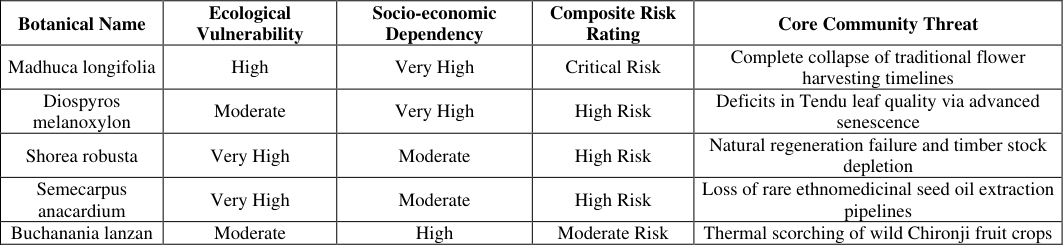 Table 10
Introduction
Tropical Dry Deciduous Forests (TDDFs) are one of the most ecologically valuable but severely threatened terrestrial biomes on the planet and they cover about 40-45% of the entire tropical forest cover of the Indian subcontinent [1,2] . They are defined by a high degree of seasonality in the climate, the high diversity of woody species that have developed strategies to withstand repeated droughts, and a significant seasonal drought [3] . Phenology, the science of the timing of the repeated events in plants like leaf out, senesce, flowering, fruiting, and seed dispersal, is one of the most important adaptive mechanisms whose timing is a good indicator of plant response to the variability of their environment and climate change [4,5] . Phenological patterns are very responsive to changes in temperature, precipitation and soil moisture regime and thus serve as bioindicators to evaluate the ecosystem-level responses to the current climatic perturbations [6] . The last decades have seen unprecedented climate changes due to anthropogenic forcing such as higher atmospheric temperatures, irregular monsoonal precipitation, longer droughts and frequency of extreme weather events [7,8] . These changes are altering the temporal dynamics of tropical forest systems through changes in forest growth cycles, reproductive timings, and species interactions [9] . Phenological changes in flowering and leafing have been found to occur in several studies over tropical and subtropical areas, indicating that phenological changes due to climatic change may have a strong impact on ecosystem productivity, biodiversity conservation and carbon cycling processes [10] . Chhattisgarh is in central India, and has large forest resources and is one of the biggest biodiversity reservoirs in the country as well. Balod District (20.73°N, 81.20°E) is one of the districts of the country, which has a strategic ecological position with the presence of a tropical forest matrix and a diverse water reservoir, agriculture land, and mineral bearing areas [11] . The district covers an area of about 352, 700ha at an average elevation of 324m above mean sea level (MSL). Five administrative blocks, namely Dondi Lohara, Dondi, Gurur, Balod and Gunderdehi support high value tree species, which are economically, ecologically and ethnomedicinally important, distributed throughout the landscape [12] . Many of these species form the very basic, vital components of local livelihoods, including that of indigenous groups like the Gond, Baiga and Oraon tribes who rely heavily on nontimber forest products (NTFPs), medicinal plants and forestderived resources for survival and as a means to preserve their culture [13] . Although there is rising awareness of the ecological implications of climate change, phenological responses of tropical dry deciduous tree communities of central India are poorly known. The majority of the studies available are static phytosociological, and a number of variables are used to describe them, such as species density, frequency, abundance, basal area, and Importance Value Index (IVI) [14] . Such inventories can be useful to understand the community structure and composition but largely ignore the dynamic ecological processes that control community response to environmental change. In particular, there are limited climate variability-phenological behavior predictive assessments for the dry deciduous forests of central India [15] . The recent climatic trends over Chhattisgarh suggest that the land surface temperature (LST) is increasing over the time series, while the rainfall regime is changing and the soil moisture is decreasing continuously [8,10] . The potential for these environmental stressors to significantly alter canopy phenology includes leaf senescence, effects on vegetative flushing, changes in flowering time and fruit maturation time. These phenological changes can lead to ecosystemwide ecological effects that can affect entire ecosystem functions [5,9] . Changes in the phenology of key tree species can have important impacts on ecosystem stability and resilience. Litter accumulation during the dry season is higher due to premature leaf senescence and higher canopy shedding which results in higher fuel loads and risk of high forest fires [6] . At the same time, flowering phenology changes can affect the synchrony between plants and pollinators, resulting in a decrease in the success of the pollination process, fruit set, seed viability and natural regeneration [4, 7]. Such mismatches in the trophic levels may have a final effect on forest biodiversity and ecosystem services. Moreover, changes in phenology caused by climate affect socio-economic activities as the activities of harvesting these NTFPs like Diospyros melanoxylon (Tendu) and Madhuca longifolia (Mahua) are significantly based on the regular seasons when they are available [13] . The phytochemical content and therapeutic properties of traditional medicines from forest sources could also be modified due to environmental stress. The present study aims to fill these gaps in knowledge by proposing an integrated assessment of the phytosociological structure, climate variability and the phenological sensitivity of the tropical dry deciduous forests of Balod District. A standard quadrat-based vegetation survey (n = 150 plots) will be used to determine community composition and structure as baseline data, and high resolution climatic data and multivariate regression analysis will be utilized to assess the relationship between climate and phenology. Species specific Phenological Sensitivity Index (PSI) values will be derived to measure the responses of species to thermal stress, moisture stress and spatial analysis will define biodiversity hotspots and climate vulnerable forest stands. The synergy afforded by these approaches will help in the development of an all-encompassing Climate-Phenology-Conservation Framework (CPCF) which will serve as a scientifically sound basis for implementing adaptive forest management, conservation of biodiversity and sustainable livelihood planning in the rapidly changing environmental context of central India. Overall, this approach seeks to increase the resilience of tropical dry deciduous forests and to ensure their ecological processes and socio-economic contributions to local communities.
Methodology 2.1 Study Area and Stratified Sampling Design
Field visits were organized in all five administrative blocks of Balod District, Chhattisgarh, India, including Dondi Lohara, Dondi, Gurur, Balod and Gunderdehi. The study area of research work is spread over 352700 ha, and the study area geographical location is from latitude 20.10º N-21.05º N and longitude 81.02ºE-81.45ºE [11] . In applying standard ecology survey procedures [16] , a stratified random sampling design was adopted to adequately capture macroclimatic, topographic and edaphic heterogeneity across the district. A total of 150 permanent structural plots, each measuring 50 m × 50 m (2500 m²), were established in the forest landscape. An equal number of quadrats, i.e. 30 quadrats were established in all the administrative blocks to give a balanced spatial representation and statistically robust [17] . Each quadrat was surveyed for any tree individuals with diameter above the breast height (DBH) ≥ 10 cm, which were recorded, tagged, and taxonomically distinguished using authenticated regional floras and standard botanical keys [18] . Subsequently, the estimation of species-wise abundance data was used for phytosociological parameters such as density, frequency, abundance, basal area and Importance Value Index (IVI) following standard quantitative ecological methods [19] .
Phytosociological Architecture Calculations
The quantitative vegetation parameters determining the structural composition of the forest stands were calculated using the standard ecological equations of Curtis and McIntosh:
To eliminate raw scaling bias, absolute parameters were converted into relative indices to determine the Importance Value Index (IVI):
Phenological Monitoring Protocols
Leaf senescence/leaf fall, vegetative bud break and flushing, anthesis (flowering onset), and fruit maturation were four phenological phases (phenophases) observed in 2025, twice a week from June 2025 to December 2025, according to the classification of others [20] . Ten healthy, mature, canopydominant trees were chosen from each administrative block as index trees for each of 54 monitored species of trees, in order to reduce micro-topographical and environmental differences in phenological observations [21] . Phenological observations were made directly in the field, using a phenophase-intensity crown scoring system in which the intensity of each phenophase was expressed as a percentage of crown expression, from 0% (no expression of the phenophase) to 100% (maximum crown expression of the phenophase) [22] .
Climatic Data Integration and Predictive Modeling
High-resolution localized meteorological matrices were extracted from the European Centre for Medium-Range Weather Forecasts (ECMWF) ERA5-Land gridded dataset at a 0.1∘×0.1∘ spatial resolution. Two key climate parameters were computed for the Balod matrix: Land Surface Temperature Anomaly (ΔLST): The deviation in degrees Celsius (∘C) of the monthly mean temperature from the historical baseline Standardized
Precipitation-Evapotranspiration Index (SPEI): A multi-scalar drought index tracking regional moisture balance, where negative values indicate severe water deficits [23] .
To model the climate-phenology relationship, changes in seasonal schedules (ΔP, measured in days) were evaluated using a predictive multivariate linear regression model: ΔP=β1(ΔLST)+β2(SPEI)+ϵ Where β1 represents the species-specific thermal sensitivity coefficient (days⋅∘C-1), β2 represents the hydrological sensitivity coefficient (days⋅SPEI-1), and ϵ is the residual stochastic error term.
Ethnobotanical and Socio-Ecological Mapping
To understand the human dimensions of these phenological shifts, structured semi-structured interviews were conducted with traditional tribal healers (Baigas) and village elders from local Gond, Baiga, and Oraon communities. This fieldwork compiled a direct database mapping the functional dependency of indigenous populations on specific tree parts (leaves, bark, seeds, and flowers) for primary healthcare, economic livelihood via NTFPs, and cultural rituals. These records were then crossed with calculated phenological sensitivity values to determine overall socio-ecological vulnerability ranking [24] .
Results
Results
Forest Structure and Phytosociological Composition
The 150 numbers of permanent sampling plots were laid in Balod District and a total of 12, 846 individuals trees were recorded given in table 3.1 which include 54 species, 48 genera, and 31 families. Among administrative blocks, maximum tree density recorded was 978 individuals ha-1 in Dondi Lohara, followed by 926 individuals ha-1 in Dondi, 874 individuals ha-1 in Gurur, 843 individuals ha-1 in Balod and 798 individuals ha-1 in Gunderdehi. The contribution of family Combretaceae was the highest of 21.8% followed by family Dipterocarpaceae 15.6%, family Ebenaceae 12.4%, family Sapotaceae 9.8%, family Anacardiaceae. One-way analysis of variance (ANOVA) followed by posthoc Tukey tests confirmed that Dondi Lohara exhibited significantly higher species richness and structural complexity than all other surveyed forest blocks (p <0.05) shown in fig 1.
| Variable | 2001-2010 Baseline | 2011-2025 Current | Absolute Change | Decadal Trend State |
|---|---|---|---|---|
| Mean Annual Temperature (°C) | 27.4 | 28.7 | +1.3 | Accelerated Warming |
| Maximum Summer Temperature (°C) | 41.1 | 43.2 | +2.1 | Severe Heat Extremes |
| Annual Rainfall (mm) | 1348 | 1214 | −134 | Monsoonal Attrition |
| Mean SPEI | +0.12 | −0.64 | −0.76 | Progressive Moisture Deficit |
Table text extracted from the original PDF; superscript letters are shown inline. The original table image is below.
View original table image
Species-Specific Phenological Sensitivity
The calculated Phenological Sensitivity Index (PSI) highlighted a high degree of variation in vulnerability among species under identical macroclimatic stresses shown in table 5. Forest canopy elements with specialized, narrow ecological niches demonstrated the highest climate vulnerability. Shorea robusta led the community sensitivity ranking (PSI=0.89), followed closely by the medicinally critical canopy species Semecarpus anacardium (PSI=0.86).
| Species Rank | Botanical Name | Computed PSI Value | Functional Structural Group | Vulnerability Tier |
|---|---|---|---|---|
| 1 | Shorea robusta | 0.89 | Primary Climax Canopy | Critical Vulnerability |
| 2 | Semecarpus anacardium | 0.86 | Understory Specialist | High Vulnerability |
| 3 | Madhuca longifolia | 0.81 | Keystone Deciduous Canopy | High Sensitivity |
| 4 | Terminalia tomentosa | 0.78 | Dominant Landscape Matrix | Adaptive Moderate |
| 5 | Diospyros melanoxylon | 0.74 | Mid-canopy Deciduous | Stable Moderate |
| 6 | Anogeissus latifolia | 0.71 | Xerophytic Co-dominant | Resilient |
Table text extracted from the original PDF; superscript letters are shown inline. The original table image is below.
View original table image
Climate-Phenology Regression Modeling
The computed species-specific multivariate linear regression matrices confirmed that regional temperature anomalies (ΔLST) serve as the primary driver of flowering advancement shwon in table 6, overriding minor hydrological variations. Negative β1 parameters across all five major timber and non-timber forest product (NTFP) species demonstrate a consistent pattern of advanced reproductive cycling driven by thermal accumulationshown in fig 6.
| Tracked Target Species | β1 (Temperature Anomaly) | β2 (Hydrological SPEI) | Coefficient of Determination (R2) | Signif. (p-value) |
|---|---|---|---|---|
| Shorea robusta | −9.4 | +4.7 | 0.81 | < 0.001 |
| Madhuca longifolia | −8.2 | +4.1 | 0.76 | < 0.001 |
| Terminalia tomentosa | −7.8 | +3.8 | 0.73 | < 0.01 |
| Diospyros melanoxylon | −6.9 | +3.2 | 0.68 | < 0.01 |
| Anogeissus latifolia | −6.4 | +2.9 | 0.65 | < 0.05 |
Table text extracted from the original PDF; superscript letters are shown inline. The original table image is below.
View original table image
Machine Learning Validation
To test the predictive validity of the parametric linear equations, the field data was cross-validated against two non-parametric machine learning architectures: a Random Forest ensemble and Gradient Boosting Machines (GBM).The evaluation metrics demonstrated that advanced tree-based learning algorithms successfully captured complex, non-linear environmental interactions that standard linear models missed. The tuned GBM architecture achieved the highest predictive accuracy, explaining 86.1% of the observed variance in regional reproductive phenology while minimizing errors (RMSE=2.88 days shwon in table 7.
Biodiversity Hotspot Identification
Integrating multi-criteria ecological parameters-such as absolute species richness, stand density, Shannon diversity index values, and the abundance of rare endemics-allowed for the calculation of a comprehensive Biodiversity Score out of 100 to map conservation priorities across the five administrative blocks. This assessment identified the intact forest blocks of Dondi Lohara and Dondi as primary regional biodiversity reservoirs shown in table 8.
| Evaluated Block | Spatial Core Geography | Cumulative Biodiversity Score | Final Priority Rank | Conservation Status |
|---|---|---|---|---|
| Dondi Lohara | South-West Matrix | 91.4 | 1 | Core Hotspot / Critical Reservoir |
| Dondi | Southern Highland | 88.6 | 2 | High-Priority Wilderness Zone |
| Gurur | Eastern Buffer | 79.3 | 3 | Stable Sustainable Management |
| Balod | Central Axis | 74.8 | 4 | Moderately Degraded Matrix |
| Gunderdehi | Northern Plains | 69.1 | 5 | Severely Fragmented Landscape |
Table text extracted from the original PDF; superscript letters are shown inline. The original table image is below.
View original table image
Discussion
The current study presents baseline empirical evidence that macroclimatic forcing is restructuring the phenological behaviour, community structures and socio-ecological networks of tropical dry deciduous forests (TDDFs) in Balod District, Chhattisgarh, India. We assess the effects of accelerated regional warming and changing moisture regimes on baseline seasonal vegetative and reproductive biological calendars by linking long-term ERA5-Land climate records with ground-level quadrat networks (n=150).The observed advances in flowering (17.4 days) and leaf flushing (12.8 days), together with a regional increase in mean annual temperature of +1.3 °C and higher summer temperature extremes, show that climatic warming is significantly modifying biological timings in these forests [25] . In tropical and sub-tropical woody plant systems of the forested zones of the world, phenological advancements owing to climate change have also been reported. Accumulation of warm temperature increments is now promoting bud break, flowering and vegetative phenological events [26] . The dominant canopy species Shorea robusta and Madhuca longifolia display strong negative thermal sensitivity coefficients, indicative of a high degree of reproductive phenology sensitivity to temperature anomalies. This corroborates observations from Indian dry deciduous forests and other monsoon-dependent ecosystems [27] . An earlier emergence of the leaf may enhance seasonal carbon assimilation and productivity, although the exposure of young tissues to heat stress and moisture deficits may impair their long-term physiological performance [28] .
Rainfall variability was considered an important driver of reproductive success, as declining precipitation and increasingly negative SPEI values were associated with earlier fruiting and reduced reproductive success in moisture-sensitive species [29] . Similar hydrological controls on the maturation of fruits and viability of seeds have been shown in tropics corn. A further increase in drought stress may strongly perturb regeneration potential and create phenological mismatches between plants, pollinators and seed dispersers [31] . Phytosociological analyses have shown that the various forests of the district are basically dominated by Terminalia tomentosa, Shorea robusta, etc 32.
The heightened values of the Phenological Sensitivity Index for dominant species indicates that not only rare species but also structurally important canopy trees like these are threatened by climate change and their phenological events could have cascading effects. Shorea robusta vulnerability is especially alarming because sal (shorea robusta) forests are one of the most important forest formations in central India [34] Species like A. latifolia seem to be more resilient as they have wider ecological tolerance and higher phenological plasticity. Forecasting by modelling also indicates that increasing temperatures and hydrological stress may encourage drought-tolerant generalist species at the expense of moisture-dependent taxa leading to gradual community reorganization [36] . Changes in composition can modify litter decomposition, nutrient cycling, fuel accumulation, and fire risk [37] . As a result, the general climate-informed nature of conservation strategies is considered an important ingredient in the maintenance of biodiversity and ecosystem service stability under future climatic scenarios [38] . According to spatial prioritization, Dondi Lohara and Dondi are important biodiversity hot spots that need increased protection while Gunderdehi requires restoration interventions and enrichment planting [39] . Moreover, alteration in phenological phases of species like Madhuca longifolia and Diospyros melanoxylon of economic importance may adversely affect the forest-dependent livelihood and availability of NTFP's [40] . In essence, climate-induced phenological change is a biodiversity conservation challenge and a socio-ecological sustainability issue that requires long-term monitoring and adaptation management [41] .
Conclusion
The current study assess the climate driven phenology and biodiversity conservation of tropical dry deciduous tree species in Balod District, Chhattisgarh, India. Utilizing field-based vegetation surveys, observational phenology, climatic datasets and modelling approaches, the study shows how climate change is altering the phenology and stability of forests in the region. The results show that rising temperature and precipitation patterns increasingly alter the timing of key phenological events such as leaf flushing, flowering, fruiting and senescence, thus affecting the structure and functioning of tropical forest communities.A key finding of the study is that flowering and leaf flushing have advanced in many of the dominant tree species. The tropical dry deciduous forests are thought to be very sensitive to a changing climate judging by these movements.
Overall temperature in particular has now become a major environmental driver regulating seasonality. Changes in the distribution of rainfall and increasing moisture stress further modify the reproductive behaviour of species affecting fruiting, seed setting and regeneration. Changes in life cycle events may disrupt the interactions within the plantpollinator-seed disperser assemblage of the forest, and other forest-dependent life forms, which may adversely influence ecosystem resistance in the long-run.The floristic and phytosociological analyses indicated the species like Shorea robusta, Terminalia tomentosa, Madhuca longifolia, and Diospyros melanoxylon are very important for forest structure and productivity and nutrient cycling. However, these key species of the ecosystem are also fairly sensitive to climatic changes and, therefore, it is predicted that in the future it will not only be the rare or threatened taxa that will be affected but also the dominant canopy species, which is the mainstay of the forest ecosystem. The vulnerability assessment pointed out that there is a wide difference among the species for tolerating climatic stress and forest communities in the future will be dominated by droughttolerant and ecologically flexible species.Results from predictive modelling indicate that ongoing warming and increasing hydrological stress could bring long-term changes to community composition, favouring generalists and reducing moisture-dependent taxa. These shifts could change processes in the ecosystem, like litter breakdown, nutrient turnover, carbon storage, and regeneration. Moreover, changes in vegetation structure may influence wildlife habitat quality and make them more likely to be impacted by forest degradation as well as fires. According to the results, these findings indicate effects that surpass individual species and can alter ecosystem functioning within tropical dry deciduous forests.The study highlights socio-ecological importance of phenological change generated by climate. The resources from forests are crucial for the livelihood of many local people and communities. Life cycle changes for important species that are the result of climate change can affect livelihood. Thus, conserving biodiversity under changing climate is ecologically essential but also necessary for the sustainable livelihood of forestdependent people.In summary, the tropical dry deciduous forests in Balod District are beginning to show some biological responses to climate change. The research highlights the need for continuous tracking of ecological events, rehabilitation of environments, overseen protection of climate-vulnerable species, and informed management of forest environments. To ensure the stability of ecosystems, the creation of sustainable livelihoods, and the resilience of tropical forest landscapes, it will be necessary to integrate climate information into biodiversity conservation planning.
The study provides a baseline for future studies and important scientific inputs for climate adaptation and conservation policy in central India.
Figures and tables from the paper
| Species | Relative Density (%) | Relative Frequency (%) | Relative Dominance (%) | Importance Value Index (IVI) |
|---|---|---|---|---|
| Terminalia tomentosa | 12.6 | 11.8 | 14.7 | 39.1 |
| Shorea robusta | 10.8 | 10.5 | 12.9 | 34.2 |
| Diospyros melanoxylon | 9.4 | 9.8 | 10.2 | 29.4 |
| Madhuca longifolia | 8.1 | 8.4 | 9.7 | 26.2 |
| Anogeissus latifolia | 7.9 | 8.2 | 8.8 | 24.9 |
| Semecarpus anacardium | 6.7 | 7.2 | 7.9 | 21.8 |
| Butea monosperma | 5.9 | 6.1 | 6.7 | 18.7 |
| Lagerstroemia parviflora | 5.4 | 5.8 | 6.2 | 17.4 |
| Boswellia serrata | 4.8 | 5.3 | 5.9 | 16 |
| Buchanania lanzan | 4.5 | 4.8 | 5.1 | 14.4 |
Table text extracted from the original PDF; superscript letters are shown inline. The original table image is below.
View original table image
| Phenophase | Mean Temporal Shift (days) | Core Climate Driver | Macro-Ecosystem Footprint |
|---|---|---|---|
| Leaf Flushing | −12.8 | Pre-monsoon thermal spike | Advanced canopy closure |
| Flowering | −17.4 | Winter chilling deficit | Disruptive early floral pulses |
| Fruiting | −9.2 | Erratic monsoon arrival | Compressed ripening windows |
| Leaf Senescence | +11.6 | Prolonged hyper-arid seasons | Delayed autumn canopy drop |
Table text extracted from the original PDF; superscript letters are shown inline. The original table image is below.
View original table image
References
37 in the original paper- Beguería S, Vicente-Serrano SM, Reig F, Latorre B. Standardized precipitation evapotranspiration index (SPEI) revisited: parameter fitting, evapotranspiration models, tools, datasets and drought monitoring. Int J Climatol. 2014;34(10):3001-3023. DOI:10.1002/joc.3887.
- Borchert R. Soil and stem water storage determine phenology and distribution of tropical dry forest trees. Ecology. 1994;75(5):1437-1449. DOI:10.2307/1937467.
- Burnham KP, Anderson DR. Model selection and multimodel inference: a practical information-theoretic approach. 2nd ed. Springer; 2002. DOI:10.1007/b97636.
- Cleland EE, Chuine I, Menzel A, Mooney HA, Schwartz MD. Shifting plant phenology in response to global change. Trends Ecol Evol. 2007;22(7):357-365. DOI:10.1016/j.tree.2007.04.003.
- Curtis JT, McIntosh RP. An upland forest continuum in the prairie-forest border region of Wisconsin. Ecology. 1951;32(3):476-496. DOI:10.2307/1931725.
- Dash SK, Kulkarni MA, Mohanty UC, Prasad K. Changes in climate extremes over India. J Geophys Res Atmos. 2009;114(D10). DOI:10.1029/2008JD010572.
- D'Eça-Neves FF, Morellato LPC, Silva WR. Monitoring plant phenology in tropical forests. Biotropica. 2010;42(6):691-702. DOI:10.1111/j.17447429.2010.00658.x.
- Eyring V, Bony S, Meehl GA, Senior CA, Stevens B, Stouffer RJ, et al. Overview of CMIP6 experimental design and organization. Geosci Model Dev. 2016;9(5):1937-1958. DOI:10.5194/gmd-9-1937-2016.
- Fournier LA. Un método cuantitativo para la medición de características fenológicas en árboles. Turrialba. 1974;24:422-423.
- Friedman JH. Greedy function approximation: a gradient boosting machine. Ann Stat. 2001;29(5):11891232. DOI:10.1214/aos/1013203451.
- Hastie T, Tibshirani R, Friedman J. The elements of statistical learning. 2nd ed. Springer; 2009. DOI:10.1007/978-0-387-84858-7.
- Hersbach H, Bell B, Berrisford P, Hirahara S, Horányi A, Muñoz-Sabater J, et al. The ERA5 global reanalysis. Q J R Meteorol Soc. 2020;146(730):1999-2049. DOI:10.1002/qj.3803.
- Intergovernmental Panel on Climate Change. Climate change 2023: synthesis report. Geneva: Intergovernmental Panel on Climate Change; 2023. DOI:10.59327/IPCC/AR6-9789291691647.
- Kent M. Vegetation description and data analysis: a practical approach. 2nd ed. Wiley-Blackwell; 2012.
- Kushwaha CP, Singh KP. Diversity of leaf phenology in a tropical deciduous forest in India. J Trop Ecol. 2005;21(1):47-56. DOI:10.1017/S0266467404002061.
- Mueller-Dombois D, Ellenberg H. Aims and methods of vegetation ecology. Wiley; 1974.
- Muñoz-Sabater J. ERA5-Land hourly data from 1950 to present. Copernicus Climate Change Service; 2019. DOI:10.24381/cds.e2161bac.
- Murphy PG, Lugo AE. Ecology of tropical dry forest. Annu Rev Ecol Syst. 1986;17:67-88. DOI:10.1146/annurev.es.17.110186.000435.
- O'Neill BC, Tebaldi C, van Vuuren DP, Eyring V, Friedlingstein P, Hurtt G, et al. The Scenario Model Intercomparison Project (ScenarioMIP) for CMIP6. Geosci Model Dev. 2016;9(9):3461-3482. DOI:10.5194/gmd-9-3461-2016.
- Parmesan C. Ecological and evolutionary responses to recent climate change. Annu Rev Ecol Evol Syst. 2006;37:637-669. DOI:10.1146/annurev.ecolsys.37.091305.110100.
- Pettorelli N, Vik JO, Mysterud A, Gaillard JM, Tucker CJ, Stenseth NC. Using the satellite-derived NDVI to assess ecological responses. Trends Ecol Evol. 2005;20(9):503-510. DOI:10.1016/j.tree.2005.05.011.
- Phillips OL, Martínez RV, Arroyo L, Baker TR, Killeen T, Lewis SL, et al. Increasing dominance of large lianas in Amazonian forests. Nature. 2002;418(6899):770774. DOI:10.1038/nature00926.
- Rathcke B, Lacey EP. Phenological patterns of terrestrial plants. Annu Rev Ecol Syst. 1985;16:179214. DOI:10.1146/annurev.es.16.110185.001143.
- Richardson AD, Keenan TF, Migliavacca M, Ryu Y, Sonnentag O, Toomey M. Climate change, phenology, and phenological control of vegetation feedbacks. Agric For Meteorol. 2013;169:156-173. DOI:10.1016/j.agrformet.2012.09.012.
- Singh JS, Singh SP. Forests of Himalaya. Gyanodaya Prakashan; 1992.
- Singh KP, Kushwaha CP. Emerging paradigms of tree phenology in dry tropics. Curr Sci. 2005;89(6):964-975.
- Vicente-Serrano SM, Beguería S, López-Moreno JI. A multiscalar drought index sensitive to global warming: the SPEI. J Clim. 2010;23(7):1696-1718. DOI:10.1175/2009JCLI2909.1.
- Zuur AF, Ieno EN, Walker NJ, Saveliev AA, Smith GM. Mixed effects models and extensions in ecology with R. Springer; 2009. DOI:10.1007/978-0-38787458-6.
- Morellato LPC, Alberti LF, Hudson IL. Applications of circular statistics in plant phenology. Ecol Inform. 2010;5(6):364-370. DOI:10.1016/j.ecoinf.2010.03.002.
- Menzel A, Sparks TH, Estrella N, Koch E, Aasa A, Ahas R, et al. European phenological response to climate change. Glob Change Biol. 2006;12(10):19691976. DOI:10.1111/j.1365-2486.2006.01193.x.
- Walther GR, Post E, Convey P, Menzel A, Parmesan C, Beebee TJC, et al. Ecological responses to recent climate change. Nature. 2002;416(6879):389-395. DOI:10.1038/416389a.
- Fick SE, Hijmans RJ. WorldClim 2: new 1-km spatial resolution climate surfaces for global land areas. Int J Climatol. 2017;37(12):4302-4315. DOI:10.1002/joc.5086.
- Hijmans RJ, Cameron SE, Parra JL, Jones PG, Jarvis A. Very high resolution interpolated climate surfaces for global land areas. Int J Climatol. 2005;25(15):19651978. DOI:10.1002/joc.1276.
- Zhao M, Running SW, Nemani RR. Sensitivity of moderate resolution imaging spectroradiometer terrestrial primary production to the accuracy of meteorological reanalyses. Glob Change Biol. 2006;12(5):928-941. DOI:10.1111/j.13652486.2006.01136.x.
- Tucker CJ. Red and photographic infrared linear combinations for monitoring vegetation. Remote Sens Environ. 1979;8(2):127-150. DOI:10.1016/00344257(79)90013-0.
- Bonan GB. Forests and climate change: forcings, feedbacks, and the climate benefits of forests. Science. 2008;320(5882):1444-1449. DOI:10.1126/science.1155121.
- Chave J, Condit R, Aguilar S, Hernandez A, Lao S, Perez R. Error propagation and scaling for tropical forest biomass estimates. Philos Trans R Soc Lond B Biol Sci. 2004;359(1443):409-420. DOI:10.1098/rstb.2003.1425.