
Research article · 2026 · Full text
International Journal of Agriculture and NutritionEvaluation of yield and its contributing traits for mung bean (Vigna radiata L.) germplasm
Volume 8(8) · Pages 35–38 · DOI: 10.33545/26646064.2026.v8.i8a.733 ↗
Research areasGenetics and Plant BreedingGenetic and Environmental Crop StudiesAgricultural Practices and Plant Genetics
Abstract
Author-writtenThe present study was carried out to assess genetic variability, character association and path analysis for seed yield and component characters in 12 genotypes of mungbean grown in a Randomized Block Design with three replications at Organic Research Farm, Kargunawaji, Institute of Agricultural Science, Bundelkhand University, Jhansi (UP), during Kharif 2024. Twelve characters were used to record the observations: days to 50% flowering, days to maturity, plant height, number of primary branches, number of clusters per plant, number of pods per cluster, number of pods per plant, pod length, number of seeds per pod, 100-seed weight, protein content, and seed yield per plant. Significant variations between the genotypes for each of the twelve characters under study were found through analysis of variance. Important yield components showed a great deal of variation. Seed yield per plant, number of pods per cluster, number of clusters per plant, number of primary branches, pod length, and number of seeds per pod all showed high phenotypic and genotypic coefficients of variation. Pod length, number of seeds per pod, number of primary branches, number of clusters per plant, and number of pods per cluster. Seed yield per plant showed high heritability and high genetic advancement, followed by days to maturity, number of pods per cluster, days to 50% flowering, number of pods per plant, and pod length.
Summary
Source-checkedPlain-language reading of the full paper, prepared with AI and checked against the text. Each point links to the authors' own words.
Why it matters
- Mung bean (Vigna radiata L.) is a highly important and nutritious legume crop widely cultivated and consumed in Asia, particularly in India. View evidence ↗
- Mung bean productivity in India is currently below its potential due to factors such as poor land quality, limited rainfall, pest losses, and a lack of high-yielding varieties. View evidence ↗
- Narrow genetic diversity is a major obstacle preventing the crop from reaching higher yield levels. View evidence ↗
The question
- The study aimed to evaluate genetic variability, character associations, and path analysis for seed yield and its contributing traits across 12 mung bean genotypes. View evidence ↗
What they did
- Twelve mung bean genotypes were grown in a randomized block design with three replications at the Organic Research Farm in Jhansi during the 2024-25 Kharif season. View evidence ↗
- The researchers measured twelve specific traits, including seed yield per plant, protein content, pod length, and various flowering and maturity timelines. View evidence ↗
- Statistical tools used for analysis included analysis of variance, heritability, genetic advance, correlation analysis, and path coefficient analysis. View evidence ↗
What they found
- High phenotypic and genotypic coefficients of variation were observed for seed yield per plant, pod length, number of seeds per pod, and several other yield components. View evidence ↗
- Seed yield per plant exhibited high heritability and high genetic advancement, along with traits like days to maturity and pod length. View evidence ↗
- Seed yield was positively and significantly correlated with protein content, pod length, and the number of primary branches, clusters per plant, and pods per cluster. View evidence ↗
- Days to maturity, days to 50% flowering, plant height, and number of seeds per pod showed negative and non-significant associations with seed yield. View evidence ↗
- Genotypic path analysis showed that 100-seed weight, days to maturity, number of pods per plant, and number of clusters per plant had significant direct effects on seed yield. View evidence ↗
What it means
- The authors concluded that genotypic correlations were generally stronger in magnitude than phenotypic correlations. View evidence ↗
- The authors suggest that further field trials and genetic studies on more diverse germplasm are needed to validate these correlations. View evidence ↗
Visual summary
2 visualsIllustrations explain the paper; charts are replotted from the paper's own table values.
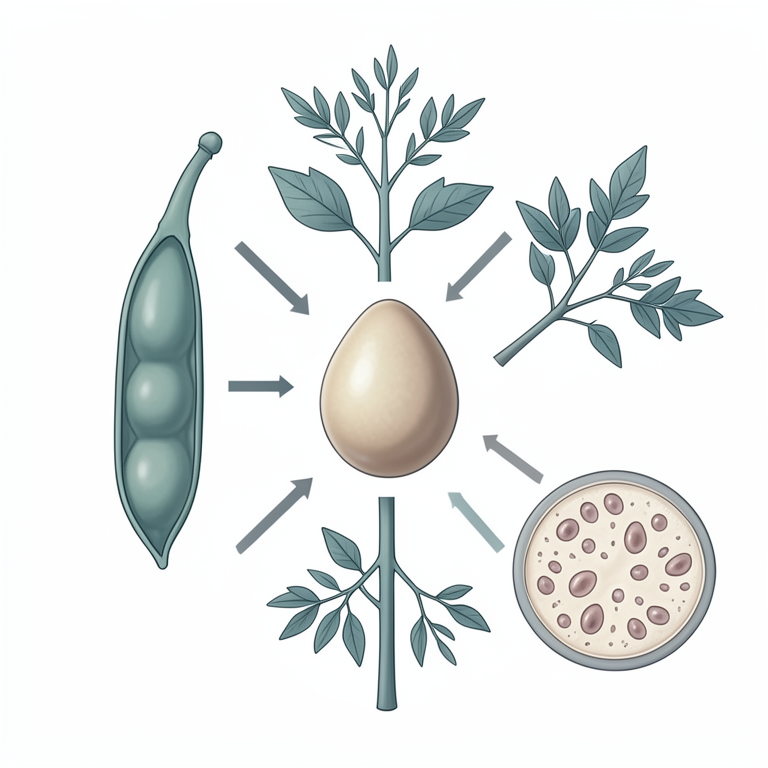
Trait Correlation Map
AI-generated conceptual illustration (mung bean plants (Vigna radiata L.)). It explains the idea and does not show study data.
View source evidence ↗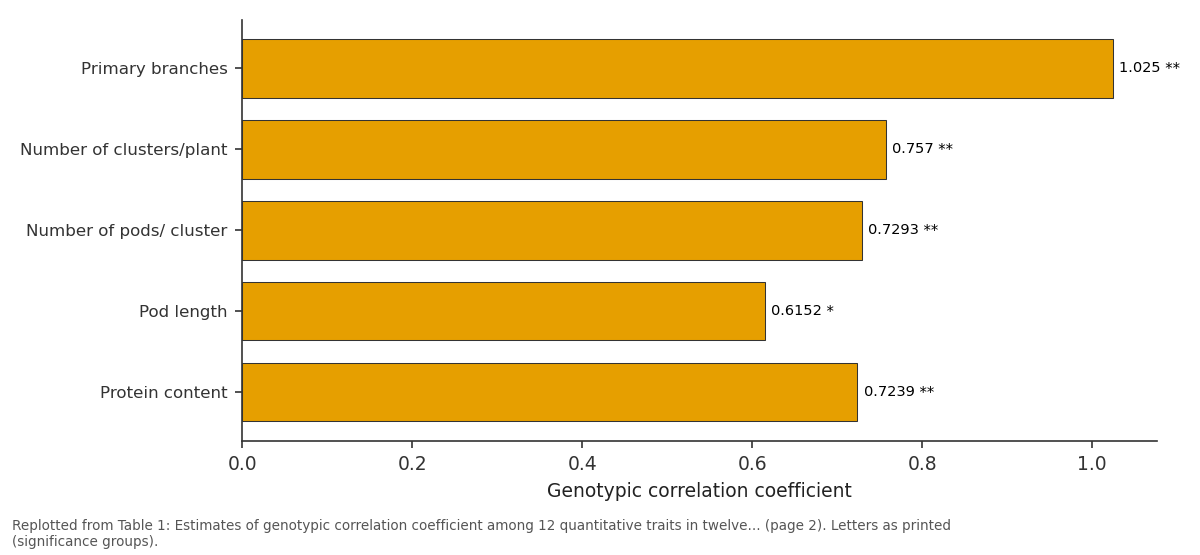
Seed yield/ plant: Primary branches vs Number of clusters/plant vs Number of pods/ cluster vs Pod length vs Protein content
Replotted from Table 1 (page 2) of the original paper. Every bar is the paper's own table value.
View source evidence ↗Figures & tables
From the original paper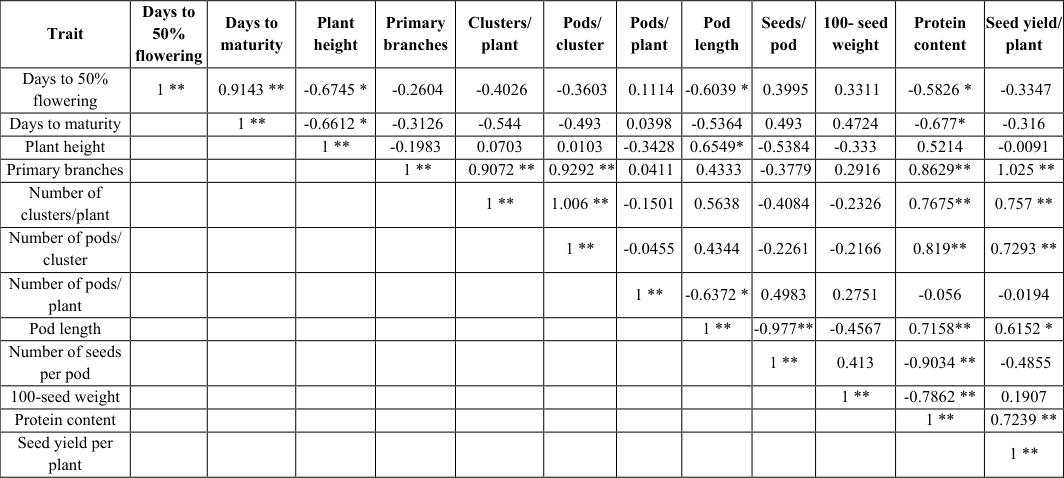 Table 1
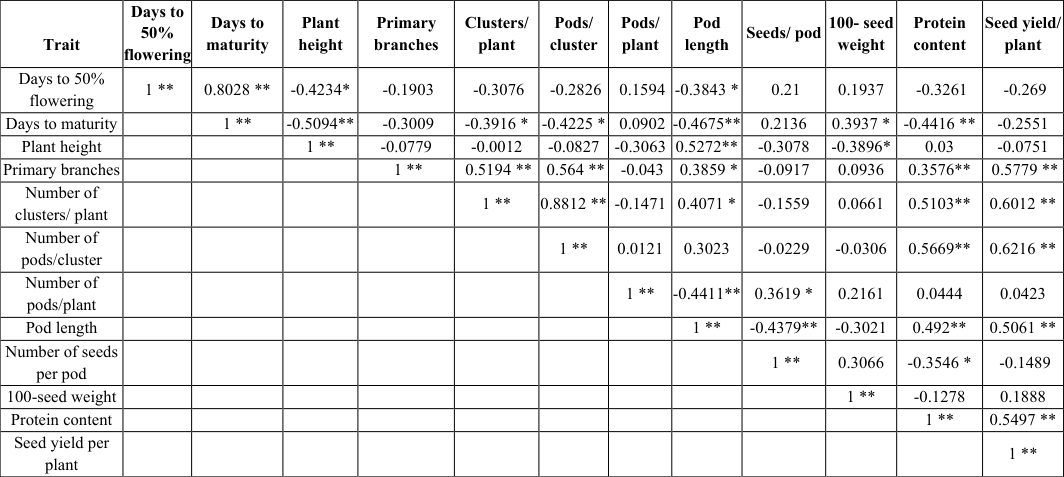 Table 2
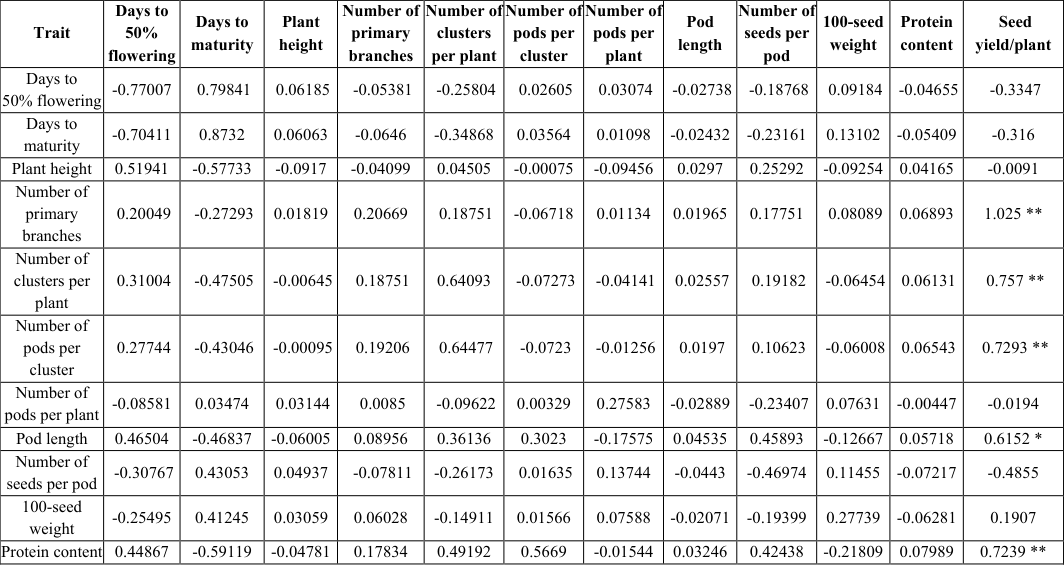 Table 3
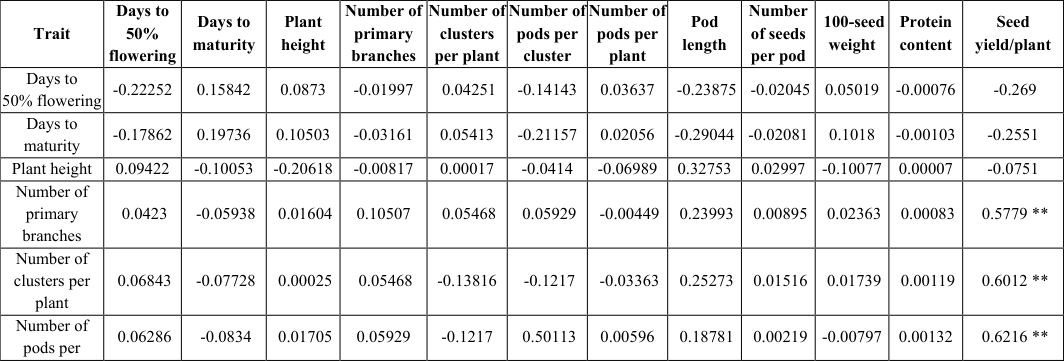 Table 4
Introduction
Mung bean, scientifically known as Vigna radiata (L.) Wilczek, is a crucial and widely cultivated legume in Asia. It holds significant importance as a nutritious food source and is extensively grown and consumed across India (Datta et al., 2012) [2] . It is believed to have originated in India and remains a prominent pulse crop in the region. Mung bean, a member of the Fabaceae family, is a self-pollinating legume with a somatic chromosome number of 2n=2x=22. One of India's main pulse crops, mungbean is grown from humid tropical regions to arid and semiarid ones. Bangladesh, China, India, Pakistan, Sri Lanka, Thailand, the Philippines, Myanmar, Indonesia, East Africa, Nepal, and Bhutan are among the countries that grow mungbean. India is where mungbean first appeared, and it later spread to Java, Eastern and Central Africa, and the West Indies. Average productivity of mungbean falls short of its potential due to various factors, including cultivation on marginal and degraded lands with limited rainfall, insufficient use of fertilizers, significant losses from pests and diseases, lack of suitable high-yielding varieties, absence of determinate types of varieties and limited knowledge of improved farming practices among farmers. These constraints contribute to the low productivity of mungbean in India. Another significant challenge is the narrow genetic diversity of the crop, which hinders its ability to achieve higher yield levels. Even though mungbean is a self-pollinating species, there exists considerable genetic variation among mungbean cultivars and their related species (Bisht et al., 2005) [1] . However, this crop's high level of self-pollination reduces natural variability, which limits the selection process's effects. However, the degree of genetic variability in the population determines how well a selection program works in plant breeding. Any effort to improve crops must comprehend the degree of genetic variability and how it is measured for both qualitative and quantitative characteristics of economic significance. As a result, understanding variability, heritability, and genetic advance is critical in efficient breeding, International Journal of Agriculture and Nutrition https://www.agriculturejournal.net allowing breeders to select the best genotypes for increased yield (Degefa et al., 2014) [3] . The yield is a complex character formed by the interaction of various yieldcontributing characters, each of which has positive or negative associations with yield and with one another.
Assessing the magnitude of correlations between various characters and yield would be extremely useful in indirect selection for yield improvement. The current study will examine various aspects of genetic variability, correlation studies, path coefficient analysis, genetic diversity, and selection indices for seed yield and other contributing traits in mungbeans.
Material and Methods
The experimental material consisted of twelve genotypes of mungbean Vigna radiata (L.)) made available in the Organic Research Farm, Karguan ji, Department of Genetics and Plant Breeding, Institute of Agricultural Science, Bundelkhand University, Jhansi. The experiment was laid out in randomized block design (RBD) with three replications during the kharif season 2024-25. Each genotype was planted in a plot of 1.35 m x 1.35 m size, accommodating two rows spaced 45 cm apart. The plant-toplant spacing of 10 cm was maintained. Non-experimental rows were planted all around the experiment to eliminate the border effects, if any. All the recommended package of practices were adopted to raise a good and healthy crop. The observations were made on five competitive plants chosen at random from each entry, and the average value was used for statistical analysis, with the exception of days to 50% flowering, days, days to maturity, plant height (cm), number of clusters per plant, number of pods per cluster, number of seeds per pod, 100-seed weight (g), seed yield per plant (g), and protein content. Trait association studies used analysis of variance, genetic variances, heritability and genetic advance, correlation analysis, and path coefficient analysis to quantify the interrelationships between different traits and investigate the direct and indirect effects of different traits on yield and quality components, respectively.
Results and Discussion
Mung bean germplasm data analysis was performed to evaluate correlation coefficient, path coefficient analysis, and the direct and indirect effects of various characters on seed yield in Mungbean. Further discussion is provided below.
Correlation coefficients
The genotypic and phenotypic correlation coefficients were estimated for all combinations of the twelve characters under investigation. Table 1 shows the estimated correlation coefficients. There is no tangible test for determining the statistical significance of correlation at the genotypic level, so associations at the phenotypic level are generally considered (Reddy and Sharma 1982, and Dhayal et al., 2003) [4,5] . The estimates of genotypic correlation coefficients were generally similar in direction but larger in magnitude than their corresponding phenotypic correlation coefficients, indicating a strong association between pairs of characters; however, the values of phenotypic correlation coefficients were reduced with environmental interaction.
| Trait | Days to 50% flowering | Days to maturity | Plant height | Primary branches | Clusters/ plant | Pods/ cluster | Pods/ plant | Pod length | Seeds/ pod | 100- seed weight | Protein content | Seed yield/ plant |
|---|---|---|---|---|---|---|---|---|---|---|---|---|
| Days to 50% flowering | 1 ** | 0.9143 ** | -0.6745 * | -0.2604 | -0.4026 | -0.3603 | 0.1114 | -0.6039 * | 0.3995 | 0.3311 | -0.5826 * | -0.3347 |
| Days to maturity | 1 ** | -0.6612 * | -0.3126 | -0.544 | -0.493 | 0.0398 | -0.5364 | 0.493 | 0.4724 | -0.677* | -0.316 | |
| Plant height | 1 ** | -0.1983 | 0.0703 | 0.0103 | -0.3428 | 0.6549* | -0.5384 | -0.333 | 0.5214 | -0.0091 | ||
| Primary branches | 1 ** | 0.9072 ** | 0.9292 ** | 0.0411 | 0.4333 | -0.3779 | 0.2916 | 0.8629** | 1.025 ** | |||
| Number of clusters/plant | 1 ** | 1.006 ** | -0.1501 | 0.5638 | -0.4084 | -0.2326 | 0.7675** | 0.757 ** | ||||
| Number of pods/ cluster | 1 ** | -0.0455 | 0.4344 | -0.2261 | -0.2166 | 0.819** | 0.7293 ** | |||||
| Number of pods/ plant | 1 ** | -0.6372 * | 0.4983 | 0.2751 | -0.056 | -0.0194 | ||||||
| Pod length | 1 ** | -0.977** | -0.4567 | 0.7158** | 0.6152 * | |||||||
| Number of seeds per pod | 1 ** | 0.413 | -0.9034 ** | -0.4855 | ||||||||
| 100-seed weight | 1 ** | -0.7862 ** | 0.1907 | |||||||||
| Protein content | 1 ** | 0.7239 ** | ||||||||||
| Seed yield per plant | 1 ** |
Table text extracted from the original PDF; superscript letters are shown inline. The original table image is below.
View original table image
Path coefficient analysis
In the current study, twelve characters were chosen to partition their genotypic correlation coefficients with seed yield into direct and indirect effects: days to 50% flowering, days to maturity, plant height (cm), number of primary branches per plant, number of clusters per plant, number of pods per cluster, number of pods per plant, pod length (cm), number of seeds per pod, 100-seed weight (g), seed yield per plant, and protein content. The resultant variable was seed yield, and the causal variables were the twelve component characters listed above. Tables 3 and4 show the genotypic correlation coefficients calculated between seed yield per plant and each of the twelve causal variables, as well as between themselves.
Conclusion
The analysis of correlation coefficients revealed that the magnitude of genotypic correlation was greater than the corresponding phenotypic correlation. The number of primary branches, number of pods per cluster, number of clusters per plant, pod length, and protein content all had highly significant and positive with seed yield at both the genotypic and phenotypic levels. At both the genotypic and phenotypic levels, there was a negative and non-significant association between days to 50% flowering, days to maturity, plant height, and number of seeds per pod.
The path coefficient analysis revealed that days to maturity, number of clusters per plant, 100-seed weight, and number of pods per plant all had significant direct effects at the genotypic level. Pod length, number of pods per cluster and 100-seed weight at the genotypic level. These characters also exhibited significant and positive association with seed yield per plant.
Future scope
The findings from the correlation analysis and path coefficient analysis provide a foundation for future research and breeding programs aimed at improving crop yield. These identified trait associations and their relationships with yield can be further explored to unravel the underlying genetic mechanisms and physiological processes involved. This could involve investigating specific genes or molecular pathways that influence these traits and yield. Additionally, conducting field trials and genetic studies on diverse germplasm can help validate the observed correlations and explore new trait combinations for yield enhancement.
Acknowledgement
AcknowledgementMSY, MS-conceptualization, planning, execution, supervisor, editing if review of the manuscript, Data analysis & Visualization; YK-genotype data curation and draft review and performed phenotypic data analysis.
Figures and tables from the paper
| Trait | Days to 50% flowering | Days to maturity | Plant height | Primary branches | Clusters/ plant | Pods/ cluster | Pods/ plant | Pod length | Seeds/ pod | 100- seed weight | Protein content | Seed yield/ plant |
|---|---|---|---|---|---|---|---|---|---|---|---|---|
| Days to 50% flowering | 1 ** | 0.8028 ** | -0.4234* | -0.1903 | -0.3076 | -0.2826 | 0.1594 | -0.3843 * | 0.21 | 0.1937 | -0.3261 | -0.269 |
| Days to maturity | 1 ** | -0.5094** | -0.3009 | -0.3916 * | -0.4225 * | 0.0902 | -0.4675** | 0.2136 | 0.3937 * | -0.4416 ** | -0.2551 | |
| Plant height | 1 ** | -0.0779 | -0.0012 | -0.0827 | -0.3063 | 0.5272** | -0.3078 | -0.3896* | 0.03 | -0.0751 | ||
| Primary branches | 1 ** | 0.5194 ** | 0.564 ** | -0.043 | 0.3859 * | -0.0917 | 0.0936 | 0.3576** | 0.5779 ** | |||
| Number of clusters/ plant | 1 ** | 0.8812 ** | -0.1471 | 0.4071 * | -0.1559 | 0.0661 | 0.5103** | 0.6012 ** | ||||
| Number of pods/cluster | 1 ** | 0.0121 | 0.3023 | -0.0229 | -0.0306 | 0.5669** | 0.6216 ** | |||||
| Number of pods/plant | 1 ** | -0.4411** | 0.3619 * | 0.2161 | 0.0444 | 0.0423 | ||||||
| Pod length | 1 ** | -0.4379** | -0.3021 | 0.492** | 0.5061 ** | |||||||
| Number of seeds per pod | 1 ** | 0.3066 | -0.3546 * | -0.1489 | ||||||||
| 100-seed weight | 1 ** | -0.1278 | 0.1888 | |||||||||
| Protein content | 1 ** | 0.5497 ** | ||||||||||
| Seed yield per plant | 1 ** |
Table text extracted from the original PDF; superscript letters are shown inline. The original table image is below.
View original table image
| Trait | Days to 50% flowering | Days to maturity | Plant height | Number of primary branches | Number of clusters per plant | Number of pods per cluster | Number of pods per plant | Pod length | Number of seeds per pod | 100-seed weight | Protein content | Seed yield/plant |
|---|---|---|---|---|---|---|---|---|---|---|---|---|
| Days to 50% flowering | -0.77007 | 0.79841 | 0.06185 | -0.05381 | -0.25804 | 0.02605 | 0.03074 | -0.02738 | -0.18768 | 0.09184 | -0.04655 | -0.3347 |
| Days to maturity | -0.70411 | 0.8732 | 0.06063 | -0.0646 | -0.34868 | 0.03564 | 0.01098 | -0.02432 | -0.23161 | 0.13102 | -0.05409 | -0.316 |
| Plant height | 0.51941 | -0.57733 | -0.0917 | -0.04099 | 0.04505 | -0.00075 | -0.09456 | 0.0297 | 0.25292 | -0.09254 | 0.04165 | -0.0091 |
| Number of primary branches | 0.20049 | -0.27293 | 0.01819 | 0.20669 | 0.18751 | -0.06718 | 0.01134 | 0.01965 | 0.17751 | 0.08089 | 0.06893 | 1.025 ** |
| Number of clusters per plant | 0.31004 | -0.47505 | -0.00645 | 0.18751 | 0.64093 | -0.07273 | -0.04141 | 0.02557 | 0.19182 | -0.06454 | 0.06131 | 0.757 ** |
| Number of pods per cluster | 0.27744 | -0.43046 | -0.00095 | 0.19206 | 0.64477 | -0.0723 | -0.01256 | 0.0197 | 0.10623 | -0.06008 | 0.06543 | 0.7293 ** |
| Number of pods per plant | -0.08581 | 0.03474 | 0.03144 | 0.0085 | -0.09622 | 0.00329 | 0.27583 | -0.02889 | -0.23407 | 0.07631 | -0.00447 | -0.0194 |
| Pod length | 0.46504 | -0.46837 | -0.06005 | 0.08956 | 0.36136 | 0.3023 | -0.17575 | 0.04535 | 0.45893 | -0.12667 | 0.05718 | 0.6152 * |
| Number of seeds per pod | -0.30767 | 0.43053 | 0.04937 | -0.07811 | -0.26173 | 0.01635 | 0.13744 | -0.0443 | -0.46974 | 0.11455 | -0.07217 | -0.4855 |
| 100-seed weight | -0.25495 | 0.41245 | 0.03059 | 0.06028 | -0.14911 | 0.01566 | 0.07588 | -0.02071 | -0.19399 | 0.27739 | -0.06281 | 0.1907 |
| Protein content | 0.44867 | -0.59119 | -0.04781 | 0.17834 | 0.49192 | 0.5669 | -0.01544 | 0.03246 | 0.42438 | -0.21809 | 0.07989 | 0.7239 ** |
Table text extracted from the original PDF; superscript letters are shown inline. The original table image is below.
View original table image
References
5 in the original paper- Bisht IS, Bhat KV, Lakhanpaul S, Latha M, Jayan PK, Biswas BK, et al. Diversity and genetic resources of wild Vigna species in India. Genet Resour Crop Evol. 2005;52(1):53-68.
- Datta A, Truong D, Minhas P, Parra LC, Bikson M. Inter-individual variation during transcranial direct current stimulation and normalization of dose using MRI-derived computational models. Front Psychiatry. 2012;3:91.
- Degefa I, Petros Y, Andargie M. Genetic variability, heritability and genetic advance in mung bean (Vigna radiata L. Wilczek) accessions. Horizon. 2014;1(2):9498.
- Dhayal LS, Sastry ED, Jakhar ML. Genetic architecture of yield and its component traits in bread wheat (Triticum aestivum L.) grown under saline and normal environments. Indian J Genet Plant Breed. 2003;63(4):335-336.
- Reddy NS, Sharma RK. Variability and interrelationships for yield characters and protein content in inbred lines of bajra; 1982.