
Research article · 2026 · Full text
International Journal of Advanced Chemistry ResearchTemperature dependence of viscosity and activation energy of viscous flow in ethanol-water binary liquid mixtures
Volume 8(8) · Pages 04–06 · DOI: 10.33545/26646781.2026.v8.i8a.724 ↗
Research areasThermodynamic properties of mixturesDiffusion Coefficients in LiquidsMaterial Dynamics and Properties
Abstract
Author-writtenThe viscosity of ethanol-water binary mixtures was measured over the entire composition range (mole fraction of ethanol, x = 0.0-1.0) and over the temperature interval 293.15-318.15 K using an Ostwald-type capillary viscometer. Viscosity passed through a pronounced maximum near x = 0.4, exceeding the viscosity of either pure component by more than a factor of two, a result attributed to the formation of hydrogen-bonded ethanol-water complexes that hinder molecular flow more effectively than either pure liquid alone. The temperature dependence of viscosity at each composition obeyed the Arrhenius-type equation for viscous flow, η = A·exp(Ea/RT), allowing the activation energy of viscous flow, Ea, to be determined from the slope of ln η versus 1/T plots. The activation energy likewise showed a maximum (18.7 kJ mol⁻¹) near x = 0.4, mirroring the viscosity maximum and providing further evidence that the energy barrier to molecular flow is largest where hydrogen-bonded network formation between ethanol and water is most extensive. The excess Gibbs energy of activation for viscous flow, calculated from deviations of ln η from ideal mixing behaviour, was positive across the entire composition range, consistent with strong negative deviations from Raoult's law reported previously for this system. These results provide a physicochemical rationale, grounded in transport theory and intermolecular association, for the well-known anomalous viscosity behaviour of ethanol-water mixtures.
Summary
Source-checkedPlain-language reading of the full paper, prepared with AI and checked against the text. Each point links to the authors' own words.
Why it matters
- Mixtures of water and short-chain alcohols are of significant interest because they exhibit highly non-ideal physicochemical behavior. View evidence ↗
- Viscosity serves as a sensitive tool for studying structural reorganization in these mixtures because it directly reflects the strength and duration of intermolecular interactions. View evidence ↗
- The activation energy of viscous flow (Ea) represents the energy barrier a molecule must overcome to move within the liquid, providing mechanistic insight into the system. View evidence ↗
The question
- The study aims to establish a clear relationship between hydrogen bonding and the dynamics of viscous flow in ethanol-water mixtures. View evidence ↗
What they did
- The researchers used HPLC grade absolute ethanol (99.9%) and deionized water to create mixtures with ethanol mole fractions (x) of 0.0, 0.2, 0.4, 0.6, 0.8, and 1.0. View evidence ↗
- Viscosity measurements were performed using a calibrated Ostwald-type capillary viscometer in a water bath with a temperature control of ±0.05 K. View evidence ↗
- For each composition, flow times were recorded in triplicate across six temperatures ranging from 293.15 to 318.15 K in 5 K increments. View evidence ↗
- The activation energy (Ea) was determined by applying the Arrhenius-type equation and calculating the slope of ln η versus 1/T plots. View evidence ↗
What they found
- Viscosity reached a significant maximum near an ethanol mole fraction of x = 0.4, where it was more than twice as high as the viscosity of either pure component. View evidence ↗
- The Arrhenius plots for all compositions were linear with R² values greater than 0.995, indicating that viscous flow is a thermally activated process. View evidence ↗
- The activation energy reached a maximum of 18.7 kJ mol⁻¹ near x = 0.4, following the same trend as the viscosity. View evidence ↗
- The activation energy was 15.8 kJ mol⁻¹ for pure water (x=0.0) and decreased to 10.4 kJ mol⁻¹ for pure ethanol (x=1.0). View evidence ↗
- The excess Gibbs energy of activation for viscous flow (ΔG*E) was positive across all compositions and peaked near x = 0.4. View evidence ↗
What it means
- The authors conclude that the maxima in viscosity and activation energy at x = 0.4 provide evidence for the formation of hydrogen-bonded clusters that hinder molecular flow more than in pure liquids. View evidence ↗
- The positive excess Gibbs energy of activation supports the cluster formation model and aligns with previously reported non-ideal thermodynamic behavior of the system. View evidence ↗
Visual summary
2 visualsIllustrations explain the paper; charts are replotted from the paper's own table values.
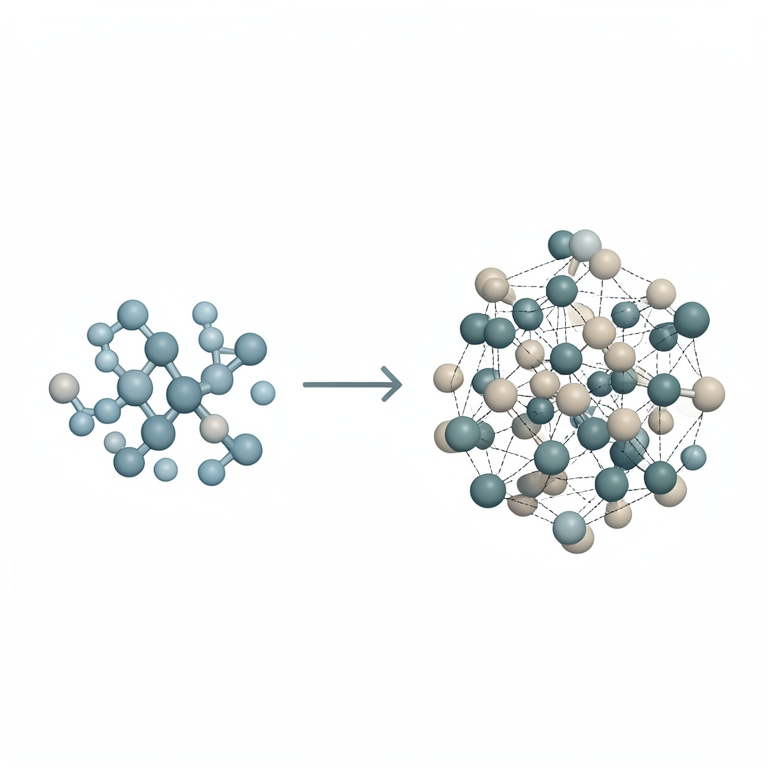
Hydrogen-Bonded Cluster Model
AI-generated conceptual illustration (ethanol and water molecules in a binary liquid mixture). It explains the idea and does not show study data.
View source evidence ↗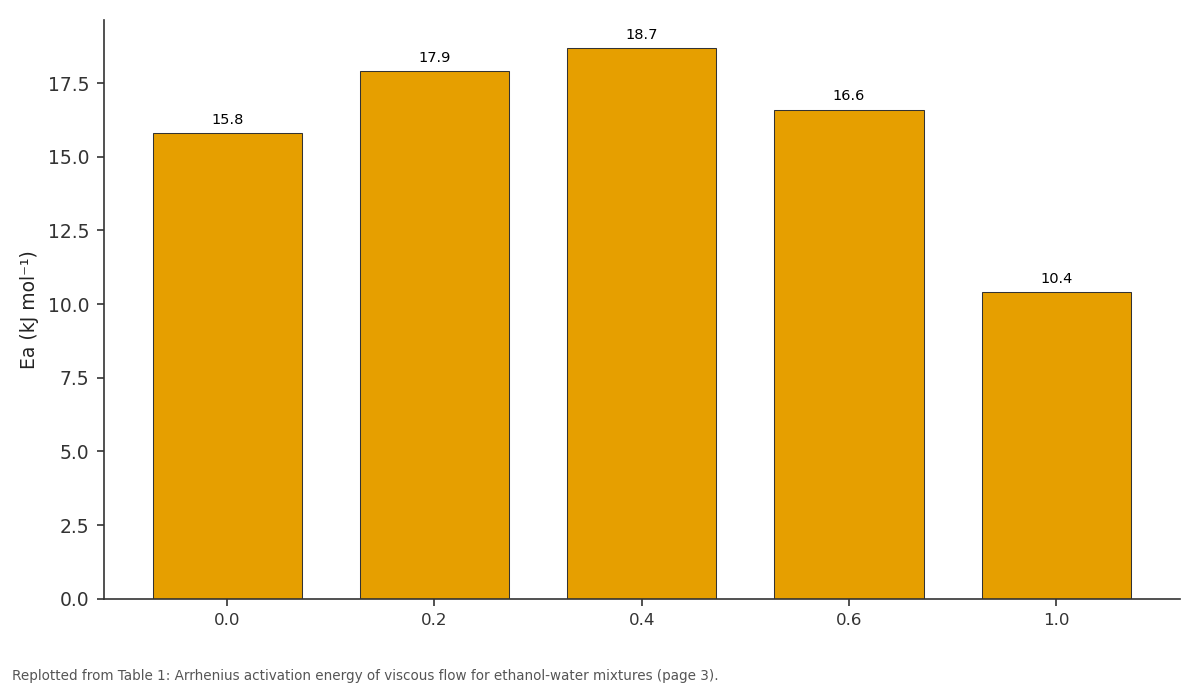
Ea (kJ mol⁻¹): 0.0 vs 0.2 vs 0.4 vs 0.6 vs 1.0
Replotted from Table 1 (page 3) of the original paper. Every bar is the paper's own table value.
View source evidence ↗Figures & tables
From the original paper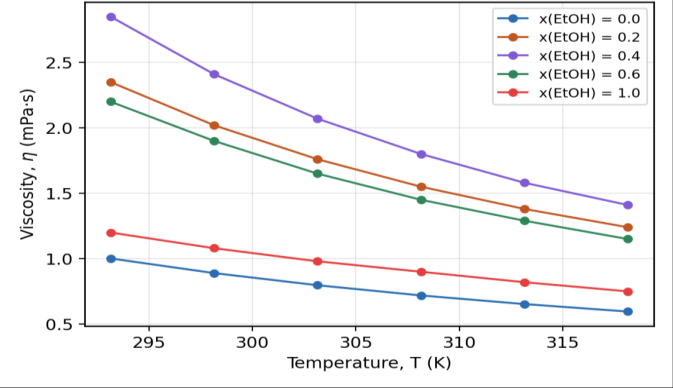 Figure 1
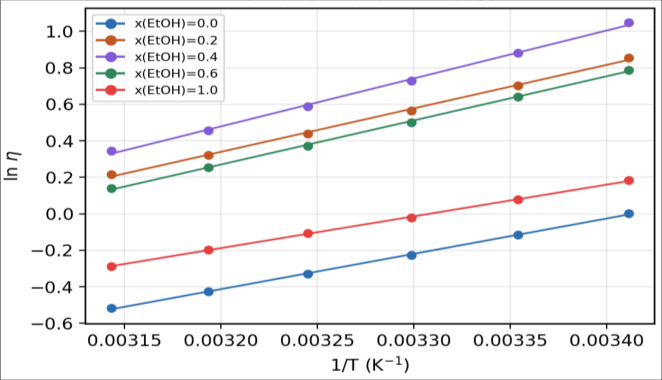 Figure 2
 Table 1
Introduction
Binary mixtures of water with short-chain alcohols display markedly non-ideal physicochemical behaviour that has attracted sustained interest since the earliest systematic studies of solution thermodynamics. Properties such as excess volume, viscosity deviation, and excess Gibbs energy of mixing all show pronounced extrema as a function of composition, behaviour that is generally attributed to structural reorganisation of the hydrogen-bonded network of water in the presence of the amphiphilic alcohol molecule. Viscosity is a particularly sensitive probe of this reorganisation because it depends directly on the strength and lifetime of intermolecular interactions that resist relative motion between adjacent liquid layers. The temperature dependence of viscosity provides additional mechanistic information through the activation energy of viscous flow, Ea, which may be interpreted within Eyring's absolute rate theory as the energy barrier a molecule must overcome to move from one quasilattice site to a neighbouring vacant site in the liquid. A composition-dependent activation energy therefore reflects how the local energetic environment around a flowing molecule changes as the ethanol-water ratio is varied, and it complements static thermodynamic excess functions by describing the dynamic, non-equilibrium aspect of the same intermolecular interactions. Although the viscosity of ethanol-water mixtures has been reported in the literature at discrete temperatures, a systematic combined analysis of viscosity and activation energy across the full composition and temperature range, framed explicitly in terms of transport theory, remains a useful pedagogical and research exercise in physical chemistry.
Interna tional Jo urna l o f Adva nced Chemistry Research 2026 ; 8(8 ): 0 4-06
The present study reports such a dataset and analysis, aimed at establishing a clear structure-property relationship between hydrogen bonding and the dynamics of viscous flow in this archetypal associated liquid mixture.
Materials and Methods
Materials and Methods
Materials
Absolute ethanol (99.9%, HPLC grade) and deionised water (conductivity < 2 μS cm⁻¹) were used to prepare mixtures of known mole fraction (x = 0.0, 0.2, 0.4, 0.6, 0.8, 1.0) by mass, with compositions verified by density measurement against literature reference values.
Viscosity measurement
Viscosities were measured using a calibrated Ostwald-type capillary viscometer immersed in a thermostatted water bath controlled to ±0.05 K. Flow times were recorded in triplicate at each of six temperatures (293.15-318.15 K in 5 K increments) for every composition, and the kinematic viscosity was converted to dynamic viscosity using density values measured with a digital density meter. The viscometer constant was determined by calibration against deionised water using literature reference viscosities.
Results and Discussion
Results and Discussion
Composition and temperature dependence of viscosity
Figure 1 shows the measured viscosity of ethanol-water mixtures as a function of temperature for five representative compositions. At every temperature studied, viscosity increased from the pure-water value, passed through a maximum near x = 0.4, and then decreased towards the pure-ethanol value, in agreement with the well-established anomalous behaviour of this system. The viscosity maximum is markedly higher than either pure-component value at all temperatures, indicating that mixing water and ethanol in this ratio produces a more structured, higherfriction liquid than either pure liquid. This behaviour is rationalised by the formation of relatively long-lived hydrogen-bonded clusters in which ethanol molecules are incorporated into, and reinforce, the threedimensional hydrogen-bonded network of water through their hydroxyl groups while their hydrophobic ethyl groups pack alongside neighbouring alcohol molecules. Such clustering increases the effective size and reduces the mobility of the flowing kinetic units, raising the macroscopic viscosity above that expected from a simple, ideal mixing rule.
Activation energy of viscous flow
Arrhenius plots of ln η against 1/T (Figure 2) were linear at every composition (R² > 0.995), confirming that viscous flow in these mixtures can be described as a simple thermally activated process over the temperature range studied. The activation energies extracted from the slopes are summarised in Table 1. The activation energy passes through a maximum of 18.7 kJ mol⁻¹ near x = 0.4, closely mirroring the composition dependence of the viscosity itself. This parallel behaviour supports the interpretation that the same hydrogen-bonded clustering responsible for the viscosity maximum also raises the energy barrier that a molecule must surmount to move to an adjacent site during flow. Away from this composition, in both the water-rich and ethanol-rich regions, the activation energy decreases towards the respective purecomponent values, consistent with progressive breakdown of the mixed hydrogen-bonded structure as either component becomes dilute.
| x(ethanol) | Ea (kJ mol⁻¹) | ln A | R² |
|---|---|---|---|
| 0.0 | 15.8 | -6.02 | 0.997 |
| 0.2 | 17.9 | -6.55 | 0.996 |
| 0.4 | 18.7 | -6.71 | 0.995 |
| 0.6 | 16.6 | -6.19 | 0.997 |
| 1.0 | 10.4 | -4.62 | 0.998 |
Table text extracted from the original PDF; superscript letters are shown inline. The original table image is below.
View original table image
Excess thermodynamic quantities
Deviations of ln η from the value expected for ideal (molefraction weighted) mixing were positive across the whole composition range and reached a maximum near x = 0.4, corresponding to a positive excess Gibbs energy of activation for viscous flow, ΔG*E. A positive ΔG*E is generally taken as further evidence of specific, attractive interactions (here, hydrogen bonding) between unlike molecules that are stronger than the average of the interactions in the two pure liquids, consistent with the negative deviations from Raoult's law widely reported for this system.
Conclusion
The viscosity of ethanol-water mixtures and its temperature dependence were measured across the full composition range and analysed within the framework of Arrhenius/Eyring transport theory. Both the viscosity and the activation energy of viscous flow exhibit pronounced maxima near x(ethanol) = 0.4, providing self-consistent dynamic evidence for the formation of hydrogen-bonded ethanol-water clusters that impede molecular flow more strongly than in either pure liquid. The positive excess Gibbs energy of activation for viscous flow across the composition range corroborates this picture and is consistent with the known non-ideal thermodynamics of this system. This work illustrates how simple transport measurements, combined with rate theory, can be used to probe molecular association in binary liquid mixtures.
References
10 in the original paper- Eyring H. Viscosity, plasticity, and diffusion as examples of absolute reaction rates. J Chem Phys. 1936;4:283-291.
- Glasstone S, Laidler KJ, Eyring H. The Theory of Rate Processes. New York: McGraw-Hill; 1941.
- Kestin J, Sokolov M, Wakeham WA. Viscosity of liquid water in the range -8 to 150 °C. J Phys Chem Ref Data. 1978;7:941-948.
- Khattab IS, Bandarkar F, Fakhree MAA, Jouyban A. Density, viscosity, and surface tension of water + ethanol mixtures. Korean J Chem Eng. 2012;29:812817.
- Gonzalez B, Calvar N, Gomez E, Dominguez A. Density, dynamic viscosity, and derived properties of binary mixtures of methanol or ethanol with water. J Chem Thermodyn. 2007;39:1578-1588.
- Atkins P, de Paula J. Physical Chemistry. 10th ed. Oxford: Oxford University Press; 2014.
- Franks F, Ives DJG. The structural properties of alcohol-water mixtures. Q Rev Chem Soc. 1966;20:144.
- Vazquez G, Alvarez E, Navaza JM. Surface tension of alcohol + water from 20 to 50 °C. J Chem Eng Data. 1995;40:611-614.
- Marcus Y. Ion Solvation. Chichester: Wiley; 1985.
- Egorov GI, Makarov DM, Kolker AM. Densities and volumetric properties of ethanol-water mixtures. J Chem Thermodyn. 2013;62:87-97.