
Research article · 2026 · Full text
International Journal of Agriculture and NutritionInfluence of Fertilizer Levels and Integrated Plant Nutrient System (IPNS) on Productivity and Soil Fertility of Groundnut during Kharif
Volume 8(8) · Pages 12–19 · DOI: 10.33545/26646064.2026.v8.i8a.730 ↗
Research areasAgricultural Science and FertilizationAgriculture, Plant Science, Crop ManagementPlant Growth and Agriculture Techniques
Abstract
Author-writtenA long-term field experiment initiated during 2020 was conducted during kharif, 2025 to evaluate the effect of fertilizer levels and Integrated Plant Nutrient System (IPNS) on yield, soil nutrient status, nutrient content in plant and microbial population of groundnut. The experiment consisted of 10 treatments including 100% RDF, yield target approaches with chemical fertilizers alone, yield target approaches with IPNS, FYM @ 10 t ha⁻¹ and nutrient omission treatments. The results revealed significant variation among treatments for pod yield, haulm yield, soil nutrient status and microbial population. Among all treatments, T4 (Yield Target of 12 q ha⁻¹ with IPNS) recorded the highest pod yield (793 kg ha⁻¹) and haulm yield (1573 kg ha⁻¹), which were significantly superior to the control (407 and 887 kg ha⁻¹, respectively). Treatment T4 also recorded higher plant nitrogen (3.0%) and potassium (1.8%) contents, indicating better nutrient uptake under integrated nutrient management. The highest available soil nitrogen (217.20 kg ha⁻¹) was observed in T7 (RDN and RDK), whereas maximum phosphorus (38.69 kg ha⁻¹) and potassium (212.20 kg ha⁻¹) were recorded in T1 and T9, respectively. Soil microbial population was markedly influenced by fertilizer treatments. Application of FYM @ 10 t ha⁻¹ (T6) resulted in the highest bacterial population (187 × 10⁷ CFU g⁻¹ soil) and actinomycetes population (22 × 10³ CFU g⁻¹ soil), while the highest fungal population (17 × 10² CFU g⁻¹ soil) was recorded with 100% RDF (T1). The experimental data showed acceptable precision with CV values ranging from 5.94 to 18.68 per cent for different parameters. The study concluded that IPNS-based yield targeting improved productivity, nutrient availability and soil biological health, thereby sustaining soil fertility and groundnut production under kharif conditions.
Summary
Source-checkedPlain-language reading of the full paper, prepared with AI and checked against the text. Each point links to the authors' own words.
Why it matters
- Groundnut is a critical oilseed crop grown widely in India and other tropical or subtropical areas. View evidence ↗
- Intensive farming without replacing nutrients leads to degraded soil fertility and lower crop yields. View evidence ↗
- Combining organic manures with inorganic fertilizers can improve nutrient efficiency and maintain soil fertility. View evidence ↗
The question
- The study aimed to determine how different fertilizer levels and an Integrated Plant Nutrient System (IPNS) affect groundnut yield, nutrient status, and soil microbial populations. View evidence ↗
What they did
- The research was part of a long-term field experiment started in 2020, with data for this report collected during the kharif 2025 season at the Agricultural Research Station in Utukur. View evidence ↗
- Ten treatments were tested, including 100% Recommended Dose of Fertilizers (RDF), yield-target methods using only chemicals or IPNS, farmyard manure (FYM) at 10 t ha⁻¹, and treatments where specific nutrients were omitted. View evidence ↗
- Researchers measured pod and haulm yields, plant and seed nutrient content, post-harvest soil nutrients, and microbial populations, analyzing the data via ANOVA at a 5% significance level. View evidence ↗
What they found
- The highest pod yield was 793 kg ha⁻¹ under T4 (Yield Target of 12 q ha⁻¹ with IPNS), which significantly outperformed most treatments, including the control (T10) at 407 kg ha⁻¹. View evidence ↗
- T4 (Yield Target of 12 q ha⁻¹ with IPNS) also produced the highest haulm yield at 1573 kg ha⁻¹, compared to the lowest yield of 887 kg ha⁻¹ in the control group. View evidence ↗
- Post-harvest soil available nitrogen was highest in T7 (RDN and RDK) at 217.20 kg ha⁻¹, significantly exceeding all other treatments. View evidence ↗
- Post-harvest soil phosphorus peaked in T1 (100% RDF) at 38.69 kg ha⁻¹ and was lowest in T7 at 22.04 kg ha⁻¹. View evidence ↗
- Post-harvest soil potassium was highest in T9 (RDP and RDK) at 212.20 kg ha⁻¹ and lowest in T5 at 132.23 kg ha⁻¹. View evidence ↗
- Seed nitrogen content was highest in T6 (FYM @ 10 t ha⁻¹) at 4.20% and lowest in the control (T10) at 3.16%. View evidence ↗
- The highest bacterial population was found in T6 (FYM @ 10 t ha⁻¹) at 187 × 10⁷ CFU g⁻¹ soil, while the control had the lowest at 125 × 10⁷ CFU g⁻¹ soil. View evidence ↗
- Fungal populations were highest in T1 (17 × 10² CFU g⁻¹ soil) and lowest in T2 (11 × 10² CFU g⁻¹ soil). View evidence ↗
- Actinomycetes populations peaked in T6 at 22 × 10³ CFU g⁻¹ soil and were lowest in the control at 10 × 10³ CFU g⁻¹ soil. View evidence ↗
What it means
- The authors conclude that yield target-based IPNS is an effective and sustainable strategy for improving groundnut productivity and soil health. View evidence ↗
- The authors recommend promoting the integration of organic manures with inorganic fertilizers to ensure sustainable production and soil health. View evidence ↗
Visual summary
3 visualsIllustrations explain the paper; charts are replotted from the paper's own table values.
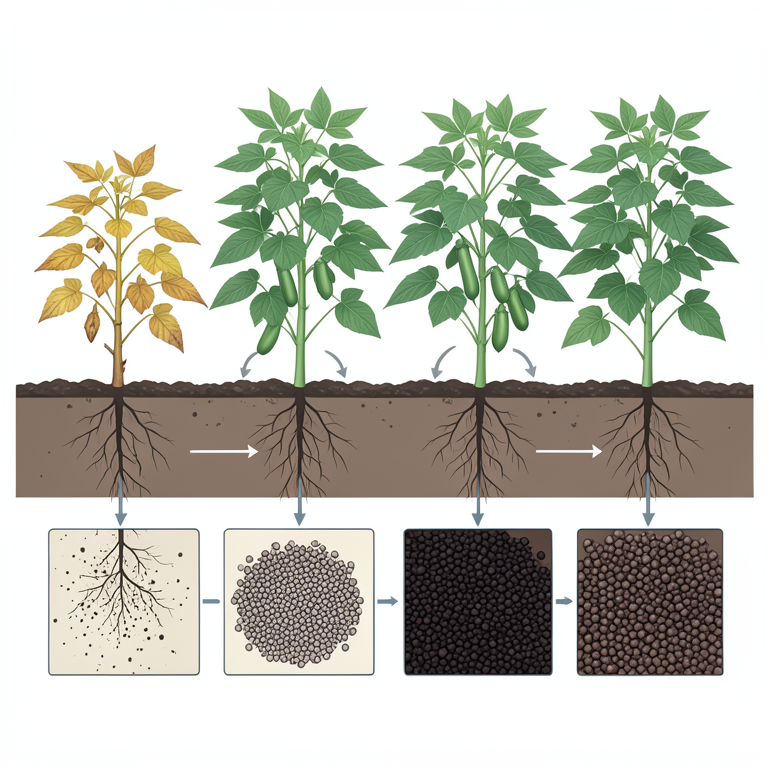
Experimental Treatment Framework
AI-generated conceptual illustration (groundnut plants (Arachis hypogaea) in soil). It explains the idea and does not show study data.
View source evidence ↗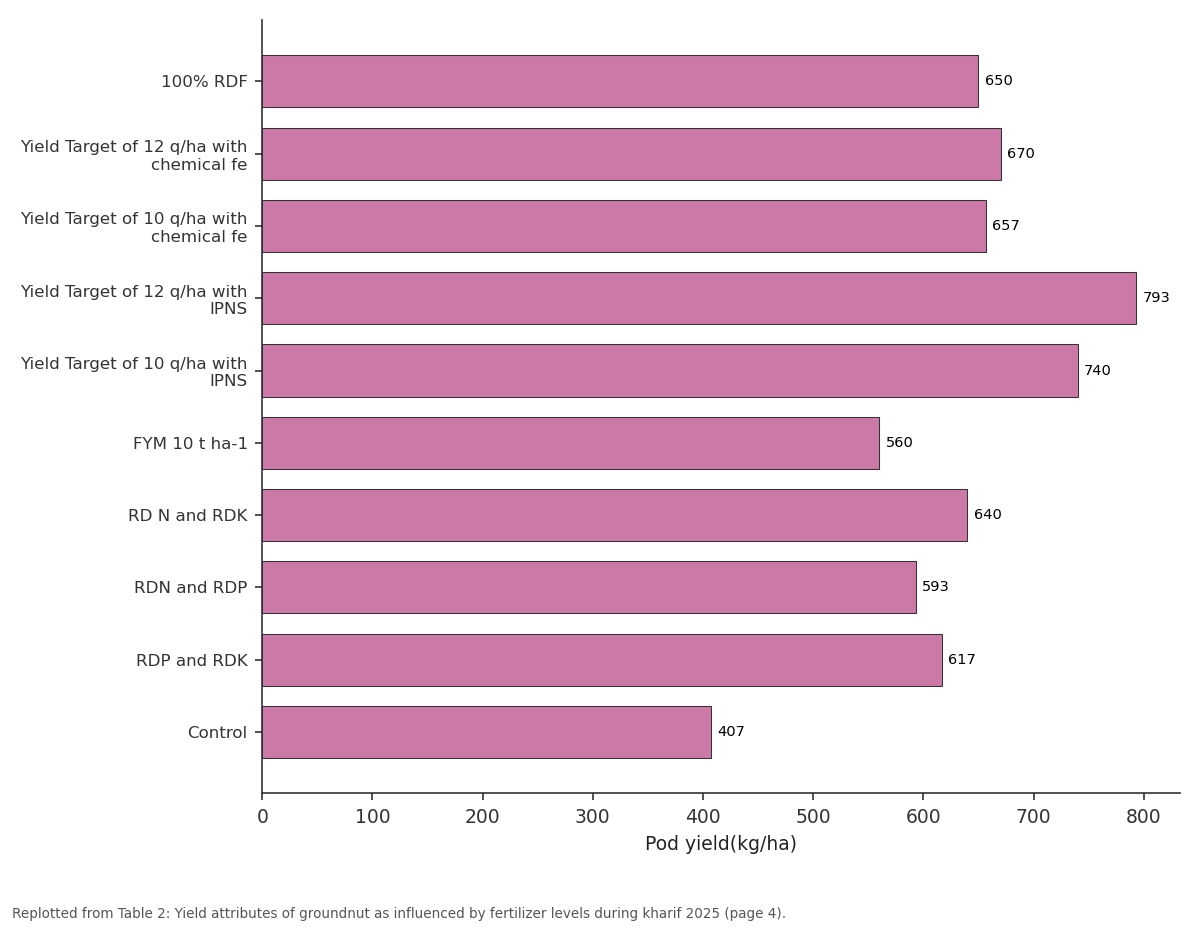
Pod yield(kg/ha): 100% RDF vs Yield Target of 12 q/ha... vs Yield Target of 10 q/ha... vs Yield Target of 12 q/ha... vs Yield Target of 10 q/ha...
Replotted from Table 2 (page 4) of the original paper. Every bar is the paper's own table value.
View source evidence ↗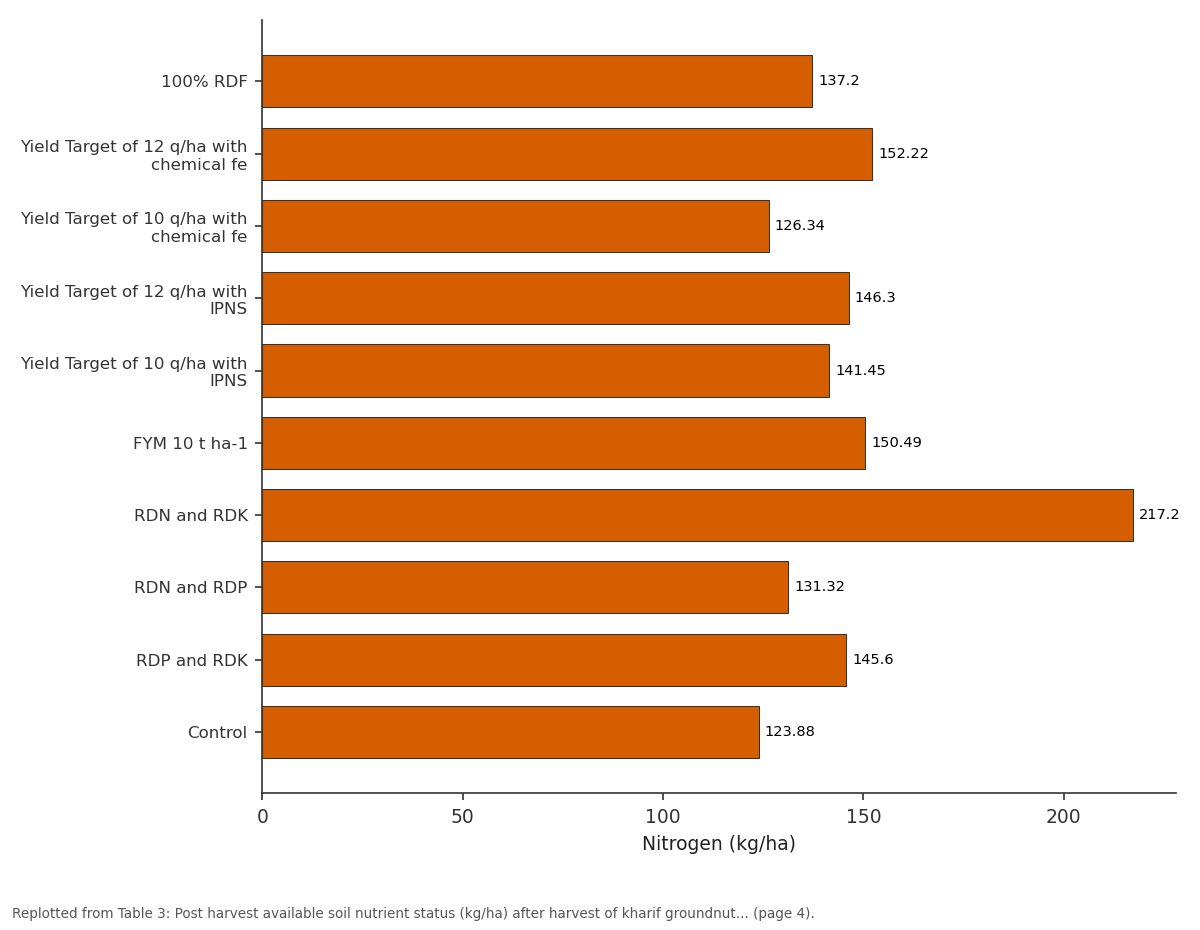
Nitrogen: 100% RDF vs Yield Target of 12 q/ha... vs Yield Target of 10 q/ha... vs Yield Target of 12 q/ha... vs Yield Target of 10 q/ha...
Replotted from Table 3 (page 4) of the original paper. Every bar is the paper's own table value.
View source evidence ↗Figures & tables
From the original paper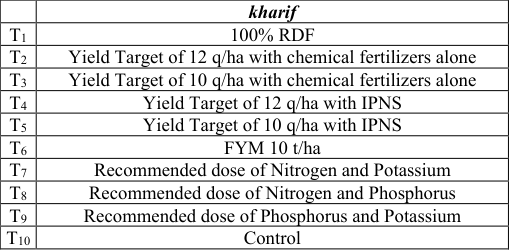 Table 1
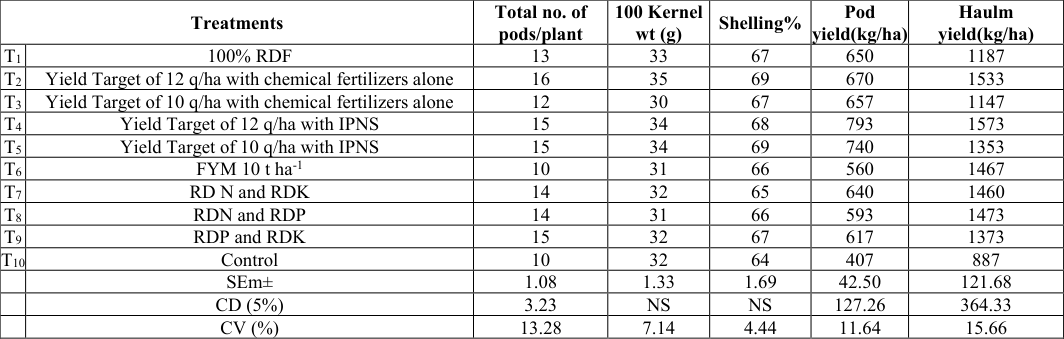 Table 2
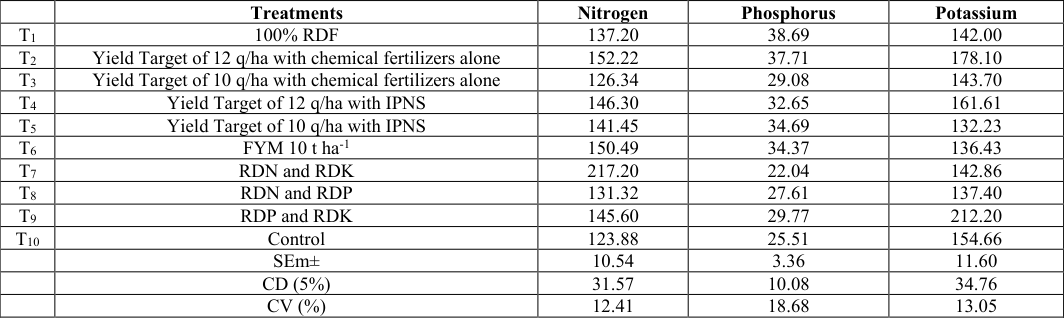 Table 3
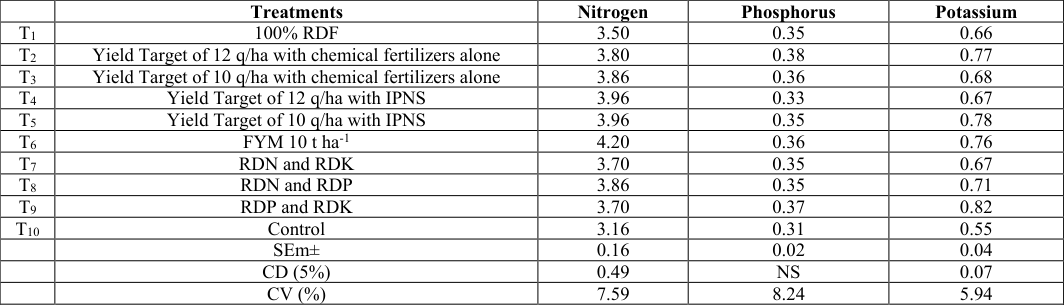 Table 4
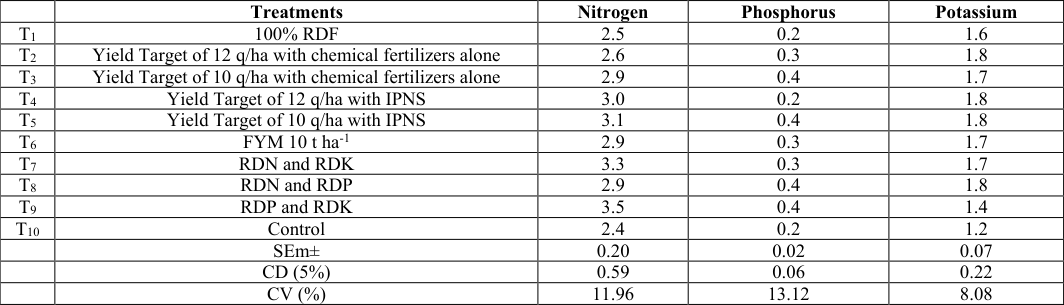 Table 5
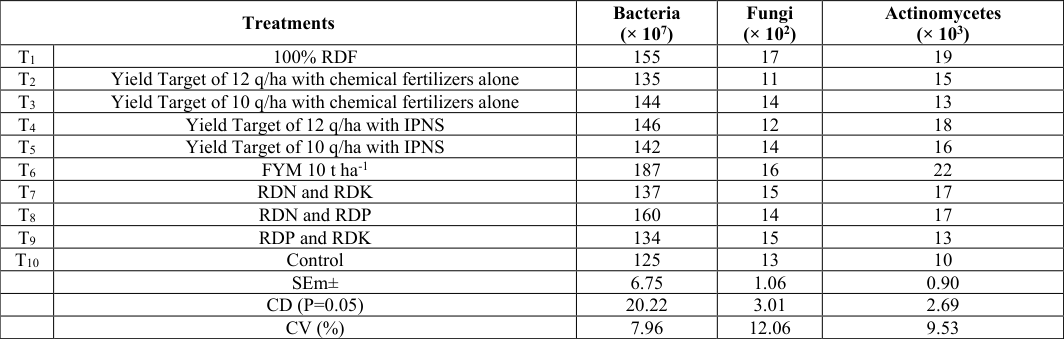 Table 6
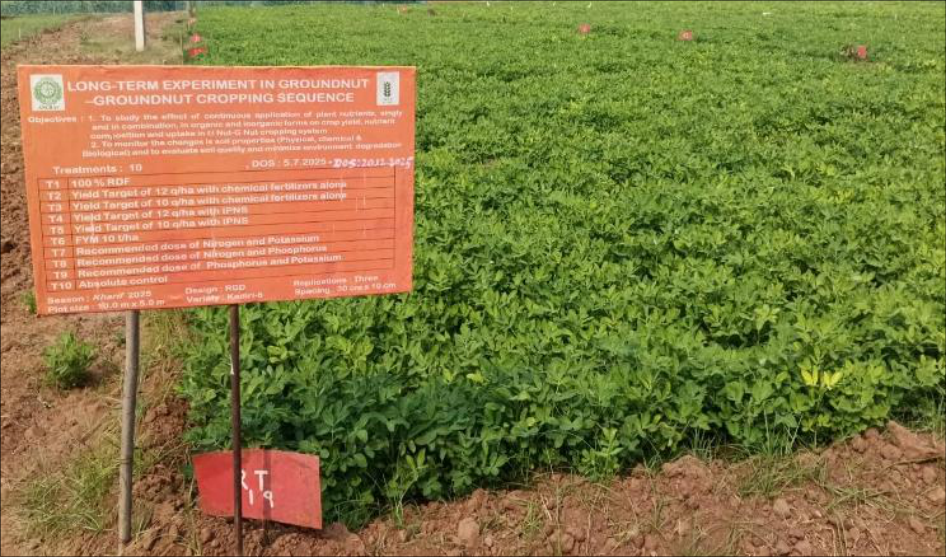 Figure 1
 Figure 2
Introduction
Soil is one of the most important natural resources that supports agricultural productivity and environmental sustainability. Soil quality is defined as the integrated effect of physical, chemical and biological properties of soil that determine its capacity to function effectively for crop production while maintaining environmental health. Good soil quality not only ensures higher crop productivity but also sustains plant, animal and human health. However, with the advancement of intensive agriculture, soils are being degraded at an alarming rate due to erosion, nutrient depletion, salinization and continuous exploitation for short-term productivity gains. Continuous cultivation without adequate replenishment of nutrients has resulted in deterioration of soil fertility and decline in crop productivity (Ghosh et al., 2003) [7] . Groundnut (Arachis hypogaea L.) is one of the most important oilseed crops cultivated extensively in India and other tropical and subtropical regions of the world. It is valued for its edible oil, protein-rich kernels and nutritious haulm used as fodder. India occupies a prominent position in groundnut cultivation; however, productivity remains relatively low due to imbalanced nutrient management, declining soil fertility and poor soil biological health (Kumar et al., 2021) [10] . Groundnut is a nutrient exhaustive crop requiring balanced application of nutrients for optimum vegetative growth, nodulation, peg penetration, pod development and kernel filling (Patel et al., 2020) [14] . Deficiency of essential nutrients significantly reduces nutrient uptake, dry matter accumulation and yield attributes, ultimately leading to lower pod yield (Ramesh et al., 2022) [18] . Recent studies have indicated that continuous use of chemical fertilizers alone may deteriorate soil physical, chemical and biological properties, whereas integrated nutrient management improves nutrient availability, soil organic carbon and microbial activity (Meena et al., 2021) [12] . Integrated application of organic manures along with inorganic fertilizers enhances nutrient use efficiency and sustains soil fertility under intensive cropping systems (Srinivasarao et al., 2023) [21] . Balanced nutrition through Integrated Plant Nutrient System (IPNS) has also been reported to improve nutrient uptake, pod yield and quality parameters in groundnut while maintaining long-term soil productivity (Reddy et al., 2020) [19] . Therefore, adoption of integrated nutrient management practices is essential for sustaining groundnut productivity and soil health under modern agricultural systems. Integrated Plant Nutrient System (IPNS) has emerged as a sustainable approach for maintaining soil fertility and improving crop productivity through the combined use of organic and inorganic nutrient sources. Integration of farmyard manure (FYM) with chemical fertilizers enhances nutrient availability, improves nutrient synchronization and stimulates beneficial microbial activity in soil (Meena et al., 2021) [12] . Several recent studies have reported that integrated nutrient management significantly improves soil organic carbon, available nutrient status and biological properties of soil compared to sole application of chemical fertilizers (Kumar et al., 2022; Srinivasarao et al., 2023) [11,21] . Yield target-based nutrient management is another efficient strategy that supplies nutrients according to crop demand and desired productivity levels, thereby increasing fertilizer use efficiency and reducing nutrient losses (Patel et al., 2021) [15] . Soil microbial population plays a vital role in nutrient cycling, decomposition of organic matter and maintenance of soil fertility. Beneficial microorganisms such as bacteria, fungi and actinomycetes contribute to mineralization, nutrient solubilization and improved nutrient availability to crops. Application of organic manures along with inorganic fertilizers creates favorable conditions for microbial proliferation and enhances soil biological health (Ramesh et al., 2022) [18] . Recent findings also indicated that integrated nutrient management practices significantly enhance microbial biomass carbon, enzymatic activity and rhizospheric microbial population in oilseed cropping systems (Singh et al., 2020; Verma et al., 2024) [20,24] . Considering the importance of balanced nutrient management for sustaining productivity and soil health, the present investigation was undertaken during kharif, 2025 to study the effect of fertilizer levels and Integrated Plant Nutrient System (IPNS) on yield, nutrient status and microbial population of groundnut. The study aimed to evaluate the effectiveness of yield target-based nutrient management approaches in improving crop productivity and maintaining soil fertility under groundnut cultivation.
Material and Methods
Material and Methods
Experimental Site
A long-term field experiment initiated during 2020 was conducted at the Agricultural Research Station, Utukur to study the effect of fertilizer levels and Integrated Plant Nutrient System (IPNS) on yield, nutrient status and microbial population of groundnut. The present investigation pertains to the kharif, 2025 season of the ongoing long-term experiment planned for duration of ten years to evaluate the sustainability of nutrient management practices on crop productivity and soil health. Observations on pod yield, haulm yield, nutrient content of plant and seed, post-harvest soil available nutrients and soil microbial population were recorded during kharif, 2025 and statistically analyzed using analysis of variance (ANOVA) at 5 per cent level of significance. The details of the treatments listed in
Soil Nutrient Analysis Available Nitrogen (N)
Soil available nitrogen was estimated by alkaline permanganate method as described by Subbiah and Asija (1956) [22] and was expressed in kg ha -1 .
Available Phosphorus (P)
Soil available phosphorus was extracted by using 0.5M NaHCO 3 adjusted to pH 8.5 (Olsen et al., 1954) [13] and color intensity was read in spectrophotometer at 660 nm and was expressed in kg ha -1 .
Available Potassium (K)
Soil available potassium was extracted with neutral normal ammonium acetate and the K content was determined using flame photometer systronics model 121 as described by Jackson (1967) [8] and was expressed in kg ha -1 .
Collection of Seed Samples
Seed samples were collected after the harvest of crop and processed as given by Chapman (1964) [6] . The seed samples were used for estimation of nitrogen, phosphorus, potassium.
Seed Analysis
One gram of oven dry seed sample was digested with 10 ml of diacid mixture (Nitric acid and Perchloric acid in 10:4 ratio). The digested seed samples diluted to known volume with double distilled water and filtered (Jackson, 1967) [8] . This filtrate was used for the estimation of P, K adopting the standard procedures mentioned below.
Total Nitrogen (N)
The Nitrogen content of seed sample was estimated by Microkjeldahl method (A.O.A.C. 1970) [1] and expressed in percentage.
Phosphorus (P)
The phosphorus concentration in diacid extract was determined by Vanadomolybdo phosphoric yellow colour method by using spectrophotometer (Jasco V-530 UV visible spectrophotometer) at 470 nm wavelength (Jackson, 1973) [9] and expressed in percentage.
Potassium (K)
The concentration of potassium in diacid extract was determined using the flame photometer (systronics flame photometer 128) (Jackson, 1967) [8] and expressed in percentage.
Microbial analysis
Each composite soil sample was air dried, processed with the help of pestle and mortar, passed through 2 mm sieve and used for the analysis of biological properties. The count of microorganisms (bacteria, fungi and actinomycetes) was carried out by using serial dilution pour plate method (Wollum, 1982) [25] . Isolation of microorganisms was carried out after harvest of crop and standard plate count (SPC) was performed as given by Pelczar et al., (2003) [17] . Ten-fold serial dilutions were made up to 10-5. An amount of 0.1 ml from the diluted samples was spread on soil extract agar (pH 7; for bacteria) and soil extract with 0.1% (w/v) malt agar plates (pH 5.5; for fungi and actinomycetes) using a glass spreader. Petri plates were then incubated at ambient temperature (30-40ºC) for 24 h for bacteria and 4-5 days for fungi. The isolates were maintained on respective media slants. Prevalence of different groups of microorganisms was calculated in terms of percentage. These isolates were identified on the basis of conventional cultural and morphological characteristics (Buchanan & Gibbons, 1986; Barnett & Hunter, 1998; Barnett, 1960; Thom & Raper, 1945) [2,4,5,3,23] .
Results and Discussion
Yield Attributes Total Number of Pods per Plant Significant differences were observed among treatments with respect to total number of pods per plant. The highest total number of pods per plant (16) was recorded in T 2 (Yield Target of 12 q ha⁻¹ with chemical fertilizers alone).
Treatments T 4 , T 5 and T 9 recorded 15 pods per plant each and were statistically comparable. Treatments T 7 and T 8 recorded 14 pods per plant, while T 1 recorded 13 pods per plant. Treatment T 3 produced 12 pods per plant. The lowest number of pods per plant (10) was observed in T 6 and T 10 . The higher number of pods under yield target-based nutrient management treatments might be due to improved nutrient availability and better reproductive growth. The SEm± and CD (5%) values were 1.08 and 3.23, respectively, with a CV of 13.28 per cent, presented in Table .2.
100-Kernel Weight (gms)
The 100-kernel weight ranged from 30 to 35 g among different treatments. The highest 100-kernel weight (35 g) was recorded in T 2 (Yield Target of 12 q ha⁻¹ with chemical fertilizers alone), followed by T 4 and T 5 with 34 g each.
Treatment T 1 recorded 33 g, while T 7 , T 9 and T 10 recorded 32 g each. Treatments T 6 and T 8 recorded 31 g, whereas the lowest 100-kernel weight (30 g) was observed in T 3 . Although numerical differences were observed among treatments, the variations were found to be statistically nonsignificant. The SEm± value was 1.33 and the CV was 7.14 per cent, presented in Table .2.
Shelling percentage varied from 64 to 69 per cent among the treatments. The highest shelling percentage (69%) was recorded in T 2 and T 5 , followed by T 4 with 68 per cent.
Treatments T 1 , T 3 and T 9 recorded 67 per cent shelling, while T 6 and T 8 recorded 66 per cent. Treatment T 7 recorded 65 per cent shelling percentage, whereas the lowest value (64%) was observed in the control treatment (T 10 ). The higher shelling percentage under integrated nutrient management treatments may be due to better kernel development and efficient translocation of assimilates towards pods. However, differences among treatments were statistically non-significant. The SEm± value was 1.69 and the CV was 4.44 per cent, presented in Table .2.
Groundnut pod yield was significantly influenced by different fertilizer levels and Integrated Plant Nutrient System (IPNS) treatments during kharif, 2025. Among all the treatments, T 4 (Yield Target of 12 q ha⁻¹ with IPNS) recorded the highest pod yield of 793 kg ha⁻¹ and was found to be significantly superior to most of the treatments. The higher pod yield under T 4 may be attributed to balanced nutrient supply through integrated use of organic and inorganic nutrient sources, which improved nutrient availability and uptake throughout the crop growth period. The next highest pod yield was recorded in T 5 (Yield Target of 10 q ha⁻¹ with IPNS) with 740 kg ha⁻¹, followed by T 2 (Yield Target of 12 q ha⁻¹ with chemical fertilizers alone) with 670 kg ha⁻¹. Treatment T 3 (Yield Target of 10 q ha⁻¹ with chemical fertilizers alone) recorded a pod yield of 657 kg ha⁻¹, which was comparable with T 1
Phosphorus content in seed ranged from 0.31 to 0.38 per cent. The highest phosphorus content (0.38%) was recorded in T 2 , followed by T 9 (0.37%). Although numerical differences existed among treatments, the variations were statistically non-significant. Improved phosphorus uptake under fertilizer-applied treatments may be due to enhanced phosphorus availability in soil. The SEm± and CV values were 0.02 and 8.24 per cent, respectively, presented in Table .4.
Potassium content in seed was significantly influenced by fertilizer treatments. The highest potassium content (0.82%) was recorded in T 9 , followed by T 5 (0.78%) and T 2 (0.77%).
The lowest potassium content (0.55%) was observed in the control treatment. Higher potassium concentration under balanced fertilization and integrated nutrient management may be due to improved nutrient availability and efficient translocation of potassium to seeds. The SEm±, CD (5%) and CV values were 0.04, 0.07 and 5.94 per cent, respectively, presented in Table .4.
Nitrogen content in plant after harvest was significantly influenced by nutrient management practices. The highest nitrogen content (3.5%) was recorded in T 9 , followed by T 7 (3.3%). Treatments under IPNS also maintained comparatively higher nitrogen content, while the lowest value (2.4%) was recorded in the control treatment. Enhanced nitrogen uptake under integrated nutrient management may be attributed to improved nutrient availability and root growth. The SEm±, CD (5%) and CV values were 0.20, 0.59 and 11.96 per cent, respectively, presented in Table .5.
Plant phosphorus content differed significantly among treatments. The highest phosphorus content (0.4%) was recorded in T 3 , T 5 , T 8 and T 9 , whereas lower values (0.2%) were observed in T 1 , T 4 and T 10 . Improved phosphorus content under balanced fertilization and IPNS treatments may be due to enhanced phosphorus solubilization and uptake. The SEm±, CD (5%) and CV values were 0.02, 0.06 and 13.12 per cent, respectively, presented in Table .5.
Potassium content in plant was significantly influenced by fertilizer treatments. Treatments T 2 , T 4 , T 5 and T 8 recorded the highest potassium content (1.8%), while the lowest value (1.2%) was observed in the control treatment. Integrated nutrient management improved potassium uptake due to balanced fertilization and better soil biological activity. The SEm±, CD (5%) and CV values were 0.07, 0.22 and 8.08 per cent, respectively, presented in Table .5. The results of the present investigation clearly indicated that fertilizer levels and Integrated Plant Nutrient System (IPNS) significantly influenced yield attributes, pod and haulm yield, post-harvest soil nutrient status, nutrient content in plant and seed, and soil microbial population of groundnut during kharif, 2025 under the long-term experiment initiated in 2020. The superiority of integrated nutrient management treatments over sole chemical fertilization emphasized the importance of balanced nutrient supply for sustaining productivity and soil health. Among the treatments, T 4 (Yield Target of 12 q ha⁻¹ with IPNS) recorded the highest number of filled pods per plant, pod yield and haulm yield. The improved performance under IPNS treatments may be attributed to synchronized nutrient release from organic and inorganic sources, resulting in better nutrient availability during critical growth stages. Integrated application of FYM along with fertilizers might have improved soil physical properties, root growth and nutrient uptake efficiency, thereby enhancing reproductive growth and biomass accumulation. Similar findings were reported by Kumar et al. (2021) [10] and Srinivasarao et al. (2023) [21] , who observed higher yield and nutrient uptake in groundnut under integrated nutrient management practices. The lower yields observed in nutrient omission treatments and control plots highlighted the importance of balanced fertilization for optimum crop growth and pod development. Patel et al. (2022) [16] also reported that omission of major nutrients significantly reduced pod yield and dry matter production in groundnut.
Post-harvest soil nutrient status was significantly affected by fertilizer treatments. Higher available nitrogen in T 7 (RDN and RDK) may be due to lower nitrogen utilization under phosphorus omission. Integrated nutrient management treatments maintained comparatively higher soil nutrient availability because of gradual mineralization of organic matter and improved nutrient retention. Similar results were reported by Meena et al. (2021) [12] and Verma et al. (2024) [24] , who observed improvement in residual soil fertility under long-term integrated nutrient management systems. Nutrient content in plant and seed was also improved under IPNS and FYM treatments. Higher nitrogen and potassium contents indicated enhanced nutrient uptake and efficient translocation under balanced fertilization. Ramesh et al. (2022) [18] similarly reported increased nutrient concentration and uptake in groundnut under combined application of organic and inorganic nutrient sources. Soil microbial population responded positively to organic manure application. T 6 (FYM @ 10 t ha⁻¹) recorded the highest bacterial and actinomycetes populations, indicating enhanced microbial activity due to increased organic carbon availability. Higher microbial population under integrated nutrient management treatments confirmed the beneficial effect of combined nutrient application on soil biological health. Similar observations were reported by Singh et al. (2020) [20] and Verma et al. (2024) [24] . Overall, the study demonstrated that long-term IPNS practices improved crop productivity, soil fertility and microbial activity, thereby supporting sustainable groundnut production.
Conclusion
The findings of the present investigation revealed that fertilizer levels and Integrated Plant Nutrient System (IPNS) significantly influenced yield attributes, pod yield, haulm yield, soil nutrient status, nutrient content and microbial population of groundnut during kharif, 2025 under the ongoing long-term experiment initiated in 2020. Among all the treatments, T 4 (Yield Target of 12 q ha⁻¹ with IPNS) proved superior by recording the highest pod yield and haulm yield, indicating the effectiveness of integrated nutrient management in enhancing crop productivity. Integrated application of FYM and inorganic fertilizers improved nutrient availability, nutrient uptake and balanced crop nutrition, which ultimately enhanced reproductive growth and yield performance. Post-harvest soil nutrient status and microbial population were also considerably improved under integrated nutrient management and FYM application treatments. The higher bacterial, fungal and actinomycetes populations under FYM and IPNS treatments indicated enhanced soil biological activity and improved soil health. The study clearly demonstrated that sole dependence on chemical fertilizers is less effective in sustaining productivity and soil fertility compared to integrated nutrient management approaches. Overall, the results suggest that yield target-based IPNS is an effective and sustainable nutrient management strategy for improving groundnut productivity, maintaining soil fertility and enhancing soil biological health under longterm cultivation systems. Hence, integration of organic manures with inorganic fertilizers should be promoted for sustainable groundnut production and long-term soil health management.
Figures and tables from the paper
| — | kharif |
|---|---|
| T1 | 100% RDF |
| T2 | Yield Target of 12 q/ha with chemical fertilizers alone |
| T3 | Yield Target of 10 q/ha with chemical fertilizers alone |
| T4 | Yield Target of 12 q/ha with IPNS |
| T5 | Yield Target of 10 q/ha with IPNS |
| T6 | FYM 10 t/ha |
| T7 | Recommended dose of Nitrogen and Potassium |
| T8 | Recommended dose of Nitrogen and Phosphorus |
| T9 | Recommended dose of Phosphorus and Potassium |
| T10 | Control |
Table text extracted from the original PDF; superscript letters are shown inline. The original table image is below.
View original table image
| Treatments | — | Total no. of pods/plant | 100 Kernel wt (g) | Shelling% | Pod yield(kg/ha) | Haulm yield(kg/ha) |
|---|---|---|---|---|---|---|
| T1 | 100% RDF | 13 | 33 | 67 | 650 | 1187 |
| T2 | Yield Target of 12 q/ha with chemical fertilizers alone | 16 | 35 | 69 | 670 | 1533 |
| T3 | Yield Target of 10 q/ha with chemical fertilizers alone | 12 | 30 | 67 | 657 | 1147 |
| T4 | Yield Target of 12 q/ha with IPNS | 15 | 34 | 68 | 793 | 1573 |
| T5 | Yield Target of 10 q/ha with IPNS | 15 | 34 | 69 | 740 | 1353 |
| T6 | FYM 10 t ha-1 | 10 | 31 | 66 | 560 | 1467 |
| T7 | RD N and RDK | 14 | 32 | 65 | 640 | 1460 |
| T8 | RDN and RDP | 14 | 31 | 66 | 593 | 1473 |
| T9 | RDP and RDK | 15 | 32 | 67 | 617 | 1373 |
| T10 | Control | 10 | 32 | 64 | 407 | 887 |
| SEm± | 1.08 | 1.33 | 1.69 | 42.50 | 121.68 | |
| CD (5%) | 3.23 | NS | NS | 127.26 | 364.33 | |
| CV (%) | 13.28 | 7.14 | 4.44 | 11.64 | 15.66 |
Table text extracted from the original PDF; superscript letters are shown inline. The original table image is below.
View original table image
| — | Treatments | Nitrogen | Phosphorus | Potassium |
|---|---|---|---|---|
| T1 | 100% RDF | 137.20 | 38.69 | 142.00 |
| T2 | Yield Target of 12 q/ha with chemical fertilizers alone | 152.22 | 37.71 | 178.10 |
| T3 | Yield Target of 10 q/ha with chemical fertilizers alone | 126.34 | 29.08 | 143.70 |
| T4 | Yield Target of 12 q/ha with IPNS | 146.30 | 32.65 | 161.61 |
| T5 | Yield Target of 10 q/ha with IPNS | 141.45 | 34.69 | 132.23 |
| T6 | FYM 10 t ha-1 | 150.49 | 34.37 | 136.43 |
| T7 | RDN and RDK | 217.20 | 22.04 | 142.86 |
| T8 | RDN and RDP | 131.32 | 27.61 | 137.40 |
| T9 | RDP and RDK | 145.60 | 29.77 | 212.20 |
| T10 | Control | 123.88 | 25.51 | 154.66 |
| SEm± | 10.54 | 3.36 | 11.60 | |
| CD (5%) | 31.57 | 10.08 | 34.76 | |
| CV (%) | 12.41 | 18.68 | 13.05 |
Table text extracted from the original PDF; superscript letters are shown inline. The original table image is below.
View original table image
| — | Treatments | Nitrogen | Phosphorus | Potassium |
|---|---|---|---|---|
| T1 | 100% RDF | 3.50 | 0.35 | 0.66 |
| T2 | Yield Target of 12 q/ha with chemical fertilizers alone | 3.80 | 0.38 | 0.77 |
| T3 | Yield Target of 10 q/ha with chemical fertilizers alone | 3.86 | 0.36 | 0.68 |
| T4 | Yield Target of 12 q/ha with IPNS | 3.96 | 0.33 | 0.67 |
| T5 | Yield Target of 10 q/ha with IPNS | 3.96 | 0.35 | 0.78 |
| T6 | FYM 10 t ha-1 | 4.20 | 0.36 | 0.76 |
| T7 | RDN and RDK | 3.70 | 0.35 | 0.67 |
| T8 | RDN and RDP | 3.86 | 0.35 | 0.71 |
| T9 | RDP and RDK | 3.70 | 0.37 | 0.82 |
| T10 | Control | 3.16 | 0.31 | 0.55 |
| SEm± | 0.16 | 0.02 | 0.04 | |
| CD (5%) | 0.49 | NS | 0.07 | |
| CV (%) | 7.59 | 8.24 | 5.94 |
Table text extracted from the original PDF; superscript letters are shown inline. The original table image is below.
View original table image
| — | Treatments | Nitrogen | Phosphorus | Potassium |
|---|---|---|---|---|
| T1 | 100% RDF | 2.5 | 0.2 | 1.6 |
| T2 | Yield Target of 12 q/ha with chemical fertilizers alone | 2.6 | 0.3 | 1.8 |
| T3 | Yield Target of 10 q/ha with chemical fertilizers alone | 2.9 | 0.4 | 1.7 |
| T4 | Yield Target of 12 q/ha with IPNS | 3.0 | 0.2 | 1.8 |
| T5 | Yield Target of 10 q/ha with IPNS | 3.1 | 0.4 | 1.8 |
| T6 | FYM 10 t ha-1 | 2.9 | 0.3 | 1.7 |
| T7 | RDN and RDK | 3.3 | 0.3 | 1.7 |
| T8 | RDN and RDP | 2.9 | 0.4 | 1.8 |
| T9 | RDP and RDK | 3.5 | 0.4 | 1.4 |
| T10 | Control | 2.4 | 0.2 | 1.2 |
| SEm± | 0.20 | 0.02 | 0.07 | |
| CD (5%) | 0.59 | 0.06 | 0.22 | |
| CV (%) | 11.96 | 13.12 | 8.08 |
Table text extracted from the original PDF; superscript letters are shown inline. The original table image is below.
View original table image
| Treatments | — | Bacteria (× 107) | Fungi (× 102) | Actinomycetes (× 103) |
|---|---|---|---|---|
| T1 | 100% RDF | 155 | 17 | 19 |
| T2 | Yield Target of 12 q/ha with chemical fertilizers alone | 135 | 11 | 15 |
| T3 | Yield Target of 10 q/ha with chemical fertilizers alone | 144 | 14 | 13 |
| T4 | Yield Target of 12 q/ha with IPNS | 146 | 12 | 18 |
| T5 | Yield Target of 10 q/ha with IPNS | 142 | 14 | 16 |
| T6 | FYM 10 t ha-1 | 187 | 16 | 22 |
| T7 | RDN and RDK | 137 | 15 | 17 |
| T8 | RDN and RDP | 160 | 14 | 17 |
| T9 | RDP and RDK | 134 | 15 | 13 |
| T10 | Control | 125 | 13 | 10 |
| SEm± | 6.75 | 1.06 | 0.90 | |
| CD (P=0.05) | 20.22 | 3.01 | 2.69 | |
| CV (%) | 7.96 | 12.06 | 9.53 |
Table text extracted from the original PDF; superscript letters are shown inline. The original table image is below.
View original table image
References
25 in the original paper- Association of Official Agricultural Chemists. Official and tentative methods of analysis. Washington, DC: Association of Official Analytical Chemists; 1970.
- Buchanan RE, Gibbons NE. Bergey's manual of determinative bacteriology. 12th ed. Baltimore: The Williams and Wilkins Company; 1986.
- Barnett HL. Illustrated genera of imperfect fungi. 2nd ed. Burgess Publishing Company; 1960.
- Barnett HL, Hunter BB. Illustrated genera of imperfect fungi. 4th ed. St. Paul, Minnesota: APS Press; 1998. International Journal of Agriculture and Nutrition https://www.agriculturejournal.net
- Barnett HL, Hunter BB. Illustrated genera of imperfect fungi. 4th ed. St. Paul, Minnesota, USA: APS Press; 1998.
- Chapman HD. Suggested foliar sampling and handling techniques for determining the nutrient status of some field horticultural and plantation crops. Indian Journal of Horticulture. 1964;21:97-102.
- Ghosh PK, Bandopadhyay KK, Misra AK, Rao AS. Balanced fertilization and nutrient management for sustainable crop production in Indian agriculture. Fertilizer News. 2003;48(12):21-28.
- Jackson ML. Soil chemical analysis. New Delhi: Prentice Hall of India Pvt. Ltd.; 1967. p. 498.
- Jackson ML. Soil chemical analysis. Bombay: Oxford and IBH Publishing House; 1973. p. 38.
- Kumar R, Singh AK, Yadav RK. Effect of integrated nutrient management on yield, nutrient uptake and quality of groundnut (Arachis hypogaea L.). Journal of Oilseed Research. 2021;38(2):145-150.
- Kumar S, Meena BP, Sharma RP. Integrated nutrient management for improving soil fertility and crop productivity under intensive cropping systems. Indian Journal of Agricultural Sciences. 2022;92(4):512-517.
- Meena BL, Choudhary RS, Verma HP. Influence of integrated nutrient management on soil fertility and productivity of groundnut. Legume Research. 2021;44(9):1075-1080.
- Olsen SR, Cole CV, Watanabe FS, Dean LA. Estimation of available phosphorus by extraction with sodium bicarbonate. Washington, DC: USDA; 1954. Circular No. 939.
- Patel GN, Solanki RM, Chaudhary JH. Nutrient management in groundnut for higher productivity and quality: a review. International Journal of Chemical Studies. 2020;8(5):1845-1850.
- Patel HK, Patel PM, Prajapati SK. Yield target based fertilizer recommendation and nutrient use efficiency in groundnut. Journal of Pharmacognosy and Phytochemistry. 2021;10(1):1765-1769.
- Patel VK, Kumar D, Singh RP. Effect of nutrient omission on growth, yield and nutrient uptake of groundnut under irrigated conditions. The Pharma Innovation Journal. 2022;11(4):1520-1525.
- Pelczar MJ Jr, Chan ECS, Krieg NR. Microbiology. 5th ed. New Delhi: Tata McGraw-Hill Publishing Company Limited; 2003.
- Ramesh T, Srinivasulu M, Rao PC. Effect of integrated nutrient management on nutrient uptake, yield and quality of groundnut. International Journal of Plant and Soil Science. 2022;34(20):84-92.
- Reddy GC, Reddy MS, Reddy KS. Integrated nutrient management practices for sustainable groundnut production and soil health. Andhra Agricultural Journal. 2020;67(3):245-250.
- Singh R, Kumar V, Yadav DS. Long-term effect of integrated nutrient management on soil microbial properties and productivity in oilseed-based cropping systems. Journal of Environmental Biology. 2020;41(5):1152-1158.
- Srinivasarao C, Venkateswarlu B, Lal R. Integrated nutrient management for sustaining soil health and crop productivity under rainfed farming systems. Indian Journal of Fertilisers. 2023;19(2):126-134.
- Subbiah BV, Asija GL. A rapid procedure for the estimation of available nitrogen in soils. Current Science. 1956;25:259-260.
- Thom C, Raper KB. A manual of the Aspergilli. USA: The Williams and Wilkins Company; 1945.
- Verma S, Meena MC, Sharma SK. Long-term integrated nutrient management improves soil fertility, microbial activity and crop productivity in semi-arid agroecosystems. Archives of Agronomy and Soil Science. 2024;70(3):421-435.
- Wollum AG. Cultural methods for soil microorganisms. In: Page AL, Millar RH, Keeney DR, editors. Methods of soil analysis. Part 2: Chemical and microbiological properties. Agronomy Monograph No. 9. Madison, Wisconsin, USA: ASA-SSSA; 1982. p. 781-814.