
Research article · 2026 · Full text
International Journal of Agriculture and NutritionOptimizing stocking density and dietary protein level for cage culture of common carp (Cyprinus carpio L.) in the Euphrates River, Babylon, Iraq
Volume 8(8) · Pages 25–34 · DOI: 10.33545/26646064.2026.v8.i8a.732 ↗
Research areasAquaculture Nutrition and GrowthAquaculture disease management and microbiotaFish Biology and Ecology Studies
Abstract
Author-writtenCage culture in Iraqi rivers has expanded rapidly, yet stocking density and dietary crude protein (CP) content the two variables that most strongly govern biological performance and profitability are still chosen by convention rather than from evidence generated under local river conditions. A 120-day factorial experiment (1 April - 1 August 2025) evaluated three stocking densities (70, 90 and 120 fish m3) and two practical diets (16% and 25% CP), each in triplicate (18 cages of 18 m3), in the Euphrates River at Al-Hamiya (Al-Musaib district, Babylon Governorate, Iraq), using common carp of ~100 g initial weight. Water temperature ranged from 18.5 to 28.6 °C, dissolved oxygen from 7.75 to 8.15 mg L and pH from 7.4 to 7.9. Cumulative mortality did not exceed 1.9% in any treatment and ceased after the first month. Individual growth declined monotonically with density and improved with dietary protein: final weight was highest at 70 fish m3 on 25% CP (1043.5 g; SGR 1.95% day; FCR 2.26) and lowest at 120 fish m3 on 16% CP (861.5 g; SGR 1.79% day; FCR 2.36). Protein efficiency ratio ranked in reverse, being higher on the low-protein diet (2.52-2.58 vs 1.70-1.76), indicating more efficient protein use when protein was limiting. Net production per unit volume reversed this ranking, increasing with density, peaking at 96.06 kg m3 (1728.99 kg cage) at 120 fish m3 with 25% CP. Net income per cubic metre followed net production, rising from 152.12 to 230.40 thousand IQD m3. The optimum therefore depends on the production objective: 70 fish m3 with 25% CP maximises individual size and feed efficiency, whereas 120 fish m3 with 25% CP maximises volumetric yield and net income per cage under the price structure prevailing at the site.
Summary
Source-checkedPlain-language reading of the full paper, prepared with AI and checked against the text. Each point links to the authors' own words.
Why it matters
- Common carp is a widely farmed freshwater species valued for its market position, ability to use low-cost diets, and tolerance of varying water quality. View evidence ↗
- While cage culture has grown quickly in Iraq, key factors like stocking density and dietary protein are typically decided by convention rather than local evidence. View evidence ↗
The question
- The study aimed to determine how three stocking densities (70, 90, and 120 fish/m³) and two protein levels (16% and 25%) affect the growth, survival, and economics of common carp to find both biological and financial optima. View evidence ↗
What they did
- The 120-day experiment used 18 cages (18 m³ each) in the Euphrates River, testing three densities and two diets in triplicate with carp starting at approximately 100 g. View evidence ↗
- Fish were fed four times daily at a rate of 5-6% of their body weight per day using mechanical feeders. View evidence ↗
- The researchers used a completely randomized design and analyzed the data with SAS, applying Duncan's multiple range test for significance at P ≤ 0.05. View evidence ↗
What they found
- Survival was high across all groups, ranging from 98.08% to 99.17%, with the highest mortality occurring at the highest stocking density (120 fish/m³). View evidence ↗
- The best feed conversion ratio (2.26) was achieved at 70 fish/m³ with 25% protein, while the worst ratios (up to 2.36) occurred at higher densities with 16% protein. View evidence ↗
- Protein was used more efficiently on the low-protein diet (PER 2.523-2.579) compared to the high-protein diet (PER 1.703-1.756), regardless of stocking density. View evidence ↗
- Volumetric yield increased with density, peaking at 96.06 kg/m³ (1728.99 kg/cage) for the 120 fish/m³ group on the 25% protein diet. View evidence ↗
- Net income per cubic meter rose as density increased, reaching a maximum of 230.40 thousand IQD/m³ at 120 fish/m³ with 25% protein. View evidence ↗
- Neither the stocking density nor the dietary protein level had a significant effect on the muscle composition of the fish. View evidence ↗
What it means
- The authors conclude that 120 fish/m³ with 25% protein is best for maximizing total yield and income, while 70 fish/m³ with 25% protein is best for individual fish size and feed efficiency. View evidence ↗
- The study was limited by being conducted at a single site for one season and by the lack of measurements for total ammonia nitrogen and nitrite. View evidence ↗
Visual summary
3 visualsIllustrations explain the paper; charts are replotted from the paper's own table values.
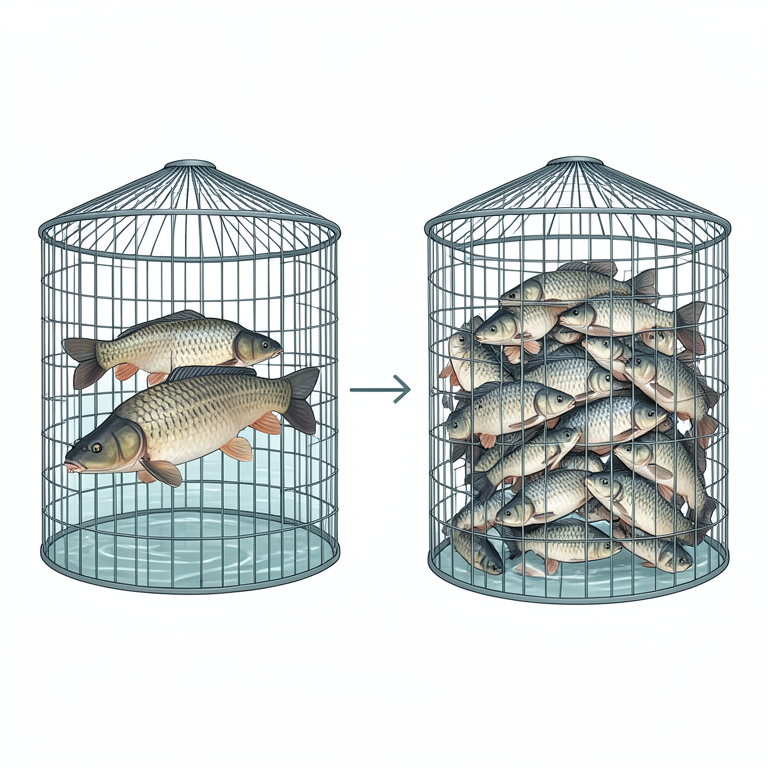
Trade-off between Individual Growth and Volumetric Yield
AI-generated conceptual illustration (common carp (Cyprinus carpio L.) in cage culture). It explains the idea and does not show study data.
View source evidence ↗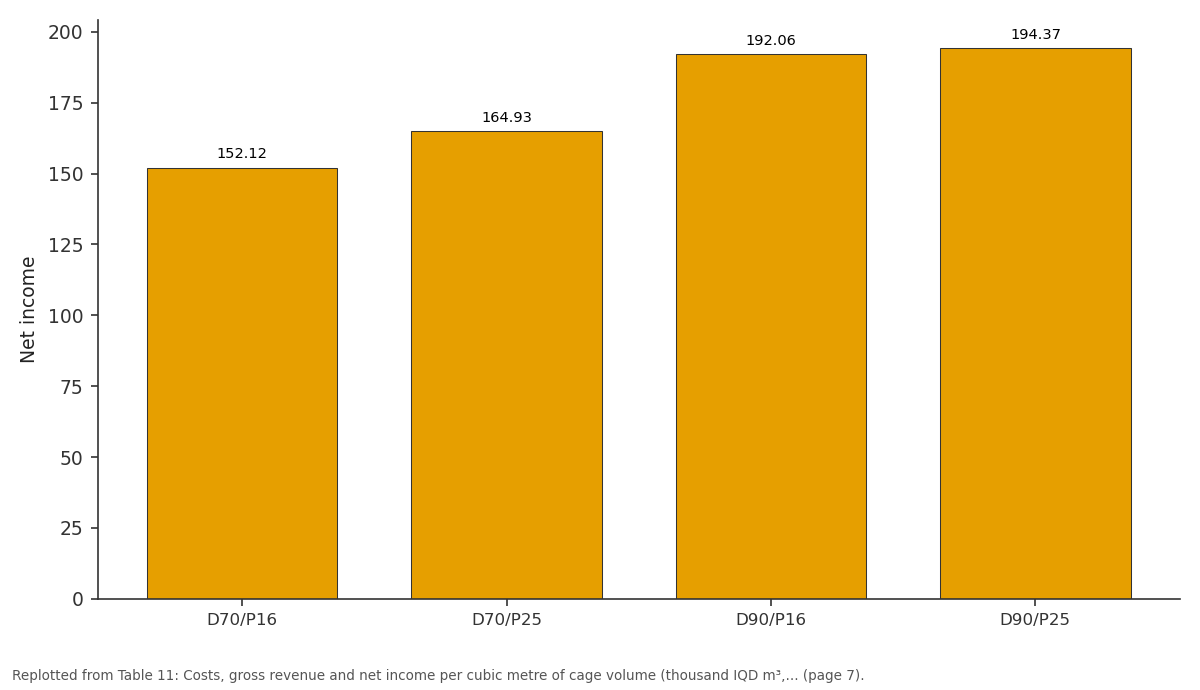
Net income: D70/P16 vs D70/P25 vs D90/P16 vs D90/P25
Replotted from Table 11 (page 7) of the original paper. Every bar is the paper's own table value.
View source evidence ↗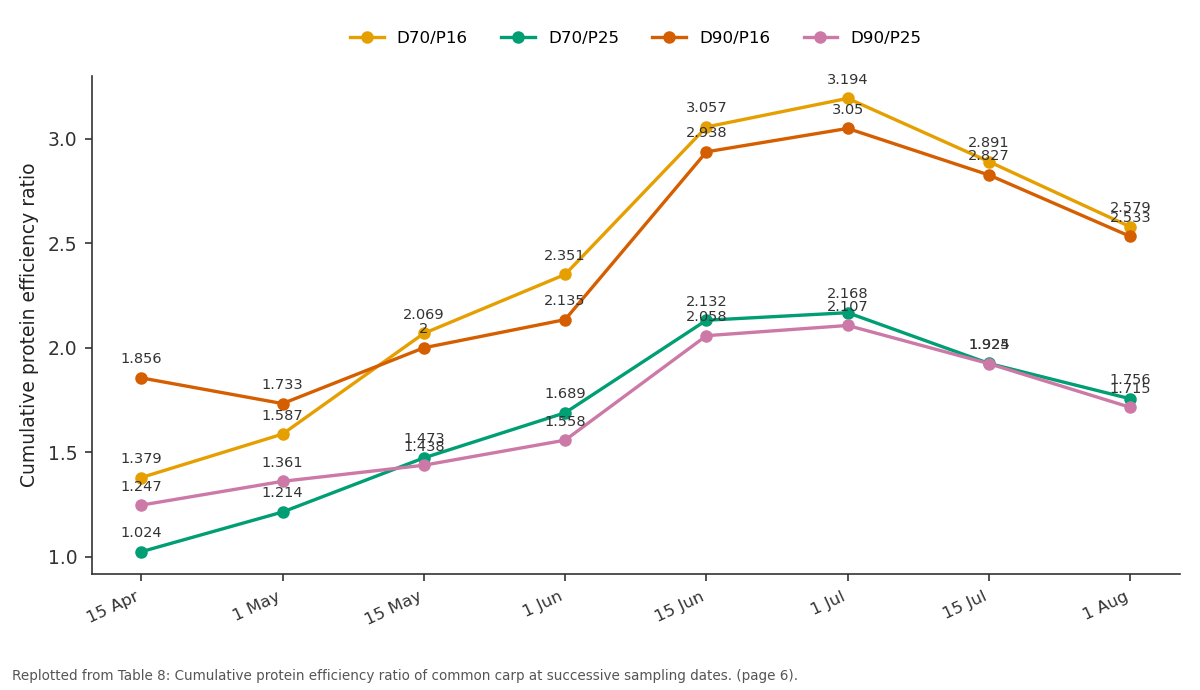
D70/P16 and D70/P25 and more: 15 Apr vs 1 May vs 15 May vs 1 Jun vs 15 Jun
Replotted from Table 8 (page 6) of the original paper. Every bar is the paper's own table value.
View source evidence ↗Figures & tables
From the original paper Table 1
 Table 2
 Table 3
 Table 4
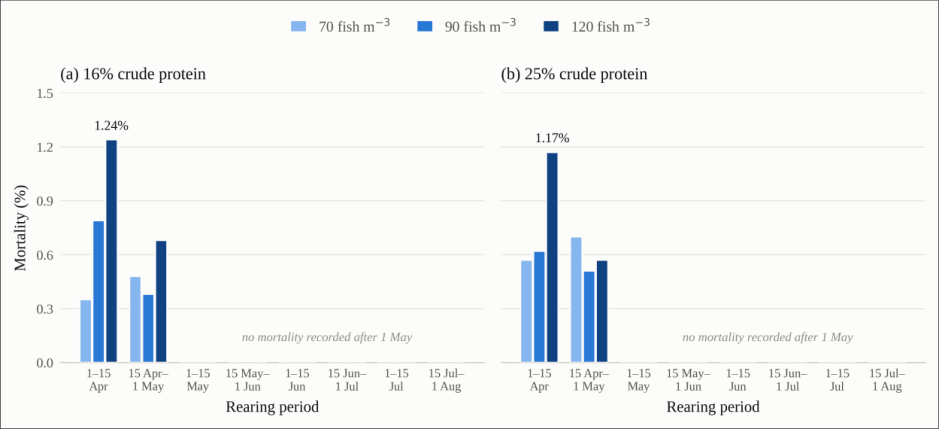 Figure 1
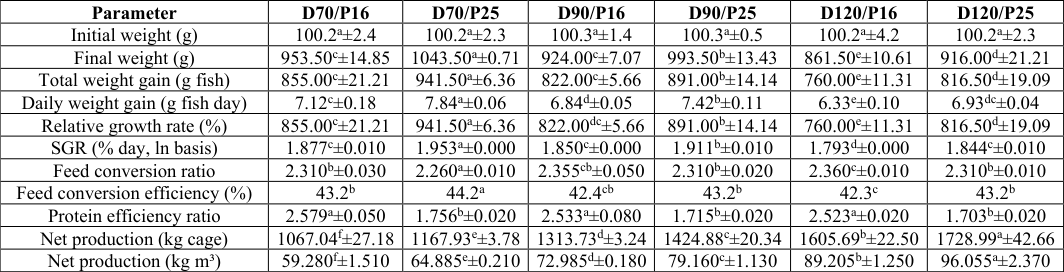 Table 5
 Table 6
 Table 7
 Table 8
 Table 8
 Table 9
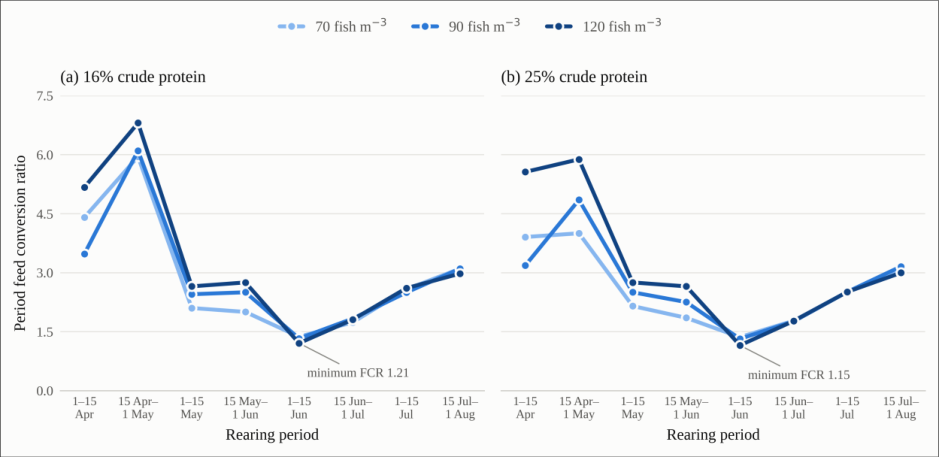 Figure 2
 Table 10
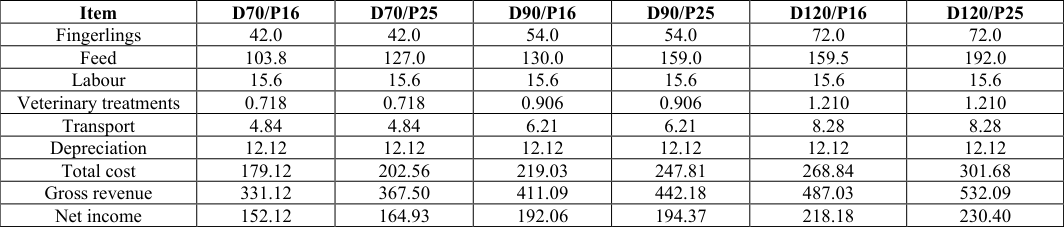 Table 11
 Table 12
Introduction
Aquaculture is now the dominant source of aquatic animal food worldwide. FAO reports that aquaculture production of aquatic animals exceeded 100 million tonnes for the first time in 2024, reaching 103 million tonnes and accounting for 53% of the 195 million tonnes of aquatic animals produced globally, with capture fisheries supplying the remaining 47% [1] . Common carp (Cyprinus carpio L.) remains one of the most widely farmed freshwater species because of its tolerance of variable water quality, its efficient use of low-cost practical diets, and its established position in regional markets. Aquaculture supplies 53% of world aquatic animal production [1] and close to 95% of Iraq's, almost all of it common carp (Cyprinus carpio L.) in ponds and floating cages; water scarcity, water quality, feed supply and hatchery capacity constrain the sector [2,3] . Cage culture has expanded fastest. Salman et al. [4] put practice at 60-70 fish m³, roughly two thousand 100 g fingerlings per cage -convention, not an experimentally derived optimum. Density pulls two ways, since what suits the individual fish does not suit output per cubic metre. Crowding depresses growth and feed conversion through competition, stress and local water-quality decline. Tripling density cost Ramteke et al. [5] about a third of the final weight of cage-reared Amur carp, plus survival and feed efficiency; their densest cages held the most biomass yet the poorest benefit-cost ratio. Li et al. [6] found the same in gibel carp at 0.30 against 0.15 kg m³, with a return on investment of 5.75% against 15.98%. Debnath [7] placed the largest standing crop at an intermediate density over 20-80 fish m³, and Aura et al. [8] treat density as a quantity to optimise rather than raise.
That verdict is not universal: Kebtieneh et al. [9] found the densest Nile tilapia treatment the most profitable per hectare. The outcomes differ in what is scarce. Where feed and fingerlings dominate cost, as on Volta Lake [10] and Lake Victoria [11] , efficiency per fish decides; where the cage is the fixed asset, output per unit volume does. Dietary protein behaves the same way: growth rises to a plateau shifting with species and size, while protein efficiency ratio (PER) falls once protein exceeds requirement [12,13] . Protein makes feed expensive, hence the search for alternatives -insect meals [14] , plant and microbial proteins [15] , algae [16] . Yet the published optima come from fingerlings in tanks: 33.99-35.26% crude protein for 51.6 g Yellow River carp [13] . A cage in a flowing river is neither pond nor recirculating tank. The current exports the metabolic load -Komba et al. [17] document the enrichment that follows -and Shamsuddin et al. [18] could not separate riverine tilapia cage sites statistically on water quality over 120 days. Euphrates cages face steep spring-to-summer warming and hold ~100 g fingerlings for a market pricing by size as well as weight. This study therefore quantified the effects of stocking density (70, 90 and 120 fish m³) and dietary crude protein (16% and 25%) on growth, feed utilisation, survival, net production, muscle composition and economics, separating the biological from the financial optimum.
Materials and methods
Materials and methods
Study site
The experiment was conducted from 1 April to 1 August 2025 (120 days) in floating cages on the Euphrates River at Al-Hamiya, Al-Musayyib district, north-west of Babylon Governorate, Iraq, approximately 40 km from the governorate centre at Al-Hillah. The experiment was laid out as a colony of 18 cages. The trial period covers the seasonal warming of the river from spring to mid-summer.
Cage system
Each cage had a frame of square-section steel tube (2 in, 2 mm wall) measuring 3 m × 3 m × 2.5 m, of which 2 m was submerged; the upper 0.5 m carried the attachment of the inner net. The working volume of each cage was therefore 18 m³ (3 m × 3 m × 2 m submerged), and stocking densities and production are expressed on that basis. The battery was linked to the bank by four ribbed-steel bridges (3 in) 6 m long and 0.80 m wide, and service walkways 0.70 m wide decked with 1.5 in timber ran alongside each cage. Flotation was provided by compressed-cork floats (25 bar) in two lengths, 270 cm and 130 cm, each 0.50 m wide and 0.33 m high, sheathed in canvas against abrasion and current and lashed beneath the walkways. A 1.5 m perimeter fence enclosed the battery. Two nets were used per cage. The outer protective net was plastic-coated BRC steel mesh of 3 cm aperture, fixed to the frame and removable only by lifting the cage. The inner retaining net was knotless nylon of Thai manufacture with a 2 cm aperture, mounted so that it could be raised and worked to crowd fish into one corner for sampling, treatment, grading or harvest. Two mechanical feeders of 40 kg capacity each were mounted on steel posts on the inner fence of every cage.
Experimental design and fish
A 3 × 2 factorial arrangement was used in a completely randomised design, combining three stocking densities (70, 90 and 120 fish m³) with two practical diets differing in crude protein content (16% and 25% CP), giving six treatment combinations. Each combination was assigned to three replicate cages (n = 3), so that the experiment occupied a colony of 18 cages. The cage -not the individual fish -was the experimental unit, since both diet and density were applied at the cage level; every value reported below is a cage-level mean, and all means and standard deviations are over the three replicate cages. A total of 30 240 common carp (Cyprinus carpio L.) of about 100 g mean weight were obtained from a hatchery in Al-Mahaweel district, Babylon, and transported to the site. On arrival the fish were bathed in potassium permanganate at 25 g per 100 L of water for 30 s to remove ectoparasites and other pathogens, then distributed among the 18 cages. At the three densities and a working volume of 18 m³, the cages held 1260, 1620 and 2160 fish respectively, i.e. 3780, 4860 and 6480 fish per density treatment across its three replicate cages. Initial mean weight was standardised at approximately 100 g and did not differ significantly among treatments at stocking (Table 5).
| Parameter | D70/P16 | D70/P25 | D90/P16 | D90/P25 | D120/P16 | D120/P25 |
|---|---|---|---|---|---|---|
| Initial weight (g) | 100.2a±2.4 | 100.2a±2.3 | 100.3a±1.4 | 100.3a±0.5 | 100.2a±4.2 | 100.2a±2.3 |
| Final weight (g) | 953.50c±14.85 | 1043.50a±0.71 | 924.00c±7.07 | 993.50b±13.43 | 861.50e±10.61 | 916.00d±21.21 |
| Total weight gain (g fish) | 855.00c±21.21 | 941.50a±6.36 | 822.00c±5.66 | 891.00b±14.14 | 760.00e±11.31 | 816.50d±19.09 |
| Daily weight gain (g fish day) | 7.12c±0.18 | 7.84a±0.06 | 6.84d±0.05 | 7.42b±0.11 | 6.33e±0.10 | 6.93dc±0.04 |
| Relative growth rate (%) | 855.00c±21.21 | 941.50a±6.36 | 822.00dc±5.66 | 891.00b±14.14 | 760.00e±11.31 | 816.50d±19.09 |
| SGR (% day, ln basis) | 1.877c±0.010 | 1.953a±0.000 | 1.850c±0.000 | 1.911b±0.010 | 1.793d±0.000 | 1.844c±0.010 |
| Feed conversion ratio | 2.310b±0.030 | 2.260a±0.010 | 2.355cb±0.050 | 2.310b±0.020 | 2.360c±0.010 | 2.310b±0.010 |
| Feed conversion efficiency (%) | 43.2b | 44.2a | 42.4cb | 43.2b | 42.3c | 43.2b |
| Protein efficiency ratio | 2.579a±0.050 | 1.756b±0.020 | 2.533a±0.080 | 1.715b±0.020 | 2.523a±0.020 | 1.703b±0.020 |
| Net production (kg cage) | 1067.04f±27.18 | 1167.93e±3.78 | 1313.73d±3.24 | 1424.88c±20.34 | 1605.69b±22.50 | 1728.99a±42.66 |
| Net production (kg m³) | 59.280f±1.510 | 64.885e±0.210 | 72.985d±0.180 | 79.160c±1.130 | 89.205b±1.250 | 96.055a±2.370 |
Table text extracted from the original PDF; superscript letters are shown inline. The original table image is below.
View original table image
Experimental diets
A preliminary survey of fish-farming enterprises in Babylon Governorate indicated that the great majority use feeds formulated for pond culture containing 16-18% crude protein, and that adopting commercial diets meeting the reported requirement of common carp (34-38% CP) exposes the enterprise to economic risk, because raw-material prices are high while farm-gate fish prices fluctuate and often fall. The two diets tested were chosen to represent this decision directly: Diet 1 is the formulation in prevailing local use (16% CP) and Diet 2 a higher-protein alternative (25% CP). Ingredient composition is given in Table 1 and analysed proximate composition in Table 2. Both diets were manufactured as pellets of 3-5 mm diameter at the Al-Mukhtar feed mill, Al-Iskandariya district. Fish were fed by hand-charged mechanical feeder four times daily (07:00, 11:00, 15:00 and 19:00 h) at 5-6% of body weight per day. Rations were recalculated for each cage from that cage's own biomass after every fortnightly biometry, so feeding intensity was maintained independently in each replicate, and the feeders were adjusted at each visit to avoid feed loss. Ration size was set as a fixed percentage of biomass rather than optimised against a growth model [19] . Gross energy was calculated as: crude protein (%) × 5.56 + carbohydrate (%) × 4.45 + crude lipid (%) × 9.2 [20] .
| Component | Diet 1 (16% CP) | Diet 2 (25% CP) |
|---|---|---|
| Moisture (%) | 4.36 | 4.38 |
| Ash (%) | 4.81 | 4.80 |
| Crude lipid (%) | 7.20 | 7.10 |
| Crude protein (%) | 16.73 | 25.16 |
| Crude fibre (%) | 7.44 | 7.41 |
| Carbohydrate (%) | 59.46 | 51.15 |
| Gross energy (kcal 100 g⁻¹) | 423.855 | 432.827 |
Table text extracted from the original PDF; superscript letters are shown inline. The original table image is below.
View original table image
| Ingredient | Diet 1 (16% CP) | Diet 2 (25% CP) |
|---|---|---|
| Fish protein concentrate | 5 | 10 |
| Soybean meal | 10 | 30 |
| Barley | 20 | 20 |
| Wheat bran | 20 | 10 |
| Rice polish (sahala) | 20 | 20 |
| Wheat flour | 25 | 10 |
| Total | 100 | 100 |
Table text extracted from the original PDF; superscript letters are shown inline. The original table image is below.
View original table image
Water quality
Physicochemical variables were measured at the cage site once weekly, all readings being taken between 09:00 and 11:00 h on each sampling day. Water temperature and dissolved oxygen were measured with a digital meter (Martin, Romania), the probe being lowered to depths between 30 and 200 cm within the cage and the readings averaged. pH was measured with a digital pH meter (Hanna, Italy), verified on each reading day against pH 4, 7 and 9 standard buffers. Salinity was derived from a digital EC meter (Hanna, Italy) as salinity (g L¹) = (EC reading × 0.64) / 1000. Transparency was measured with a 25 cm black-andwhite Secchi disc on a graduated tape, taking the mean of the depth of disappearance and the depth of reappearance with the sun behind the observer. Current velocity was measured with a current meter (Tokyotohodentan, Japan) and recorded in cm s⁻¹. Total ammonia nitrogen, nitrite and nitrate were not monitored.
Sampling and performance indices
Fish were sampled at 15-day intervals on eight occasions (15 April, 1 May, 15 May, 1 June, 15 June, 1 July, 15 July and 1 August). Fish were not fed before weighing, so that gut content would not inflate the recorded weight; each sample was weighed three times and the mean of the three weighings taken. Rations for the following fortnight were then recalculated from the new cage biomass and the prevailing water temperature. Cages were inspected at each visit for disease and for feeder performance. The following indices were calculated per cage, where W is mean body weight (g), N is fish number, t is duration in days, F is total feed offered (g) and CP is the analysed dietary crude protein fraction: Total weight gain, WG (g) = W_f -W_i Daily growth rate, DGR (g fish day) = (W_f -W_i) / t Relative growth rate, RGR (%) = 100 × (W_f -W_i) / W_i Specific growth rate, SGR (% day) = 100 × (ln W_f -ln W_i) / t Feed conversion ratio,
Net production (kg m³) = net production per cage / cage working volume Specific growth rate is computed on the natural-logarithm basis, which is the convention in the aquaculture nutrition literature and is required for comparison with published values. Reporting of the experimental unit, the feed basis used for FCR and the analysed composition of each diet follows the recommendations of Turchini and Hardy [21] for applied feeding trials.
Chemical analysis
Samples of the edible portion (muscle) were taken at the start and at the end of the trial. Diets were sampled for moisture, crude protein, crude lipid, crude fibre and ash. All determinations followed AOAC [22] standard procedures. Dry matter was determined by drying in an electric oven at 105 °C to constant weight. Crude protein was determined by the micro-Kjeldahl method, total nitrogen being multiplied by 6.25. Crude lipid was determined in a Soxhlet apparatus with petroleum ether over 16 h, the solvent then evaporated at 105 °C for 30 min and the flask reweighed after cooling. Crude fibre was determined by successive digestion in 1.25% H₂SO₄ and 1.25% NaOH for 30 min each, the undigested residue being taken as crude fibre. Ash was determined by ignition in a muffle furnace at 600 °C for 6 h to constant weight.
Economic analysis
Costs per cubic metre of cage volume were compiled for each treatment from fingerling purchase, feed, labour, veterinary treatments, transport and depreciation of the cage structures. Gross revenue was calculated from net production and the farm-gate price obtained for each treatment, and net income by difference. All monetary values are in Iraqi dinars (IQD) at 2025 prices.
Statistical analysis
Data were analysed as a completely randomised design (CRD) using the Statistical Analysis System (SAS) [23] . Treatment means were separated by Duncan's multiple range test [24] at P ≤ 0.05. The experimental unit was the cage and the number of replicates was three per treatment (n = 3), giving 12 error degrees of freedom for the sixtreatment comparison. Results are presented as mean ± Standard deviation of the three replicate cages; means within a row bearing different superscript letters differ significantly at P ≤ 0.05. Both diets were pelleted at 3-5 mm diameter. Analysed by AOAC [22] procedures. Gross energy calculated as crude protein × 5.56 + carbohydrate × 4.45 + crude lipid × 9.2 [20] . The two diets differ in gross energy by 2.1%, i.e. they are near-isoenergetic, while crude protein differs by 50.4% in relative terms.
Results
Results
Water quality
Monthly water quality is summarised in Table 3. Temperature rose from 18.5±0.08 °C in April to 28.55±1.80 °C in July. pH varied narrowly, between 7.4 and 7.9.
| Month | Temperature (°C) | pH | Salinity (g L−1) | Dissolved oxygen (mg L−1) | Transparency (cm) |
|---|---|---|---|---|---|
| April | 18.50±0.08 | 7.8±0.08 | 0.326±0.008 | 8.15±0.21 | 70.0±0.90 |
| May | 24.40±0.60 | 7.4±0.00 | 0.323±0.050 | 7.85±0.07 | 51.0±1.31 |
| June | 28.50±0.90 | 7.7±0.05 | 0.331±0.010 | 7.90±0.00 | 53.5±2.13 |
| July | 28.55±1.80 | 7.9±0.00 | 0.333±0.010 | 7.75±0.07 | 53.5±7.71 |
Table text extracted from the original PDF; superscript letters are shown inline. The original table image is below.
View original table image
Salinity ranged from 0.323 to 0.333 g L and dissolved oxygen from 7.75 to 8.15 mg L. Secchi transparency was highest in April (70±0.90 cm) and lowest in May (51±1.31 cm). Values are monthly means±standard deviation.
Survival
Mortality was low and confined to the first two fortnightly periods (Figure 1, Table 4). On the 16% CP diet it was 0.35%, 0.79% and 1.24% at 70, 90 and 120 fish m³ in the first period, and 0.48%, 0.38% and 0.68% in the second.
| Treatment | Mortality, 1-15 Apr (%) | Mortality, 15 Apr-1 May (%) | Cumulative mortality (%) | Survival (%) |
|---|---|---|---|---|
| D70/P16 | 0.35 | 0.48 | 0.83 | 99.17 |
| D70/P25 | 0.57 | 0.70 | 1.27 | 98.73 |
| D90/P16 | 0.79 | 0.38 | 1.17 | 98.83 |
| D90/P25 | 0.62 | 0.51 | 1.13 | 98.87 |
| D120/P16 | 1.24 | 0.68 | 1.92 | 98.08 |
| D120/P25 | 1.17 | 0.57 | 1.74 | 98.26 |
Table text extracted from the original PDF; superscript letters are shown inline. The original table image is below.
View original table image
The corresponding values on the 25% CP diet were 0.57%, 0.62% and 1.17%, then 0.70%, 0.51% and 0.57%. Nothing died in any treatment after 1 May. Cumulative survival ranged from 98.08% at 120 fish m³ on the 16% CP diet to 99.17% at 70 fish m³ on the same diet, and in both diets the highest cumulative mortality fell at the highest density (1.92% and 1.74% at 120 fish m³). In every treatment the peak came in the first fortnight after stocking.
Growth performance and feed utilisation
Initial mean weight did not differ among treatments (P> 0.05), averaging 100.2-100.3 g (Table 5). Every growth criterion differed significantly at harvest (P ≤ 0.05). Final mean weight was highest at 70 fish m³ on the 25% CP diet (1043.5±0.71 g), then 90 fish m³ on the same diet (993.5±13.43 g). The 70 fish m³ / 16% CP combination (953.5±14.85 g) did not differ from 90 fish m³ / 16% CP (924.0±7.07 g). Lowest was 120 fish m³ on the 16% CP diet (861.5±10.61 g). Total and daily weight gain and relative growth rate all followed the same ordering.
Specific growth rate ranged from 1.79% day¹ (120 fish m³, 16% CP) to 1.95% day¹ (70 fish m³, 25% CP), the latter being significantly superior to all other treatments. Feed conversion ratio was best at 70 fish m³ with 25% CP (2.26±0.01), which differed significantly from all other combinations; FCR at 70/16, 90/25 and 120/25 did not differ from one another (2.31), while the poorest values occurred at 90 and 120 fish m³ on the 16% CP diet (2.355 and 2.36). Feed conversion efficiency mirrored this pattern exactly, ranging from 42.3% to 44.2%.
Protein efficiency ratio ranked the treatments in reverse. All three densities on the 16% CP diet (2.523-2.579) were significantly superior to all three on the 25% CP diet (1.703-1.756), with no significant difference among densities within a diet. Net production per cage and per cubic metre also reversed the individual-growth ranking, rising consistently with stocking density: from 1067.04 kg cage (59.28 kg m³) at 70 fish m³ on the 16% CP diet to 1728.99 kg cage (96.06 kg m³) at 120 fish m⁻³ on the 25% CP diet. Every treatment differed significantly from every other.
Temporal pattern of growth and feed utilization
Cumulative specific growth rate increased steadily as the river warmed (Table 6). No significant differences among treatments were detected on the first three sampling dates (15 April, 1 May, 15 May). Differences emerged from 1 June onward and persisted to harvest, with 70 fish m³ on the 25% CP diet retaining the highest cumulative SGR at every subsequent date. Cumulative feed conversion ratio improved sharply over the same interval, falling from 3.16-5.50 in mid-April to 1.83-1.99 by 1 July before rising slightly to 2.26-2.36 at harvest as fish approached market size (Table 7). Cumulative protein efficiency ratio peaked on 1 July in every treatment and declined thereafter (Table 8), and cumulative net production per cubic metre diverged progressively between densities from 1 June onward (Table 9). Feed conversion ratio computed within each fortnight, rather than cumulatively, resolves this pattern more sharply (Figure 2). In every treatment of both diets, period FCR followed the same trajectory: poor during the two coldwater fortnights of April (3.18-6.81), improving abruptly as the river warmed through May, reaching a minimum in the first fortnight of June (1.15-1.37), and then deteriorating steadily through July to 2.98-3.16 by harvest. The rank order of densities was preserved through most of the trajectory, with 120 fish m³ giving the poorest period FCR from April through to the end of May; from mid-June onward the three densities converged, and in the final fortnight the ranking reversed, the 120 fish m⁻³ treatment recording the best period FCR on both diets (2.975 and 2.995 against 3.10 and 3.03-3.16 at the lower densities).
| Date | D70/P16 | D70/P25 | D90/P16 | D90/P25 | D120/P16 | D120/P25 |
|---|---|---|---|---|---|---|
| 15 Apr | 1.080 | 1.215 | 1.885 | 1.900 | 1.570 | 1.700 |
| 1 May | 2.710 | 3.145 | 3.935 | 4.605 | 3.705 | 4.250 |
| 15 May | 5.840 | 6.385 | 7.490 | 8.250 | 7.710 | 8.275 |
| 1 Jun | 10.070 | 11.215 | 11.985 | 13.460 | 12.535 | 13.460 |
| 15 Jun | 20.205 | 22.195 | 24.925 | 27.385 | 29.305 | 31.620 |
| 1 Jul | 32.970 | 35.660 | 40.085 | 43.840 | 48.190 | 51.840 |
| 15 Jul | 45.640 | 49.565 | 56.180 | 61.010 | 67.255 | 72.765 |
| 1 Aug | 59.280 | 64.885 | 72.985 | 79.160 | 89.205 | 96.055 |
Table text extracted from the original PDF; superscript letters are shown inline. The original table image is below.
View original table image
| Date | D70/P16 | D70/P25 | D90/P16 | D90/P25 | D120/P16 | D120/P25 |
|---|---|---|---|---|---|---|
| 15 Apr | 1.379 | 1.024 | 1.856 | 1.247 | 1.161 | 0.860 |
| 1 May | 1.587 | 1.214 | 1.733 | 1.361 | 1.278 | 0.963 |
| 15 May | 2.069 | 1.473 | 2.000 | 1.438 | 1.636 | 1.147 |
| 1 Jun | 2.351 | 1.689 | 2.135 | 1.558 | 1.795 | 1.256 |
| 15 Jun | 3.057 | 2.132 | 2.938 | 2.058 | 2.826 | 1.977 |
| 1 Jul | 3.194 | 2.168 | 3.050 | 2.107 | 2.997 | 2.028 |
| 15 Jul | 2.891 | 1.925 | 2.827 | 1.924 | 2.757 | 1.875 |
| 1 Aug | 2.579 | 1.756 | 2.533 | 1.715 | 2.523 | 1.703 |
Table text extracted from the original PDF; superscript letters are shown inline. The original table image is below.
View original table image
| 15 Jun | 1.950 | 1.860 | 2.030 | 1.930 | 2.110 | 2.005 |
|---|---|---|---|---|---|---|
| 1 Jul | 1.865 | 1.830 | 1.955 | 1.880 | 1.985 | 1.910 |
| 15 Jul | 2.060 | 2.020 | 2.110 | 2.050 | 2.160 | 2.085 |
| 1 Aug | 2.310 | 2.260 | 2.355 | 2.310 | 2.360 | 2.310 |
Table text extracted from the original PDF; superscript letters are shown inline. The original table image is below.
View original table image
| Date | D70/P16 | D70/P25 | D90/P16 | D90/P25 | D120/P16 | D120/P25 |
|---|---|---|---|---|---|---|
| 15 Apr | 4.400 | 3.850 | 3.450 | 3.160 | 5.150 | 5.500 |
| 1 May | 4.005 | 3.270 | 3.670 | 3.195 | 4.660 | 4.170 |
| 15 May | 2.850 | 2.650 | 2.950 | 2.750 | 3.600 | 3.400 |
| 1 Jun | 2.540 | 2.615 | 2.795 | 2.605 | 3.325 | 3.160 |
Table text extracted from the original PDF; superscript letters are shown inline. The original table image is below.
View original table image
| Date | D70/P16 | D70/P25 | D90/P16 | D90/P25 | D120/P16 | D120/P25 |
|---|---|---|---|---|---|---|
| 15 Apr | 0.910a | 0.990a | 1.220a | 1.220a | 0.840a | 0.910a |
| 1 May | 1.059a | 1.255a | 1.186a | 1.382a | 0.956a | 1.025a |
| 15 May | 1.347a | 1.439a | 1.347a | 1.439a | 1.105a | 1.186a |
| 1 Jun | 1.462ab | 1.589a | 1.416b | 1.508ab | 1.197c | 1.255c |
| 15 Jun | 1.796bc | 1.888a | 1.761c | 1.854ab | 1.658d | 1.715dc |
| 1 Jul | 1.923ab | 1.992a | 1.877ab | 1.865ab | 1.785b | 1.865ab |
| 15 Jul | 1.900b | 1.980a | 1.865c | 1.923b | 1.808d | 1.854c |
| 1 Aug | 1.854c | 1.934a | 1.842c | 1.900b | 1.773d | 1.831c |
Table text extracted from the original PDF; superscript letters are shown inline. The original table image is below.
View original table image
Muscle proximate composition
Muscle composition at harvest is given in Table 10. Crude protein rose from 12.535±0.148% at stocking to 15.31-15.50% (P ≤ 0.05) and ash fell from 7.310±0.169% to 5.27-5.37%. Moisture (74.20-74.35%) and crude lipid (4.33-
| Component | Initial | D70/P16 | D70/P25 | D90/P16 | D90/P25 | D120/P16 | D120/P25 |
|---|---|---|---|---|---|---|---|
| Moisture | 75.14a±0.08 | 74.20a±0.14 | 74.23a±0.21 | 74.35a±1.13 | 74.35a±1.14 | 74.34a±1.32 | 74.34a±1.21 |
| Ash | 7.31a±0.17 | 5.51b±0.03 | 5.52b±0.04 | 5.27b±0.01 | 5.28b±0.12 | 5.29b±0.62 | 5.37b±0.23 |
| Crude lipid | 4.62a±0.06 | 4.40a±0.08 | 4.43a±0.06 | 4.38a±0.03 | 4.37a±0.32 | 4.34a±0.41 | 4.33a±0.11 |
| Crude protein | 12.54b±0.15 | 15.41a±0.13 | 15.31a±0.12 | 15.48a±0.00 | 15.49a±0.89 | 15.50a±0.22 | 15.44a±0.37 |
Table text extracted from the original PDF; superscript letters are shown inline. The original table image is below.
View original table image
Economic analysis
Costs, revenues and net income per cubic metre are presented in Table 11. Feed was the largest single cost item in every treatment, ranging from 103.8 thousand IQD m³ (70 fish m³, 16% CP) to 192.0 thousand IQD m³ (120 fish m³, 25% CP) and representing 58-64% of total cost. Fingerlings were the second largest item (42-72 thousand IQD m³, 20-27% of total cost), followed by labour (15.6 thousand IQD m³ in all treatments), depreciation (12.12), transport (4.84-8.28) and veterinary treatments (0.718-1.21). Total cost rose with stocking density and with dietary protein, from 179.12 to 301.68 thousand IQD m³. Gross revenue rose more steeply, from 331.12 to 532.09 thousand IQD m³, so that net income per cubic metre increased monotonically with density, from 152.12 thousand IQD m³ at 70 fish m³ on the 16% CP diet to 230.40 thousand IQD m³ at 120 fish m³ on the 25% CP diet. Per kilogram of fish produced, the picture inverts (Table 12). Unit production cost was lowest at 120 fish m³ on the 16% CP diet (2649 IQD kg) and highest at 90 fish m³ on the 25% CP diet (2830 IQD kg). Farm-gate price also fell slightly at the highest density, so net margin per kilogram was greatest at 90 fish m³ on the 16% CP diet (2336 IQD kg) and smallest at 120 fish m³ on the 25% CP diet (2121 IQD kg) the treatment that nevertheless returned the most income per cage. D = stocking density (fish m³); P = dietary crude protein (%).
| Item | D70/P16 | D70/P25 | D90/P16 | D90/P25 | D120/P16 | D120/P25 |
|---|---|---|---|---|---|---|
| Total production cost | 2704 | 2811 | 2664 | 2830 | 2649 | 2779 |
| Farm-gate price | 5000 | 5100 | 5000 | 5000 | 4800 | 4900 |
| Net margin | 2296 | 2289 | 2336 | 2170 | 2151 | 2121 |
Table text extracted from the original PDF; superscript letters are shown inline. The original table image is below.
View original table image
| Item | D70/P16 | D70/P25 | D90/P16 | D90/P25 | D120/P16 | D120/P25 |
|---|---|---|---|---|---|---|
| Fingerlings | 42.0 | 42.0 | 54.0 | 54.0 | 72.0 | 72.0 |
| Feed | 103.8 | 127.0 | 130.0 | 159.0 | 159.5 | 192.0 |
| Labour | 15.6 | 15.6 | 15.6 | 15.6 | 15.6 | 15.6 |
| Veterinary treatments | 0.718 | 0.718 | 0.906 | 0.906 | 1.210 | 1.210 |
| Transport | 4.84 | 4.84 | 6.21 | 6.21 | 8.28 | 8.28 |
| Depreciation | 12.12 | 12.12 | 12.12 | 12.12 | 12.12 | 12.12 |
| Total cost | 179.12 | 202.56 | 219.03 | 247.81 | 268.84 | 301.68 |
| Gross revenue | 331.12 | 367.50 | 411.09 | 442.18 | 487.03 | 532.09 |
| Net income | 152.12 | 164.93 | 192.06 | 194.37 | 218.18 | 230.40 |
Table text extracted from the original PDF; superscript letters are shown inline. The original table image is below.
View original table image
Discussion
Density and protein pull individual performance and volumetric output in opposite directions, and no single treatment wins on both. Growth, feed conversion and feed conversion efficiency were best at the lowest density on the higher-protein diet. Net production per cage and per cubic metre -and with it net income per cage -were greatest at the highest density on the same diet. A recommendation is therefore incomplete unless it states which of the two the producer is maximising. That growth falls as density rises is not new. Every cage study cited above reports it, and attributes it to competition for feed, crowding stress and localised water-quality decline. Ramteke et al. [5] recorded a 37% loss of final weight and a rise in FCR from 1.86 to 2.35 in Amur carp between 10 and 30 fish m⁻³, with elevated cortisol and glucose and suppressed immune markers. Wu et al. [25] found the same coupling of crowding with impaired antioxidant capacity and immunity in grass carp, and Li et al. [26] traced chronic high-density stress in rainbow trout as far as lipid metabolism. Li et al. [6] reported significantly higher FCR alongside depressed dissolved oxygen and elevated nitrite nitrogen in gibel carp, and Debnath [7] the same direction in common carp cages at 20-80 fish m³. The present results differ in magnitude, not direction. Our densities (70-120 fish m³) sit well above all of those ranges, and above the 60-70 fish m³ that Salman et al. [4] describe as prevailing Iraqi practice -yet the penalty was small. Final weight fell 9.6% between 70 and 120 fish m³ on the 25% CP diet (1043.5 → 916.0 g) and FCR worsened by 2.2% (2.26 → 2.31), against a 37% weight penalty over a threefold density range in Ramteke et al. [5] . The explanation is hydrological rather than nutritional. Dissolved oxygen never fell below 7.75 mg L in any month, comfortably above the concentrations at which feeding behaviour and growth begin to suffer [27,28] . More important, the current carries away the metabolic load that accumulates inside a static or semi-static culture unit -the same transfer that produces the downstream nutrient enrichment Komba et al. [17] document below cage installations. Shamsuddin et al. [18] likewise could not separate riverine tilapia cage sites statistically on water quality across a 120-day cycle. A lotic cage externalises the water-quality penalty that normally caps stocking density, which is why densities above pond and reservoir norms were tolerable here. That is an advantage to the operator and a cost carried downstream. Survival points the same way. Cumulative mortality stayed below 2% in every treatment, was highest at 120 fish m³ on both diets, and ceased entirely after the first month, peaking in the fortnight immediately after stocking (Figure 1). Timing like that belongs to acclimation, not to a density effect running through the trial: once the fish had settled, no further mortality occurred at any density, the highest included. Ramteke et al. [5] lost ten percentage points of survival across a comparable relative increase in density in reservoir cages. The gap between the two outcomes is hard to attribute to anything but flow. Feed conversion computed within each fortnight, rather than cumulatively, sharpens the seasonal picture (Figure 2). Period FCR was worst in April at 18.5-24.4 °C. It fell to a minimum of 1.15-1.37 in the first half of June as the water reached 28.5 °C, then rose again through July with temperature still at its maximum. Temperature had stopped changing over those last six weeks, so it cannot account for the late deterioration; the remaining candidate is fish size, on which the cold-water penalty of April is superimposed at the start of the cycle. The productive window here therefore runs from mid-May to early July, and every fortnight beyond it buys biomass at a worse conversion. The three densities also converge from mid-June and reverse in the final fortnight, where 120 fish m³ gave the best period FCR on both diets -placing the density penalty early in the cycle, when the fish are small relative to the cage and competition for a fixed ration is sharpest, rather than late. The protein response was positive but small: 6-9% more final weight and about 2% better FCR on the 25% CP diet at the same density. Fish of this size are past the point at which protein strongly limits growth. Jiang et al. [13] put the requirement of juvenile Yellow River carp of 51.6 g at 33.99-35.26% crude protein, and Ali and Rawal [12] derived a comparable figure for common carp fingerlings; the fish here entered the trial at 100 g and left it near 1 kg. Against that background, a growth response that flattens at a comparatively low dietary protein content is unsurprising. Protein efficiency ratio makes the plateau explicit by inverting the ranking. PER was significantly higher on the 16% CP diet (2.523-2.579) than on the 25% CP diet (1.703-1.756) at every density, and did not differ among densities within a diet. Part of that follows arithmetically: PER varies inversely with the product of FCR and dietary protein content, so raising protein without a proportional gain in FCR must depress it. Biologically it means the extra protein of the 25% CP diet was used less efficiently, a fraction of it deaminated and catabolised for energy rather than retained. Two observations support this reading. Muscle protein at harvest (15.31-15.50%) did not differ among treatments, so the additional dietary protein did not reach the edible portion -the same decoupling Jiang et al. [13] saw above the requirement plateau, and consistent with flesh composition in carp tracking specific dietary components more closely than bulk crude protein [29] . And feed conversion efficiency spanned only 42.3-44.2% across all six treatments, a far narrower range than the 50% relative difference in analysed crude protein between the diets. The economics reconcile the two rankings. Feed dominated cost in every treatment (58-64%), so the higher-protein diet cost more; it also produced more biomass, and revenue rose faster than cost. Net income per cubic metre therefore climbed with both density and protein, reaching 230.40 thousand IQD m³ at 120 fish m³ with 25% CP. That matches Kebtieneh et al. [9] , whose densest treatment was also the most profitable per unit area, and runs against Ramteke et al. [5] , Debnath [7] and Li et al. [6] , where the return to the producer was greatest at the lowest density. Which of the two patterns applies depends on what is scarce. Feed and fingerlings dominate operating cost in small-scale cage systems on Volta Lake [10] and in Lake Victoria [11] ; where that holds, efficiency per fish decides. Where instead the cage is the fixed asset and river water is free, output per cubic metre decides, and dense stocking wins. A survival penalty can also tip the balance, as it did in the reservoir cages of Ramteke et al. [5] with ten points of mortality. Survival above 98% in every treatment here is what leaves the volumetric argument standing. Per kilogram of fish, the ranking inverts again. The highestdensity, high-protein treatment gave the smallest margin (2121 IQD kg): unit cost was higher, and the farm-gate price obtained at 120 fish m³ was 100-200 IQD kg below that at the lower densities. A producer with a fixed number of cages should therefore stock densely. One limited by working capital or feed supply, or selling into a market that pays a premium for large fish, should not. How far these results travel is limited in several ways. The trial ran one season at one site, so the temperature trajectory (18.5 → 28.6 °C) is confounded with time; treatments are comparable with each other, but the absolute growth rates belong to a spring-summer Euphrates cycle. Total ammonia nitrogen and nitrite were not measured, which weakens any inference about the water-quality mechanism inside the cages -the variables that proved diagnostic for Li et al. [6] . The two diets were near-isoenergetic (423.9 vs 432.8 kcal 100 g, 2.1% apart) while differing by 50% in relative crude protein, so the contrast is a reasonably clean one; they nevertheless differ in ingredients as well as in protein, so what is reported is the effect of two practical formulations, not of dietary protein in isolation -a confounding that Turchini and Hardy [21] identify as recurrent in applied feeding trials. Replication was three cages per treatment, giving 12 error degrees of freedom: enough for the large contrasts reported here, not enough to resolve small ones, which is why the consistency of the rankings across every criterion and all eight sampling dates carries part of the evidential weight. Between-individual variability in harvest traits is substantial in this species [30] , a further reason to treat the cage mean rather than the fish as the unit of inference. Finally, two protein levels establish a direction, not an optimum; a requirement estimate needs graded levels and regression, as in Ali and Rawal [12] and Jiang et al. [13] , not mean separation.
Conclusion
Common carp grew well in Euphrates River cages at Babylon across 70-120 fish m³, reaching 861-1044 g from 100 g fingerlings in 120 days with cumulative survival above 98% in every treatment. Raising density depressed individual growth and feed conversion while raising net production and net income per unit of cage volume. Raising dietary crude protein from 16% to 25% improved growth and feed conversion modestly, cut protein efficiency ratio substantially, and left muscle composition unchanged.
Acknowledgement
Acknowledgements : The authors wish to extend their sincere appreciation to everyone who provided assistance and support throughout the course of this study.
References
29 in the original paper- Food and Agriculture Organization of the United Nations. The state of world fisheries and aquaculture 2026. Rome: FAO; 2026. doi:10.4060/cd8357en.
- Al-Hilali H. Status, challenges, and prospects of aquaculture development in Iraq. Iraqi J Aquac. 2025;22 [1] :111-139. doi:10.58629/ijaq.v22i1.700.
- Al-Hilali HA, Lozovskiy AR. Common carp aquaculture Cyprinus carpio in Iraq: history, challenges, and opportunities. J Akuakultur Indones. 2026;25 [1] :26-42. doi:10.19027/jai.25.1.26-42.
- Salman NA, Saleh KI, Taher MM. Cage culture in Iraq, current status and potential: a review. Basrah J Agric Sci. 2022;35 [2] :362-372. doi:10.37077/25200860.2022.35.2.27.
- Ramteke MH, Swain HS, Das BK, Kumar V, Behera BK, Krishnani KK, et al. Density-dependent effects on growth performance, feed utilisation, integrated health biomarkers, economic efficiency of Amur carp, Cyprinus carpio haematopterus (Linnaeus, 1758) in inland cages for sustainable production. Front Sustain Food Syst. 2026;9:1701262. doi:10.3389/fsufs.2025.1701262.
- Li H, Liu J, Gu X, Li L, Yu L, Tang R, et al. Effect of stocking density on growth performance of juvenile gibel carp (Carassius gibelio) and economic profit of land-based recirculating aquaculture system. Water. 2024;16 [17] :2367. doi:10.3390/w16172367.
- Debnath C. Effect of stocking density on growth, production, ecosystem dynamics, and economic viability of common carp (Cyprinus carpio) cage culture in a forest water body of Northeast India. Aquac Int. 2025;33 [4] :245. doi:10.1007/s10499-025-01931-y.
- Aura CM, Awandu H, Mziri V, Awuor FJ, Nyamweya CS, Musa S. Optimizing stocking density for enhanced fish yield in lacustrine cage aquaculture. Sci Afr. 2025;28. doi:10.1016/j.sciaf.2025.e02721.
- Kebtieneh N, Geremew A, Yalew A, Abdissa B, Tilahun G. Optimizing Nile tilapia stocking density for enhanced water use efficiency and profitability in fishcabbage integrated farming systems in Northwest Ethiopia. Aquac Int. 2025;33 [7] :672. doi:10.1007/s10499-025-02359-0.
- Magna EK, Mensah ET-D, Mabe FN, Johnson-Ashun M, Konadu LO, Appiah EK. Profitability analysis of small-scale cage aquaculture farms in the Volta Lake of Ghana. Aquac Res. 2023;2023:1314660. doi:10.1155/2023/1314660.
- Obiero K, Mboya JB, Ouko KO, Okech D. Economic feasibility of fish cage culture in Lake Victoria, Kenya. Aquac Fish Fish. 2022;2 [6] :484-492. doi:10.1002/aff2.75.
- Ali B, Rawal YK. Evaluation of optimum dietary protein requirement for maximum growth of common carp (Cyprinus carpio) fingerlings. Aquac Res. 2022;53 [17] :5915-5924. doi:10.1111/are.16059.
- Jiang X, Qu F, Ge Y, Li C, Shi X, Hu X, et al. Effects of dietary protein levels on the growth, physiological, and biochemical indices of juvenile Yellow River carp (Cyprinus carpio). Animals. 2025;15 [12] :1800. doi:10.3390/ani15121800.
- Raghuvaran N, Varghese T, Jana P, Angela Brighty RJ, Sethupathy MA, Sudarshan S, et al. Current status and global research trend patterns of insect meal in aquaculture from a scientometric perspective [2013-2022] . Aquac Nutr. 2024;2024:5466604. doi:10.1155/2024/5466604.
- Mahmud MN, Ritu FY, Ansary AA, Haque MM. Exploring protein-based fishmeal alternatives for aquaculture feeds in Bangladesh. Aquac Nutr. 2025;2025:3198303. doi:10.1155/anu/3198303.
- Ringø E. Spirulina (Arthrospira) as feed additive in finfish and shellfish aquaculture. Aquac Fish. 2025;10 [6] :931-944. doi:10.1016/j.aaf.2025.06.005.
- Komba RS, Mwita CJ, Kimaro EG. Cage-cultured Nile tilapia (Oreochromis niloticus) farming: a third generation of pollution in Lake Victoria, Tanzania. Aquac Fish Fish. 2025;5 [4] . doi:10.1002/aff2.70108.
- Shamsuddin M, Hossain MB, Rahman M, Kawla MS, Tazim MF, Albeshr MF, et al. Effects of stocking larger-sized fish on water quality, growth performance, and the economic yield of Nile tilapia (Oreochromis niloticus L.) in floating cages. Agriculture. 2022;12 [7] :942. doi:10.3390/agriculture12070942.
- Domínguez-May R, Poot-López GR, Hernández JM, Velázquez-Abunader I. Optimization of feed ration size in aquatic system according to the optimal control approach: implications of using the von Bertalanffy growth model. Aquac Res. 2024;2024:6512507. doi:10.1155/2024/6512507.
- New MB. Feed and feeding of fish and shrimp. Rome: FAO/UNDP; 1987.
- Turchini GM, Hardy RW. Research in aquaculture nutrition: what makes an experimental feeding trial successful? Rev Fish Sci Aquac. 2024;33 [3] :487-495. doi:10.1080/23308249.2024.2413672.
- SAS Institute Inc. SAS/STAT user's guide. Version 9.1. Cary (NC): SAS Institute Inc.; 2004.
- Duncan DB. Multiple range and multiple F tests. Biometrics. 1955;11 [1] :1-42.
- Wu Z, Xu Q, Feng L, Wang J, Xu Y, Wu Y, et al. Effects of different stocking densities on growth performance, stress resistance, antioxidant capacity and immunity of grass carp. Animals. 2026;16 [5] :745. doi:10.3390/ani16050745.
- Li Z, Gao Q, Dong S, Dong K, Xu Y, Mei Y, et al. Effects of chronic stress from high stocking density in mariculture: evaluations of growth performance and lipid metabolism of rainbow trout (Oncorhynchus mykiss). Biology. 2024;13 [4] :263. doi:10.3390/biology13040263.
- Zhang K, Ye Z, Qi M, Cai W, Saraiva JL, Wen Y, et al. Water quality impact on fish behavior: a review from an aquaculture perspective. Rev Aquac. 2024;17 [1] . doi:10.1111/raq.12985.
- Yu M, Feng Y, Ouyang B, Wills PS, Tang Y. Dissolved oxygen in aquaculture ponds: causal factors, predictive modeling, and intelligent monitoring. Aquac Eng. 2026;112:102634. doi:10.1016/j.aquaeng.2025.102634.
- Zhang R, Li H, Wang X, Liu L, Zhu H. Potential benefits of glycine, proline and hydroxyproline on growth and flesh quality of mirror carp (Cyprinus carpio var. specularis). Int J Mol Sci. 2025;26 [18] :9011. doi:10.3390/ijms26189011.
- Nagaraja PS, Pathan MA, Raghul R, Susitharan V, Sanwal P, Krishnan S, et al. Variability in harvest growth traits and genetic parameters in common carp, Cyprinus carpio (Linnaeus, 1758), cultured in extracted inland saline groundwater. Aquac Int. 2026;34 [3] :89. doi:10.1007/s10499-026-02478-2.