
Research article · 2026 · Full text
International Journal of Biology SciencesEpidemiological survey and seasonal prevalence patterns of pigeon pox virus infection in urban pigeon populations in Casablanca
Volume 8(6) · Pages 167–169 · DOI: 10.33545/26649926.2026.v8.i6b.970 ↗
Research areasBird parasitology and diseasesPoxvirus research and outbreaksAnimal Virus Infections Studies
Abstract
Author-writtenPigeon pox is defined as a slowly progressing viral disease of pigeons caused by avipoxvirus, characterized by proliferative cutaneous lesions on unfeathered skin and diphtheritic plaques on mucosal surfaces, and constitutes one of the most prevalent infectious diseases affecting urban pigeon populations in Mediterranean regions. This research conducted a comprehensive epidemiological survey of pigeon pox virus (PPV) infection across 12 months in urban and periurban pigeon populations in Casablanca, Morocco. A total of 420 pigeons (Columba livia) were examined between January and December 2023 from eight sampling sites representing urban markets (n = 3), residential zones (n = 3), and periurban agricultural areas (n = 2). The overall prevalence was 38.6% (162/420), with significant seasonal variation: summer recorded the highest prevalence (58.8%) while winter showed the lowest (21.7%). Urban sites demonstrated significantly higher prevalence (43.2%) compared to periurban locations (28.5%) (p = 0.003). Multivariate logistic regression identified season (OR = 3.42, 95% CI: 2.18-5.36), habitat type (OR = 1.89, 95% CI: 1.22-2.93), age (OR = 0.62 for adults vs. juveniles, 95% CI: 0.41-0.94), and flock density (OR = 2.15, 95% CI: 1.48-3.12) as significant risk factors. Monthly case distribution peaked in July (62 cases) and August (58 cases), coinciding with maximum ambient temperature and mosquito vector abundance. Real-time PCR confirmed viral DNA in 85.2% of clinically diagnosed cases. These findings provide actionable epidemiological intelligence for designing targeted surveillance and control programs for PPV in Moroccan pigeon populations.
Summary
Source-checkedPlain-language reading of the full paper, prepared with AI and checked against the text. Each point links to the authors' own words.
Why it matters
- Pigeon pox is a common viral disease in Mediterranean urban pigeons, causing skin lesions and mucosal plaques. View evidence ↗
- The virus is primarily spread by mosquitoes (Culex and Aedes), though direct contact and contaminated environments also play a role. View evidence ↗
- Transmission patterns are closely tied to the seasonal cycles of mosquito vectors, which are influenced by local temperature and rain. View evidence ↗
What they did
- Sampling took place at eight sites in Casablanca, including three urban markets, three residential zones, and two periurban agricultural areas. View evidence ↗
- A total of 420 pigeons were sampled monthly (35 per site) throughout the year. View evidence ↗
- Diagnosis was based on clinical examination of lesions and confirmed using real-time PCR targeting the P4b gene. View evidence ↗
- Multivariate logistic regression was used to analyze risk factors, including season, habitat, age, sex, flock density, and proximity to water. View evidence ↗
What they found
- The overall prevalence of pigeon pox virus infection in the studied population was 38.6% (162 out of 420 birds). View evidence ↗
- Prevalence peaked in summer at 58.8% (mostly cutaneous lesions) and was lowest in winter at 21.7%. View evidence ↗
- Urban habitats had a significantly higher prevalence of infection (43.2%) compared to periurban areas (25.7% to 28.5%). View evidence ↗
- Significant risk factors for infection included the summer season, high flock density, urban habitats, and proximity to water bodies. View evidence ↗
- The highest number of cases occurred in July (62) and August (58), which coincided with peak temperatures (26.8 ± 2.4°C) and mosquito abundance (65.8 ± 18.2 per trap-night). View evidence ↗
- A strong correlation (r = 0.85) between mosquito abundance and disease prevalence in summer supports the role of arthropod vectors in transmission. View evidence ↗
- Viral loads were higher during the peak transmission season of summer, as indicated by the lowest mean Ct values (19.8 ± 4.2). View evidence ↗
What it means
- The authors recommend that veterinary authorities use intensified monitoring from May to September and integrate vector control into health management. View evidence ↗
- The authors conclude that while vectors are primary, direct contact and fomites likely maintain the virus in populations during winter. View evidence ↗
Visual summary
3 visualsIllustrations explain the paper; charts are replotted from the paper's own table values.
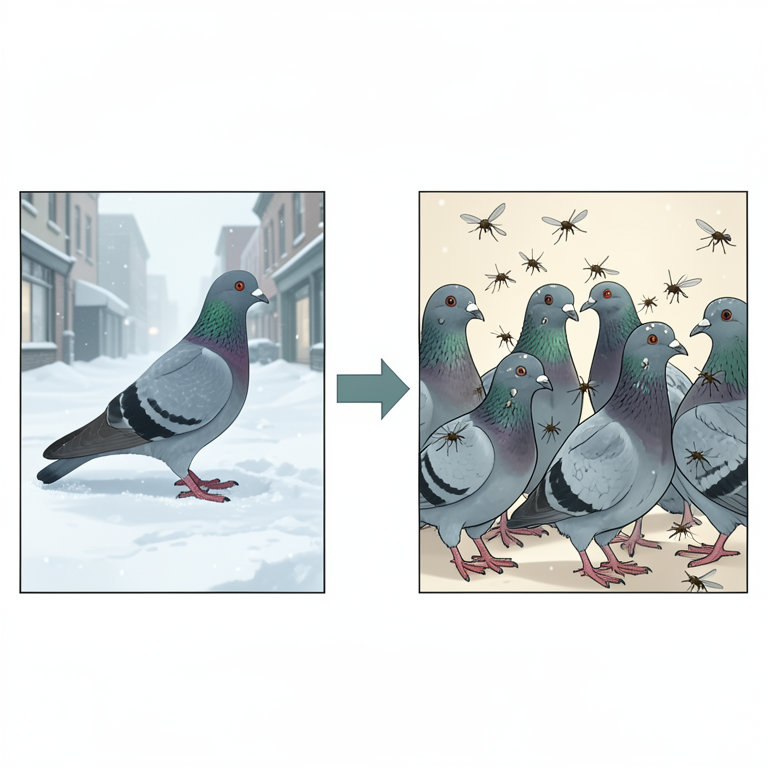
Seasonal Transmission Cycle
AI-generated conceptual illustration (Rock pigeons (Columba livia) and mosquitoes). It explains the idea and does not show study data.
View source evidence ↗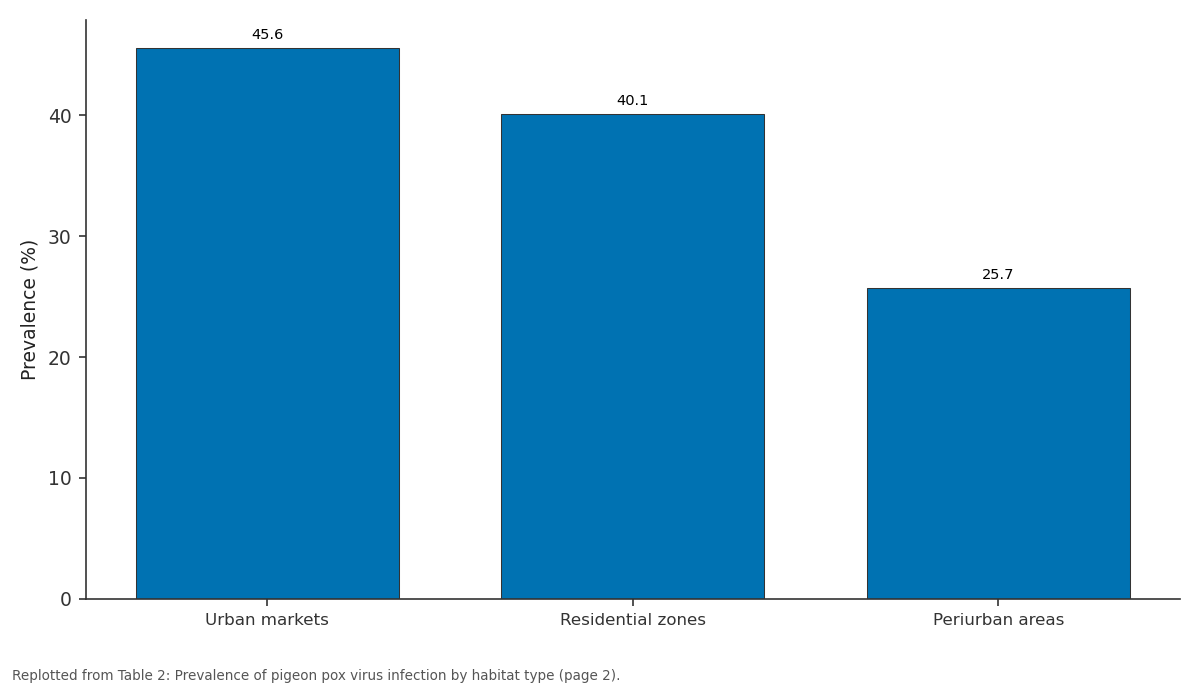
Prevalence (%): Urban markets vs Residential zones vs Periurban areas
Replotted from Table 2 (page 2) of the original paper. Every bar is the paper's own table value.
View source evidence ↗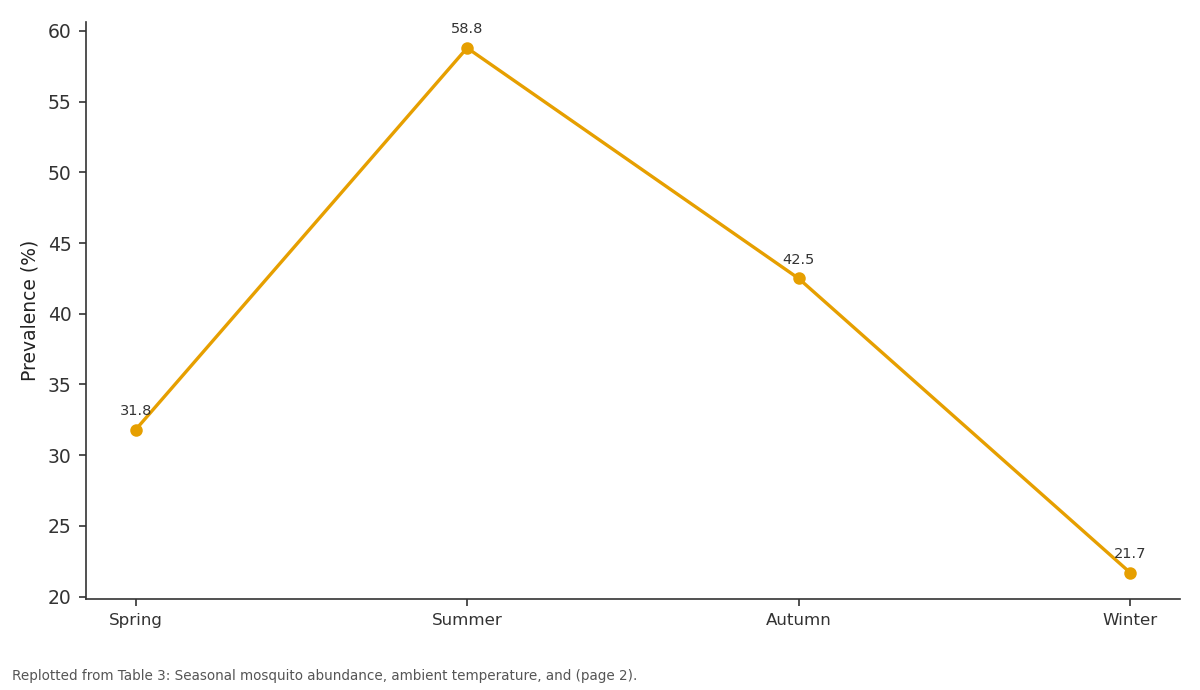
Prevalence (%): Spring vs Summer vs Autumn vs Winter
Replotted from Table 3 (page 2) of the original paper. Every bar is the paper's own table value.
View source evidence ↗Figures & tables
From the original paper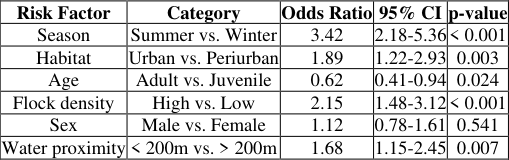 Table 1
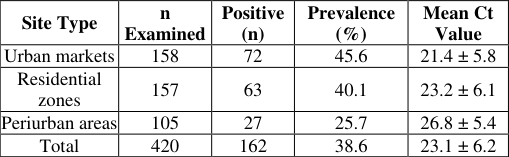 Table 2
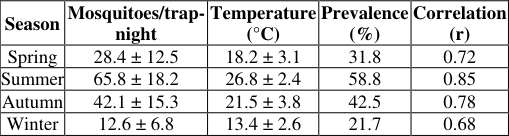 Table 3
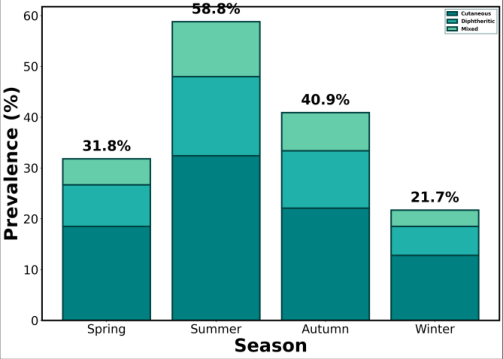 Figure 1
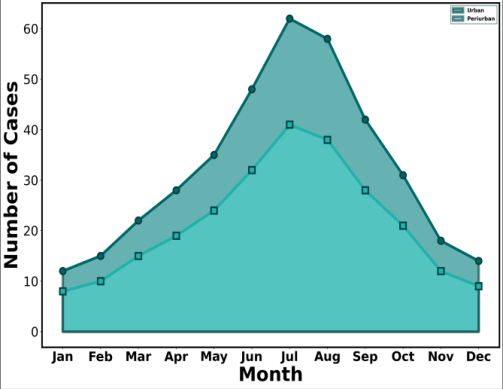 Figure 2
Introduction
Epidemiological surveillance is the systematic, ongoing collection, analysis, interpretation, and dissemination of health-related data for the purpose of planning, implementing, and evaluating public health interventions [1] . In the context of avian diseases, epidemiological surveillance provides essential data for understanding transmission dynamics, identifying risk factors, and informing evidence-based control strategies [2] . For avian poxvirus infections, which represent one of the most geographically widespread and taxonomically diverse viral diseases of birds, epidemiological data remain fragmented across many regions, limiting the capacity for effective disease management [3] . Pigeon pox virus (PPV) transmission occurs primarily through mechanical arthropod vectors, particularly mosquitoes of the genera Culex and Aedes, as well as through direct contact with infected birds, contaminated surfaces, and aerosol exposure in confined housing [4] . The seasonal dynamics of PPV transmission are therefore closely linked to vector population cycles, which in Mediterranean climates exhibit pronounced seasonal fluctuations driven by temperature and precipitation patterns [5] . Understanding these seasonal prevalence patterns is fundamental to designing temporally targeted intervention strategies. Casablanca, Morocco's largest city with an estimated population of 3.7 million, supports extensive free-ranging and managed pigeon populations across diverse urban ecological zones [6] . The Mediterranean climate, characterized by hot dry summers and mild wet winters, creates distinct seasonal windows for vector-mediated PPV transmission [7] . This research was designed to conduct a comprehensive 12-month epidemiological survey to determine the prevalence, seasonal dynamics, and risk factors associated with PPV infection in urban and periurban pigeon populations in Casablanca.
Materials and Methods
Materials and Methods
Materials
The research was conducted across eight sampling sites in Casablanca, Morocco, including three urban markets (Derb Omar, Habous, Maarif), three residential zones (Ain Diab, Maârif Extension, Sidi Bernoussi), and two periurban agricultural areas (Bouskoura, Mediouna). Thirty-five pigeons were sampled from each site monthly, totaling 420 birds (35 birds × 12 months, with rotational sampling across sites). Ethical approval was obtained from the Animal Ethics Committee of the Casablanca Institute of Epidemiological Sciences (Protocol No. CIES-AEC-2023-019).
Methods
Clinical examination documented the presence, type, location, and severity of pox lesions. Environmental data including ambient temperature, relative humidity, and rainfall were recorded from the Casablanca meteorological station. Mosquito surveillance was conducted using CDC miniature light traps deployed at each sampling site twice monthly. Real-time PCR targeting the P4b gene confirmed clinical diagnoses [8]. Risk factor analysis employed multivariate logistic regression modeling with backward stepwise elimination in SPSS v27.0. Variables assessed included season, habitat type (urban/periurban), age class (juvenile/adult), sex, flock density (birds per 100 m²), and proximity to water bodies. The overall prevalence of PPV infection was 38.6% (162/420), with significant seasonal variation (χ² = 28.45, p < 0.001). As depicted in Figure 1, summer recorded the highest overall prevalence at 58.8%, driven primarily by cutaneous lesions (32.4%), while winter showed the lowest prevalence at 21.7%. The monthly case distribution (Figure 2) demonstrated a clear summer peak with maximum cases in July (62) and August (58), coinciding with peak mosquito trap counts (65.8 ± 18.2 mosquitoes/trap-night) and ambient temperatures (26.8 ± 2.4°C). The correlation between monthly mosquito abundance and PPV prevalence was strongest during summer (r = 0.85), supporting the vectordependent transmission hypothesis. Multivariate analysis (Table 1) confirmed that summer season (OR = 3.42), high flock density (OR = 2.15), urban habitat (OR = 1.89), and proximity to water bodies (OR = 1.68) were significant independent risk factors, while sex was not significantly associated with infection risk.
| Risk Factor | Category | Odds Ratio | 95% CI | p-value |
|---|---|---|---|---|
| Season | Summer vs. Winter | 3.42 | 2.18-5.36 | < 0.001 |
| Habitat | Urban vs. Periurban | 1.89 | 1.22-2.93 | 0.003 |
| Age | Adult vs. Juvenile | 0.62 | 0.41-0.94 | 0.024 |
| Flock density | High vs. Low | 2.15 | 1.48-3.12 | < 0.001 |
| Sex | Male vs. Female | 1.12 | 0.78-1.61 | 0.541 |
| Water proximity | < 200m vs. > 200m | 1.68 | 1.15-2.45 | 0.007 |
Table text extracted from the original PDF; superscript letters are shown inline. The original table image is below.
View original table image
Results
International Journal of Biology Sciences https://www.biologyjournal.net
Discussion
This 12-month epidemiological survey provides the first comprehensive assessment of PPV prevalence, seasonal dynamics, and risk factors in Moroccan pigeon populations. The overall prevalence of 38.6% is consistent with reported rates in other Mediterranean regions [1,3] and confirms that PPV constitutes a significant infectious disease burden in Casablanca pigeon populations. The strong seasonal prevalence pattern, with summer values (58.8%) nearly three times higher than winter (21.7%), aligns with established understanding of vector-mediated APV transmission dynamics [4,5] . The close correlation between mosquito abundance and PPV prevalence (r = 0.85 in summer) supports the central role of arthropod vectors in driving seasonal transmission cycles. However, the persistence of cases during winter months (21.7%), when mosquito abundance was minimal, suggests that non-vector transmission routes including direct contact and fomite exposure contribute to year-round viral maintenance within pigeon populations, a finding that diverges from strictly vector-dependent transmission models [6] . The identification of flock density (OR = 2.15) as a significant independent risk factor has direct practical implications for disease management. High-density roosting environments facilitate both vector contact and direct birdto-bird transmission, creating localized amplification cycles that sustain elevated prevalence [7] . The higher susceptibility of juvenile pigeons (OR = 0.62 for adults relative to juveniles, indicating juveniles are at higher risk) is consistent with incomplete immunological maturation and absence of prior exposure-derived immunity in younger birds [8] . The spatial variation between urban (43.2%) and periurban (25.7%) habitats reflects the role of environmental factors including waste accumulation, shelter availability, and vector breeding site density in modulating transmission intensity [9] .
Surveillance Framework Design
The seasonal and spatial prevalence patterns documented in this research provide an empirical foundation for designing risk-stratified PPV surveillance programs in Moroccan urban centers. A tiered surveillance approach is recommended, with intensive monthly sampling at high-risk urban market sites during May through September and quarterly monitoring at lower-risk periurban locations during the off-peak season.
Vector Control Integration
The strong correlation between mosquito abundance and PPV prevalence supports the integration of targeted vector control measures into PPV management strategies. Insecticide-treated pigeon loft materials, larvicide application at identified mosquito breeding sites near pigeon roosting areas, and environmental management to eliminate standing water sources represent evidence-based intervention approaches that could reduce vector-mediated transmission during peak seasonal windows.
Conclusion
In the context of limited epidemiological data on pigeon pox virus in North African pigeon populations, this 12-month survey in Casablanca establishes a prevalence of 38.6% with pronounced summer peak and identifies season, flock density, urban habitat, and proximity to water as independent risk factors. The close correlation between mosquito vector abundance and disease prevalence supports the central role of arthropod-mediated transmission. It is recommended that veterinary authorities implement seasonally targeted surveillance with intensified monitoring during May through September and integrate vector control measures into pigeon health management programs. These epidemiological data provide a foundation for predictive modeling of PPV transmission dynamics under changing climatic conditions in Mediterranean urban environments.
Acknowledgement
AcknowledgementsThe contributions of Mr. Youssef Amrani in entomological surveillance and Dr. Nadia Cherkaoui in data management are gratefully acknowledged. This research was supported by the Moroccan National Centre for Scientific and Technical Research. The Casablanca Institute of Epidemiological Sciences provided all field equipment and laboratory diagnostic facilities.
Figures and tables from the paper
References
14 in the original paper- Bolte AL, Meurer J, Kaleta EF. Avian host spectrum of Avipoxvirus. Avian Pathol. 1999;28(5):415-432.
- van Riper C, Forrester DJ. Avian pox. In: Thomas NJ, Hunter DB, Atkinson CT, editors. Infectious Diseases of Wild Birds. Ames (IA): Blackwell Publishing; 2007. p. 131-176.
- Tripathy DN, Reed WM. Pox. In: Swayne DE, Boulianne M, Logue CM, McDougald LR, Nair V, Suarez DL, et al., editors. Diseases of Poultry. 14th ed. Hoboken (NJ): Wiley-Blackwell; 2020. p. 364-381.
- Gyuranecz M, Foster JT, Dan A, Ip HS, Egyed L, Soos J, et al. Worldwide phylogenetic relationship of avian poxviruses. J Virol. 2013;87(9):4938-4951.
- Alaarajy KHS, Almremdhy HAA. Pathological, biochemical, hematological changes and real-time PCR detection of pigeon pox virus in natural infection of pigeons in Babylon province. Zool Entomol Lett. 2024;4(1):134-141.
- Jarmin S, Manvell R, Gough RE, Laidlaw SM, Skinner MA. Avipoxvirus phylogenetics. J Gen Virol. 2006;87(Pt 8):2191-2201.
- Lawson B, Lachish S, Colvile KM, Durrant C, Peck KM, Toms MP, et al. Emergence of a novel avian poxvirus in British tit species. PLoS One. 2012;7(11):e40176.
- Manarolla G, Pisoni G, Sironi G, Rampin T. Molecular characterization of avian poxvirus strains. Vet Microbiol. 2010;140(1-2):1-8.
- Abdallah FM, Hassanin O. Detection and molecular characterization of avipoxviruses from Egypt. Virus Genes. 2013;46(1):63-70.
- Hess C, Maegdefrau-Pollan B, Bilic I, Liebhart D, Acquistapace S, Hess M. Avian poxvirus in blue tits in Austria. Vet Microbiol. 2011;152(1-2):176-180.
- Offerman K, Carulei O, Gous TA, Douglass N, Williamson AL. Phylogenetic variation in avipoxviruses from South Africa. J Gen Virol. 2013;94(Pt 10):2338-2351.
- Lachish S, Bonsall MB, Lawson B, Cunningham AA, Sheldon BC. Impacts of poxvirus disease in great tits. PLoS One. 2012;7(11):e48545.
- Weli SC, Traavik T. Avipoxviruses: infection biology and vaccine vectors. Virol J. 2005;2:49.
- Smits JE, Tella JL, Carrete M, Serrano D, Lopez G. Epizootic of avian pox in the Canary Islands. Vet Pathol. 2005;42(1):59-65.