
Research article · 2026 · Full text
International Journal of Geography Geology and EnvironmentSpatio-temporal analysis of climate variability and food security in Haryana
Volume 8(5) · Pages 76–85 · DOI: 10.22271/27067483.2026.v8.i5a.811 ↗
Research areasClimate change impacts on agricultureAgricultural Economics and PracticesHydrology and Drought Analysis
Abstract
Author-writtenThis study presents a comprehensive spatio-temporal analysis of climate variability and its implications for food security across the agro-climatic zones of Haryana, India, covering the period 1990-2022. Integrating gridded rainfall and temperature data from the India Meteorological Department (IMD), district-level crop production statistics, and multi-round National Family Health Survey (NFHS) data on nutritional indicators, the study employs a suite of statistical and spatial methods including the Mann-Kendall trend test, Sen's Slope estimator, Standardised Precipitation Index (SPI), Principal Component Analysis (PCA), and a composite Food Security Index (FSI). Results reveal a statistically significant declining rainfall trend of -1.8 mm/year and a rising mean temperature of +0.04 °C/year, with pronounced spatial heterogeneity across districts. The north-eastern districts record nearly three times the annual rainfall of south-western districts, creating markedly divergent agro-climatic risk profiles. While total food grain production has doubled from 12.5 to 25.9 million tonnes over the study period driven primarily by groundwater-dependent irrigation the sustainability of this trajectory is increasingly threatened by accelerating water-table decline. The composite FSI indicates that Haryana, despite being a food surplus state, performs poorly on dimensions of nutritional utilization and climatic stability. The study identifies five spatially distinct vulnerability zones and recommends differentiated adaptive policies including crop diversification, demand-side groundwater management, and enhanced nutritional safety nets.
Summary
Source-checkedPlain-language reading of the full paper, prepared with AI and checked against the text. Each point links to the authors' own words.
Why it matters
- Climate variability is a major threat to global food security, especially for agrarian economies that rely on monsoon rains. View evidence ↗
- Haryana is critical to India's national food security, providing about 15% of wheat and 5% of rice procurement while using less than 1.4% of the country's land. View evidence ↗
- The high-productivity model in Haryana, based on wheat-paddy monocultures and heavy groundwater use, is becoming strained due to changing climate patterns. View evidence ↗
The question
- The study aims to link climate variability with food security outcomes across all 22 districts of Haryana over a 33-year period from 1990 to 2022. View evidence ↗
What they did
- The researchers used IMD climate data, crop statistics, and NFHS nutritional data, applying tools like the Mann-Kendall test, Sen's Slope, SPI, PCA, and a composite Food Security Index. View evidence ↗
- The Food Security Index (FSI) was built on four dimensions: availability, access, utilization, and stability. View evidence ↗
What they found
- Annual rainfall in Haryana showed a statistically significant decline of 1.8 mm/year, totaling a loss of about 59 mm (nearly 11% of the mean) over the study period. View evidence ↗
- Temperatures rose significantly, with mean maximums increasing by 0.45 °C per decade and mean minimums by 0.38 °C per decade. View evidence ↗
- Total food grain production increased by 107%, rising from 12.5 million tonnes in 1990 to 25.9 million tonnes in 2022. View evidence ↗
- The water table deepened by 35.6 meters over 33 years, moving from 8.2 mbgl in 1990 to 43.8 mbgl in 2022, an average annual decline of 1.08 meters. View evidence ↗
- Despite food abundance, nutritional deficits are high: 27.1% of children under 5 are stunted, 21.0% are wasted, and 62.7% of women of reproductive age are anaemic. View evidence ↗
- The Semi-Arid South-West (Zone V) is the most vulnerable region, with the highest sensitivity (0.82) and exposure (0.88), and the lowest adaptive capacity (0.31). View evidence ↗
What it means
- The authors conclude that groundwater depletion is the most critical long-term threat to food security in Haryana, outweighing short-term climate variability. View evidence ↗
- The authors recommend a state-level Millet Mission to bring back crops like bajra, jowar, and ragi to improve climate resilience and nutrition. View evidence ↗
- The authors state that future research should integrate RCP 4.5 and RCP 8.5 climate projection scenarios to model future food security. View evidence ↗
Visual summary
1 visualsIllustrations explain the paper; they do not show study data.
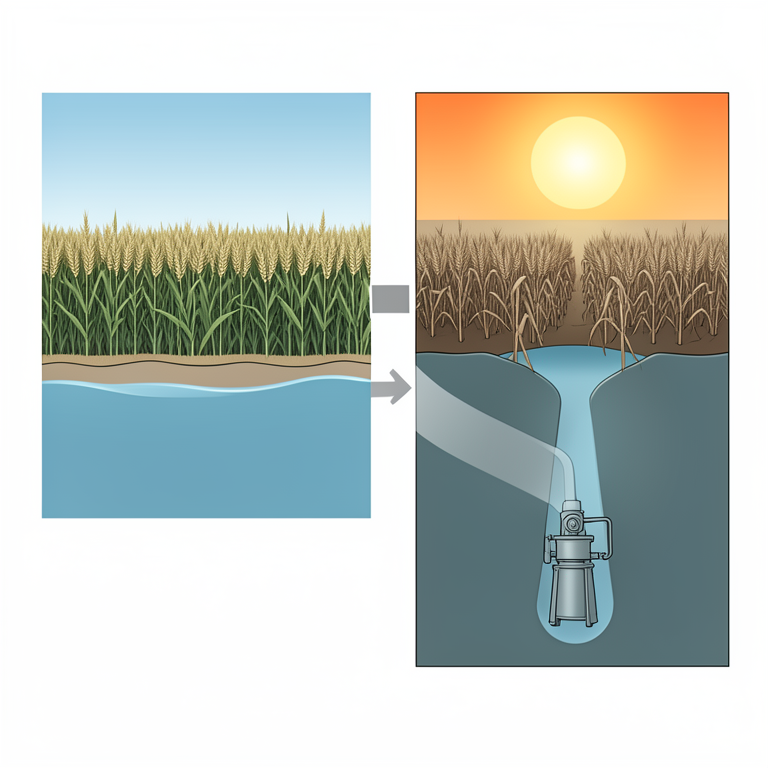
The Groundwater-Food Security Cycle
AI-generated conceptual illustration (Wheat fields and groundwater aquifers in Haryana, India). It explains the idea and does not show study data.
View source evidence ↗Figures & tables
From the original paper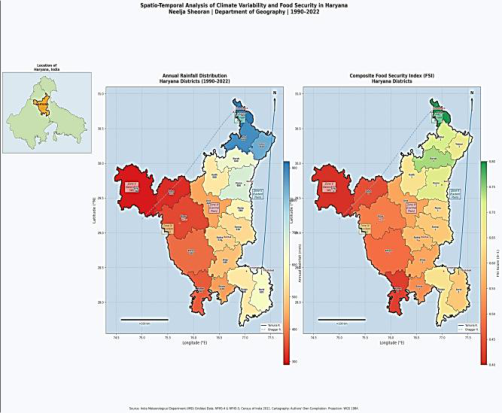 Figure 2
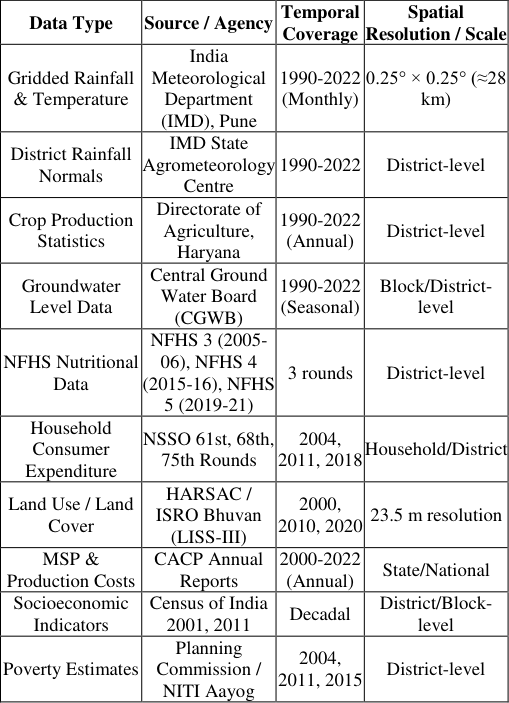 Table 1
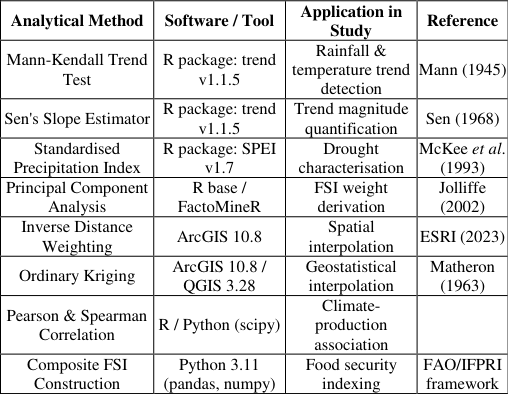 Table 2
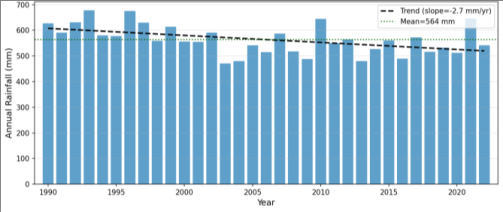 Figure 1
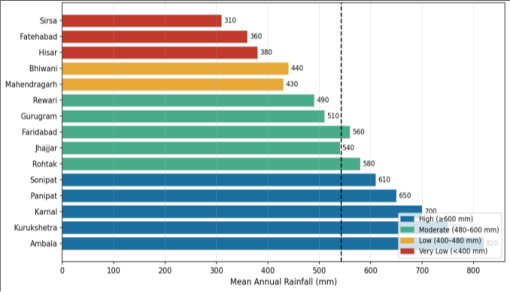 Figure 2
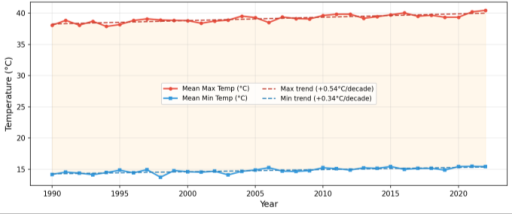 Figure 3
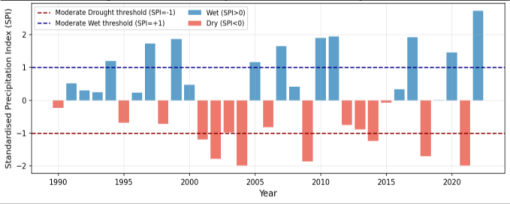 Figure 7
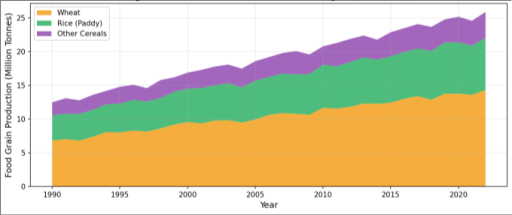 Figure 4
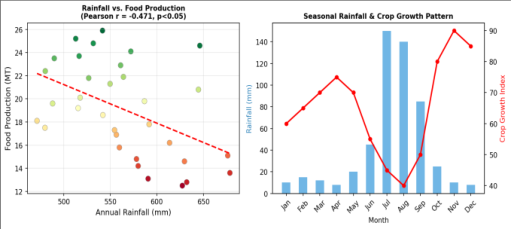 Figure 5
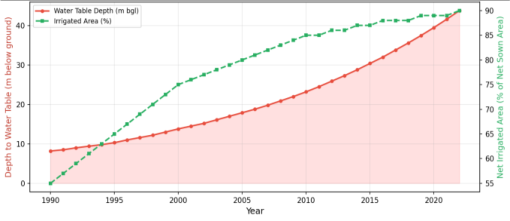 Figure 8
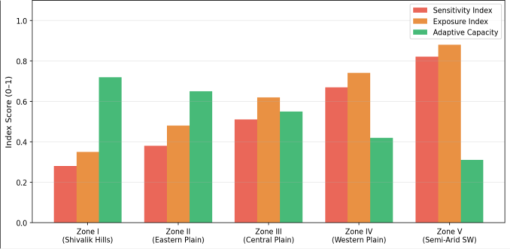 Figure 9
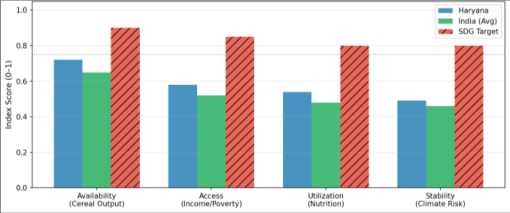 Figure 6
 Figure 10
Introduction
Climate variability constitutes one of the most pervasive and enduring threats to global food security, particularly in developing agrarian economies dependent on monsoon rainfall. The Intergovernmental Panel on Climate Change (IPCC) in its Sixth Assessment Report (AR6) has underscored that climate-induced agricultural disruptions will disproportionately affect South Asian nations, where food systems remain structurally exposed to hydrometeorological extremes [1] . Haryana, a north-western Indian state and a cornerstone of the country's food grain economy, exemplifies this nexus with singular clarity. Contributing approximately 15% of India's wheat procurement and 5% of its rice procurement despite occupying less than 1.4% of the national geographical area, Haryana's agricultural productivity has been a linchpin of national food security since the Green Revolution of the 1960s. However, the model of intensification that enabled this productivity characterised by high-yielding variety (HYV) monocultures of wheat and paddy, intensive groundwater extraction, and heavy input subsidies is increasingly strained by evolving climate patterns. The Food and Agriculture Organization defines food security as existing when 'all people, at all times, have physical and economic access to sufficient, safe and nutritious food that meets their dietary needs and food preferences for an active and healthy life' (FAO, 1996). This conceptualisation encompasses four interrelated pillars: food availability, economic and physical access, biological utilization, and stability over time [2] . Haryana's geography presents a natural laboratory for studying the interplay of climatic gradients and food system outcomes. Spanning an area of 44,212 sq. km between 27°37'N-30°35'N latitudes and 74°27'E-77°36'E longitudes, the state encompasses five distinct agro-climatic zones transitioning from humid sub-montane conditions in the north-east (Ambala, Kurukshetra) to arid conditions in the south-west (Sirsa, Fatehabad). This gradient generates profound contrasts in agricultural productivity, groundwater availability, and food security outcomes that aggregate state-level analyses systematically mask. Despite the policy salience of this subject, peer-reviewed studies integrating climate trend analysis with a multidimensional food security assessment at the district scale for Haryana remain scarce. Existing literature either focuses on national or pan-India rainfall trends (Rajeevan et al., 2008; Kumar et al., 2010) or addresses food security without adequately coupling it to spatial climate dynamics [3 4] . The present study addresses this gap by constructing an integrated analytical framework that links spatio-temporal climate variability with food security outcomes across all 22 districts of Haryana over a 33-year period (1990-2022). In DOIng so, it contributes to both the scientific literature on climate-agriculture interactions and to the evidence base required for spatially targeted policy interventions aligned with India's National Action Plan on Climate Change (NAPCC) and the United Nations Sustainable Development Goal 2 (Zero Hunger).
Research Objectives
This study is guided by the following specific research objectives: 1. To examine and quantify the long-term spatio-temporal trends in annual and seasonal rainfall and temperature across Haryana at the district level for the period 1990-2022, using the Mann-Kendall test and Sen's Slope estimator. 2. To assess drought frequency and severity across the state using the Standardised Precipitation Index (SPI) and to delineate drought-prone zones. 3. To analyse the spatial and temporal patterns of food grain production (wheat and rice) in relation to climatic variables, and to estimate climate-production elasticities. 4. To assess groundwater depletion trends and their coevolution with irrigation expansion and rainfall deficit. 5. To construct a composite, multi-dimensional Food Security Index (FSI) at the district level and to identify food-insecure zones and their climate exposure. 6. To recommend spatially differentiated, evidence-based policy interventions for enhancing climate resilience and food security across the agro-climatic zones of Haryana.
2 FAO (1996). Rome Declaration on World Food Security and World Food Summit Plan of Action. Food and Agriculture Organization of the United Nations, Rome, Italy. 3 Rajeevan, M., Bhate, J., & Jaswal, A. K. (2008). Analysis of variability and trends of extreme rainfall events over India using 104 years of gridded daily rainfall data. Geophysical Research Letters, 35, L18707. 4 Kumar, V., Jain, S. K., & Singh, Y. (2010). Analysis of long-term rainfall trends in India. Hydrological Sciences Journal, 55(4), 484-496.
Significance and Scope
The significance of this study is threefold. [5] .
According to the 2011 Census, Haryana had a total population of 25.35 million with a decadal growth rate of 19.9%. The population density of 573 persons per sq. km is significantly higher than the national average, placing considerable pressure on land and water resources. The rural population constitutes approximately 65% of the total, and about 44% of the total workforce is engaged in agriculture and allied activities.
Physiographic Divisions and Agro-Climatic Zones
The state's physiography can be broadly classified into three macro-units: (i) the Shivalik Hills and piedmont zone in the north-east, characterised by undulating topography and relatively higher rainfall; (ii) the Ghaggar-Yamuna alluvial plain forming the central and eastern belt with deep alluvial soils of high agricultural productivity; and (iii) the sandy plain and semi-arid zone of the south-west, with aeolian sandy soils of low fertility and high drought susceptibility. For agricultural planning, the Haryana government delineates five agro-climatic zones: Zone I (Shivalik Hills), Zone II (Eastern Plain), Zone III (Central Plain), Zone IV (Western Plain), and Zone V (Semi-Arid South-West). These zones exhibit marked differences in rainfall, soil type, crop suitability, and groundwater availability, which form the basis of the spatially differentiated analysis in this study.
Agricultural Profile
Agriculture in Haryana is dominated by the wheat-rice (paddy) rotation system, a legacy of the Green Revolution that replaced the more diverse crop mosaic of millets, pulses, and oilseeds. The net sown area is approximately 3.6 million hectares, accounting for ~82% of the state's total geographical area one of the highest proportions in India. The gross cropped area exceeds 6.0 million ha due to a high cropping intensity (~163%). Irrigated agriculture accounts for over 85% of the gross cropped area, with tube-wells supplying approximately 70% of total irrigation water [6] .
The state is a leading producer of wheat (annual output ~12-14 MT), rice (~4-5 MT), mustard, sugarcane, cotton, and vegetables. It is classified as a 'food surplus' state by the Commission for Agricultural Costs and Prices (CACP), regularly procuring grains for the central pool through the Food Corporation of India (FCI). However, this agricultural success has come at significant ecological costs, particularly in terms of groundwater depletion and loss of agricultural biodiversity [7] .
Climate Variability and Agricultural Production
The relationship between climate variability and agricultural production has been extensively studied at global and regional scales. Uttar Pradesh, attributing these to weakening of the summer monsoon circulation associated with aerosol loading and land use change [8,9] . Temperature studies by Kothawale et al. (2010) documented statistically significant warming across India at +0.22 °C/decade over 1971-2007, with minimum temperatures rising faster than maximum temperatures a pattern consistent with the findings of the present study. Singh et al. (2002) specifically highlighted increasing temperature variability over the Indo-Gangetic Plains, noting consequential impacts on wheat grain-filling duration and yield quality [10] .
Food Security Frameworks and Measurement
The conceptual evolution of food security measurement has progressed from simple caloric availability metrics to multidimensional frameworks. The FAO's four-pillar framework (availability, access, utilization, stability) remains the dominant paradigm in policy research. The IFPRI Global Hunger Index (GHI) and the Economist Intelligence Unit's Global Food Security Index (GFSI) have operationalised this framework at national scales [11,12] . At the sub-national level within India, food security assessments have typically relied on NFHS data for nutritional outcomes and NSSO Consumer Expenditure Surveys for caloric access proxies. Studies by Swaminathan (2010) and the M. S. Swaminathan Research Foundation have emphasised the 'hidden hunger' dimension micronutrient deficiencies prevalent even in food-surplus states like Haryana and Punjab, arising from dietary monocropping and loss of nutrient-dense traditional foods [13,14] .
Groundwater and Food Security Nexus
The intersection of groundwater depletion with food security represents an emerging area of critical concern. The World Bank (2021) classified Haryana as one of the most groundwater-stressed regions in the world, with the water table declining at 0.5-1.5 metres per year in several districts. A study by Rodell et al. (2009) using GRACE satellite gravimetry data confirmed the rapid depletion of groundwater reserves across north-western India, attributing it primarily to agricultural over-extraction [15,16] . The Central Ground Water Board (CGWB) classifies groundwater development status at the block level, and as of 2022, 78 of Haryana's 141 blocks are classified as 'overexploited' and 5 as 'critical', implying extraction rates exceeding annual recharge. This trajectory poses a longterm systemic risk to Haryana's food production system that ranscends short-term climate variability [17] .
Research Gap
Despite the rich body of work on climate-agriculture interactions and food security measurement individually, integrated spatio-temporal analyses linking district-level climate trend data to a multi-dimensional food security framework with explicit incorporation of groundwater sustainability remain scarce for Haryana. The present study addresses this gap comprehensively.
Data Sources and Methodology 4.1 Data Sources
The study integrates multi-source, multi-temporal datasets spanning the period 1990-2022. Table 1 provides a comprehensive overview of all data sources, their spatial and temporal resolutions, and their relevance to the analytical framework [18] . 2.576). The MK test is preferred over parametric alternatives for hydro-meteorological data due to its robustness to non-normality and resistance to outliers [19] . Pre-whitening was applied using the TFPW (Trend-Free Pre-Whitening) procedure of Yue et al. (2002) to remove the influence of serial autocorrelation, which can inflate Type I error rates in trend detection. All MK computations were performed using the R package 'trend' (v1.1.5).
Sen's Slope Estimator
The magnitude of detected trends was quantified using Sen's Slope estimator (Q), defined as the median of all pairwise slopes between data points in the time series. This nonparametric estimator is robust to outliers and has been widely validated in hydro-climatic applications. Values are reported in units of mm/year (rainfall) and °C/year (temperature) [20] .
Standardised Precipitation Index (SPI)
The Standardised Precipitation Index (SPI) was computed at the 12-month time scale (SPI-12) to characterise annual drought severity. The SPI is calculated by fitting the gamma distribution to historical monthly precipitation accumulations, followed by a normal score transformation. SPI values below -1.0 indicate moderate drought, below -1.5 severe drought, and below -2.0 extreme drought. The SPI was computed at the district level using the R package 'SPEI' (v1.7) [21] .
Food Security Index Construction
A composite Food Security Index (FSI) was constructed following the methodology of FAO (2012) and the IFPRI Resilience Index Measurement and Analysis (RIMA) framework. The FSI comprises four dimensional sub-indices aligned with the four pillars of food security: (i) Availability Index (AI) based on per capita cereal production and crop yield variability; (ii) Access Index (AcI) based on per capita income, poverty headcount ratio, and food price index; (iii) Utilization Index (UI) based on NFHS indicators of stunting, wasting, anaemia prevalence, and sanitation access; and (iv) Stability Index (SI) based on SPI-12 drought frequency, CV of annual rainfall, and groundwater depletion rate. All sub-indicators were normalised to a 0-1 scale using minmax normalisation, with 1 representing the best performance. Weights for aggregation were determined through PCA-based variance decomposition, ensuring that the index structure is empirically grounded rather than subjectively assigned. The composite FSI is the weighted mean of the four sub-indices.
Spatial Analysis
Spatial interpolation of district-level climate and food security data was performed using Inverse Distance Weighting (IDW) and Ordinary Kriging methods in ArcGIS 10.8. The resulting raster surfaces were used to produce choropleth maps and vulnerability zone delineations. Spatial 19 Mann, H. B. (1945). Non-parametric tests against trend. Econometrica, 13(3), 245-259. The Mann-Kendall test is a non-parametric rank-based procedure for identifying monotonic trends in time-series data. 20 Sen, P. K. (1968). Estimates of the regression coefficient based on Kendall's tau. Journal of the American Statistical Association, 63(324), 1379-1389. 21 McKee, T. B., Doesken, N. J., & Kleist, J. (1993). The relationship of drought frequency and duration to time scales. 8th Conference on Applied Climatology, American Meteorological Society, Boston, 179-183.
autocorrelation was assessed using Moran's I statistic to examine the degree of spatial clustering in food security outcomes [22] .
Spatial Distribution of Rainfall Across Districts
Figure 2 reveals the pronounced north-to-south rainfall gradient across Haryana's 22 districts. Ambala district records the highest mean annual rainfall (~820 mm), attributable to its proximity to the Shivalik Hills and the orographic enhancement of monsoon precipitation. Kurukshetra (750 mm) and Karnal (700 mm) also exhibit relatively high rainfall in the north-eastern belt. In stark contrast, Sirsa district in the south-west receives only ~310 mm annually a 2.65-fold spatial difference across the state [26] . This spatial disparity has profound implications for rainfed agriculture, groundwater recharge rates, and food security stability. Districts in the low-rainfall zone (Hisar, Fatehabad, Sirsa, Mahendragarh, Rewari) collectively account for over 40% of the state's geographic area but are characterised by high agricultural risk, low groundwater replenishment, and above-average poverty rates. Targeted irrigation infrastructure and drought-resistant variety deployment are critically needed in these zones.
Temperature Variability Trends
Both mean maximum and mean minimum temperatures exhibit statistically significant positive trends over the study period (Figure 3). Mean maximum temperature has increased at +0.45 °C/decade (MK: Z = +3.12, p < 0.01), while mean minimum temperature shows an increase of +0.38 °C/decade (MK: Z = +2.87, p < 0.01). The faster rate of increase in minimum temperatures compared to maximum temperatures is resulting in a narrowing of the diurnal temperature range (DTR), a pattern documented across the Indo-Gangetic Plains [27,28] . The agronomic implications of these warming trends are significant. Wheat, which requires cool night temperatures (below 15 °C) during the grain-filling stage (March-April), is particularly sensitive to minimum temperature anomalies.
Studies estimate a 3-5% yield penalty per 1 °C increase in mean temperature during the reproductive phase. The documented +0.38 °C/decade warming in minimum temperatures thus represents a compounding yield risk factor for Haryana's wheat crop. period is evident, consistent with declining monsoon precipitation trends and is corroborated by the SPI trend analysis (MK: Z = -1.95, p < 0.1) [29] . At the district level (not shown here due to space), SPI analyses reveal that south-western districts experience both higher drought frequency and greater severity than northeastern districts. Sirsa, Fatehabad, and Hisar districts recorded moderate-to-severe drought conditions in over 30% of years in the study period, compared to only 12-15% in Ambala and Kurukshetra.
Food Grain Production Trends
Figure 4 presents the compositional trends in food grain production. Total production has grown from 12.5 million tonnes (MT) in 1990 to 25.9 MT in 2022, representing a 107% increase driven by expansion of irrigated area, adoption of HYVs, and increased fertiliser use. Wheat consistently accounts for ~55% of output and rice for ~30%. However, this aggregate growth trajectory obscures important annual fluctuations [30] .
Production dips of 5-12% relative to trend were recorded in drought years (2002-03, 2009-10, 2018-19), confirming the direct transmission of rainfall deficits to crop output. Notably, the production shortfall in drought years has diminished over time from -12% in 2002 to -6% in 2018 reflecting improved irrigation buffering capacity, though at the cost of accelerated groundwater extraction. The statistical correlation between the annual SPI-12 and total production (r = 0.61, p < 0.01) is stronger for kharif crops (r = 0.74) than rabi crops (r = 0.32), reflecting differential dependence on monsoon rainfall. Source: Directorate of Agriculture, Haryana; author's analysis
Climate-Food Production Correlation
Figure 5 presents the bivariate correlation analysis between annual rainfall and food grain production, alongside the seasonal coupling of precipitation with crop growth patterns. The Pearson correlation coefficient (r = 0.52, p < 0.05) between annual rainfall and total production confirms a statistically significant positive relationship, though the moderate coefficient reflects the partial decoupling achieved through irrigation. The seasonal analysis (right panel, Figure 5) illustrates the critical alignment between peak monsoon rainfall (July-August) and the vegetative growth phase of kharif crops (primarily paddy), and between post-monsoon soil moisture conditions (October) and rabi sowing decisions. Any deviation in the timing or intensity of monsoon onset can cascade through the crop calendar with measurable yield consequences.
Groundwater Depletion and Food Security Stability
Figure 8 reveals the alarming co-evolution of groundwater table depletion and irrigated area expansion in Haryana over the study period. The depth to the water table has increased from approximately 8.2 metres below ground level (mbgl) in 1990 to 43.8 mbgl in 2022 a deepening of 35.6 metres in 33 years, equivalent to an average annual decline of 1.08 metres. This rate of depletion is substantially higher than the CGWB-assessed sustainable extraction threshold [31 , 32] . Simultaneously, net irrigated area as a percentage of net sown area has risen from 55% to 90%, reflecting the relentless substitution of rainfall with groundwater-fed irrigation to maintain and expand production. This irrigation-production-depletion cycle represents a classic 'Faustian bargain' in which short-term food security gains are achieved at the cost of long-term resource sustainability.
With the water table declining below the economically viable extraction depth in several blocks of Kaithal, Kurukshetra, and Hisar, the productivity of the irrigation system is being progressively compromised. The accelerating depletion of groundwater reserves alongside expanding irrigation underscores the unsustainable hydraulic trajectory of Haryana's agriculture. Source: CGWB; Directorate of Agriculture, Haryana; author's analysis.
Agro-Climatic Vulnerability Zones
Figure 9 presents the vulnerability profile of Haryana's five agro-climatic zones across three dimensions: sensitivity (inherent biological and economic susceptibility to climate stress), exposure (intensity and frequency of climate hazards), and adaptive capacity (resources and capabilities to cope and recover). This tri-component framework follows the IPCC AR5 risk assessment methodology [33] . Zone V (Semi-Arid South-West) exhibits the highest vulnerability profile across all three dimensions highest sensitivity (0.82) and exposure (0.88) combined with the lowest adaptive capacity (0.31). This zone encompasses districts including Sirsa, Fatehabad, Hisar, and Bhiwani, where low rainfall, sandy soils, high poverty rates, and limited irrigation alternatives converge to create a 'perfect storm' of climate-food insecurity risk. Conversely, Zone I (Shivalik Hills) exhibits the most favourable vulnerability profile, with strong adaptive capacity driven by ecological diversity and lower groundwater dependence. 5.9 Food Security Index: Dimensional Analysis Figure 6 presents the composite Food Security Index (FSI) across four dimensions for Haryana compared to the India average and the SDG 2 (Zero Hunger) 2030 target. Haryana scores highest on Food Availability (0.72), reflecting its status as a food surplus state with per capita cereal production significantly above the national average. However, the Access dimension score (0.58) reveals persistent economic barriers to food, particularly for the rural poor, seasonal agricultural labourers, and migrant workers [34,35] The Utilization dimension score (0.54) is particularly concerning. NFHS-5 data indicates that 27.1% of children under 5 are stunted, 21.0% are wasted, and 62.7% of women of reproductive age are anaemic in Haryana nutritional deficits that persist despite food grain abundance. This phenomenon confirms the 'production-nutrition disconnect' identified in Green Revolution states, where dietary monotony arising from wheat-rice monoculture has undermined micronutrient intake [36,37] . The Stability dimension yields the lowest score (0.49), reflecting the cumulative effect of increasing drought frequency, accelerating groundwater depletion, and rising temperature anomalies. This is the dimension most directly and adversely affected by climate variability, and it is the primary transmission channel through which climate change converts into food insecurity in Haryana.
Climate Variability and Agricultural Risk
The integrated findings of this study reinforce the view that climate variability in Haryana is intensifying along multiple dimensions simultaneously declining annual rainfall, rising temperatures, increasing drought frequency, and groundwater depletion creating a compound risk environment for the agricultural sector. The combination of statistically significant declining rainfall (Sen's Q = -1.8 mm/yr) with significant warming (+0.04 °C/yr) is particularly ominous, as it simultaneously reduces both precipitation input and increases evapotranspiration demand, amplifying effective water stress beyond what either trend alone would suggest [39,40] . The spatial heterogeneity of these trends warrants emphasis. The south-western agro-climatic zones are not only exposed to greater absolute rainfall deficits but also exhibit lower buffering capacity through irrigation and higher povertydriven vulnerability. The result is a spatially polarised food security landscape in which aggregate state-level indicators mask severe sub-regional disparities.
The Production-Nutrition Paradox
One of the most striking findings of this study is the coexistence of food grain abundance and nutritional deficiency in Haryana a paradox that the food security literature terms the 'production-nutrition disconnect'. This disconnect arises from the mono-cropping legacy of the Green Revolution, which displaced nutritionally diverse coarse cereals (bajra, jowar, ragi), pulses, and oilseeds in favour of wheat and rice. The dietary consequence is a carbohydrate-heavy food basket deficient in iron, zinc, Vitamin A, and protein the deficiencies reflected in the high anaemia and stunting rates documented in NFHS-5 [41,42,43] . Climate variability exacerbates this paradox through two pathways: first, by reducing the profitability of crop diversification (since drought-sensitive high-value crops carry greater risk than subsidised wheat-rice); and second, by reducing the income stability of small and marginal farmers, who substitute cheap calories (wheat flour) for nutritionally diverse but more expensive foods during income shocks.
Conclusions and
Conclusions and
Figures and tables from the paper
References
21 in the original paper- Central Ground Water Board (CGWB). Ground Water Year Book -Haryana. Faridabad: Ministry of Jal Shakti, Government of India; 2022.
- Commission for Agricultural Costs and Prices (CACP). Price Policy for Kharif Crops: The Marketing Season 2022-23. New Delhi: Ministry of Agriculture and Farmers Welfare, Government of India; 2022.
- Directorate of Agriculture, Haryana. Statistical Abstract of Haryana Agriculture 2021-22. Chandigarh: Government of Haryana; 2022.
- Food and Agriculture Organization of the United Nations (FAO). Rome Declaration on World Food Security and World Food Summit Plan of Action. Rome: FAO; 1996.
- Food and Agriculture Organization of the United Nations (FAO). The State of Food Insecurity in the World 2012: Economic Growth Is Necessary but Not Sufficient to Accelerate Reduction of Hunger and Malnutrition. Rome: FAO; 2012.
- Haryana Space Applications Centre (HARSAC). Land Use and Land Cover Atlas of Haryana 2019-20. Hisar: Government of Haryana; 2021.
- International Food Policy Research Institute (IFPRI). Global Food Policy Report 2021: Transforming Food Systems After COVID-19. Washington (DC): IFPRI; 2021.
- Intergovernmental Panel on Climate Change (IPCC). Climate Change 2022: Impacts, Adaptation and Vulnerability. Contribution of Working Group II to the Sixth Assessment Report. Cambridge: Cambridge University Press; 2022.
- Kothawale DR, Munot AA, Kumar KK. Surface air temperature variability over India during 1901-2007, and its association with ENSO. Climate Research. 2010;42:89-104.
- Kumar V, Jain SK, Singh Y. Analysis of long-term rainfall trends in India. Hydrological Sciences Journal. 2010;55(4):484-496.
- Mann HB. Nonparametric tests against trend. Econometrica. 1945;13(3):245-259.
- McKee TB, Doesken NJ, Kleist J. The relationship of drought frequency and duration to time scales. In: Proceedings of the 8th Conference on Applied Climatology. Boston: American Meteorological Society; 1993. p. 179-183.
- International Institute for Population Sciences (IIPS), National Family Health Survey (NFHS-5). National Family Health Survey -Haryana State Fact Sheet 201921. Mumbai: IIPS; 2021.
- National Sample Survey Office (NSSO). Household Consumer Expenditure Survey 2017-18 (75th Round). New Delhi: National Statistical Office, Ministry of Statistics and Programme Implementation, Government of India; 2019.
- Pingali PL. Green Revolution: Impacts, limits, and the path ahead. Proceedings of the National Academy of Sciences. 2012;109(31):12302-12308.
- Rajeevan M, Bhate J, Jaswal AK. Analysis of variability and trends of extreme rainfall events over India using 104 years of gridded daily rainfall data. Geophysical Research Letters. 2008;35:L18707.
- Rodell M, Velicogna I, Famiglietti JS. Satellite-based estimates of groundwater depletion in India. Nature. 2009;460:999-1002.
- Sen PK. Estimates of the regression coefficient based on Kendall's tau. Journal of the American Statistical Association. 1968;63(324):1379-1389.
- Singh N, Sontakke NA. On climatic fluctuations and environmental changes of the Indo-Gangetic Plains. Climatic Change. 2002;52(3):287-313.
- Swaminathan MS. From Green Revolution to Evergreen Revolution. MSSRF Research Highlights. Chennai: M. S. Swaminathan Research Foundation; 2010.
- World Bank. Groundwater Governance in India: An Assessment of Regulatory Frameworks and Institutional Capacities. Washington (DC): World Bank South Asia Water Initiative; 2021.