
Research article · 2026 · Full text
International Journal of Geography Geology and EnvironmentSpatial patterns and regional disparities in food and nutrition security across Rajasthan: A GIS-based district-level analysis
Volume 8(7) · Pages 263–272 · DOI: 10.22271/27067483.2026.v8.i7c.841 ↗
Research areasFood Security and Socioeconomic DynamicsSocial and Economic Development in IndiaAgricultural Economics and Practices
Abstract
Author-writtenFood and nutrition security is a multidimensional concept that encompasses the availability, accessibility, utilization, and stability of food required for a healthy and active life. Despite significant improvements in agricultural production and welfare programmes, considerable regional disparities in food and nutrition security persist across Rajasthan. This study assesses the district-level spatial variation in the Food and Nutrition Security Index (FNSI) for the 33 districts of Rajasthan by integrating the four pillars of food security into a composite index. Secondary data were compiled from the National Family Health Survey-5 (2019-21), the Census of India (2011), and the Directorate of Economics and Statistics, Rajasthan. After normalizing the selected indicators, pillar-wise indices and the composite FNSI were computed using a min-max normalization approach. Spatial distribution patterns were visualized using Geographic Information System (QGIS 3.24), while Local Moran's I (LISA), and Getis-Ord Gi* statistics were employed to examine spatial autocorrelation, identify local clusters, and detect statistically significant hotspots and coldspots. The results reveal pronounced regional disparities in food and nutrition security across Rajasthan. Hanumangarh, Jhunjhunu, Jaipur, Sikar, and Ganganagar emerge as the highest-ranking districts, whereas Dungarpur, Pratapgarh, Banswara, and Jaisalmer record the lowest FNSI values. The thematic maps indicate that higher food and nutrition security is concentrated mainly in the north-eastern districts, while lower levels are predominantly observed in the southern tribal belt and parts of western Rajasthan. Spatial statistical analyses further confirm significant geographic clustering, with Local Moran's I identifying High-High clusters in the north-eastern region and a Low-Low cluster in the southern tribal region. The Getis-Ord Gi* analysis similarly highlights statistically significant hotspots of high food and nutrition security and a persistent coldspot in Banswara. The study demonstrates that food and nutrition security in Rajasthan is shaped by strong spatial inequalities arising from differences in agricultural resources, infrastructure, socio-economic development, and access to public services. The findings underscore the need for geographically targeted policies, particularly in the tribal and economically disadvantaged districts, to reduce regional disparities and promote equitable food and nutrition security across the state.
Summary
Source-checkedPlain-language reading of the full paper, prepared with AI and checked against the text. Each point links to the authors' own words.
Why it matters
- Food and nutrition security is a complex, multidimensional concept based on four pillars: availability, accessibility, utilization, and stability. View evidence ↗
- Even with improvements in welfare programs and agricultural production, Rajasthan continues to face significant regional disparities in food and nutrition security. View evidence ↗
- Rajasthan's diverse geography, including the Thar Desert and southern tribal belts, creates varying conditions for agricultural productivity and food security. View evidence ↗
The question
- The study aims to assess spatial variations in the Food and Nutrition Security Index (FNSI) across 33 districts of Rajasthan using a composite index of the four food security pillars. View evidence ↗
What they did
- The research utilized secondary data from the 2011 Census of India, the National Family Health Survey-5 (2019-21), and the Rajasthan Directorate of Economics and Statistics. View evidence ↗
- The primary dataset for the 33 districts was the 2023 Rajasthan Food and Nutrition Security Analysis, developed by the Government of Rajasthan and the World Food Programme. View evidence ↗
- The study used QGIS 3.24 for visualization and applied Local Moran's I (LISA) and Getis-Ord Gi* statistics to identify spatial clusters, hotspots, and coldspots. View evidence ↗
What they found
- The highest food and nutrition security was found in Hanumangarh, Jhunjhunu, Jaipur, Sikar, and Ganganagar, while the lowest values were in Dungarpur, Pratapgarh, Banswara, and Jaisalmer. View evidence ↗
- Food availability showed substantial differences across districts, with a mean score of 36.49 and a range from 5.77 to 65.33. View evidence ↗
- Food utilization was the most consistent dimension across the state, recording the highest average score of 69.73. View evidence ↗
- A statistically significant High-High cluster of food and nutrition security was identified in the north-eastern districts of Jaipur, Alwar, and Sikar. View evidence ↗
- A significant Low-Low cluster was identified in Banswara, reflecting consistently low food and nutrition security in the southern tribal region. View evidence ↗
- Hotspot analysis revealed a 99% confidence hotspot in Churu, with Jaipur and Alwar at 95% and Sikar at 90% confidence. View evidence ↗
- Banswara was identified as a statistically significant 95% confidence coldspot, indicating a persistent concentration of low food and nutrition security. View evidence ↗
What it means
- The authors conclude that improving food security in Rajasthan requires region-specific interventions, prioritizing tribal and economically disadvantaged districts. View evidence ↗
Visual summary
3 visualsIllustrations explain the paper; charts are replotted from the paper's own table values.
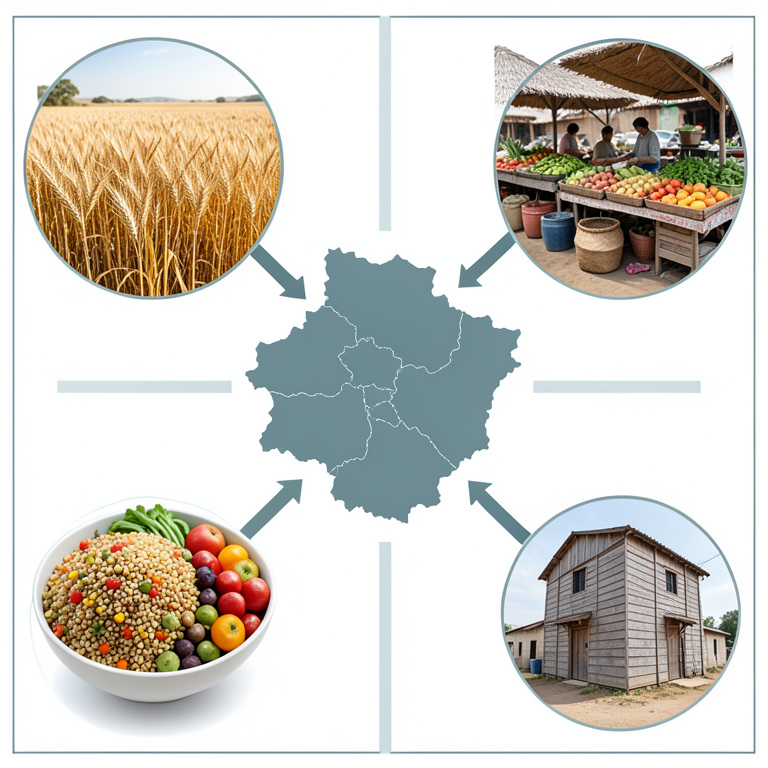
The Four Pillars of Food Security
AI-generated conceptual illustration (A map of Rajasthan state, India, and diverse food sources). It explains the idea and does not show study data.
View source evidence ↗
Spatial Clustering Concept
AI-generated conceptual illustration (A map of Rajasthan state, India). It explains the idea and does not show study data.
View source evidence ↗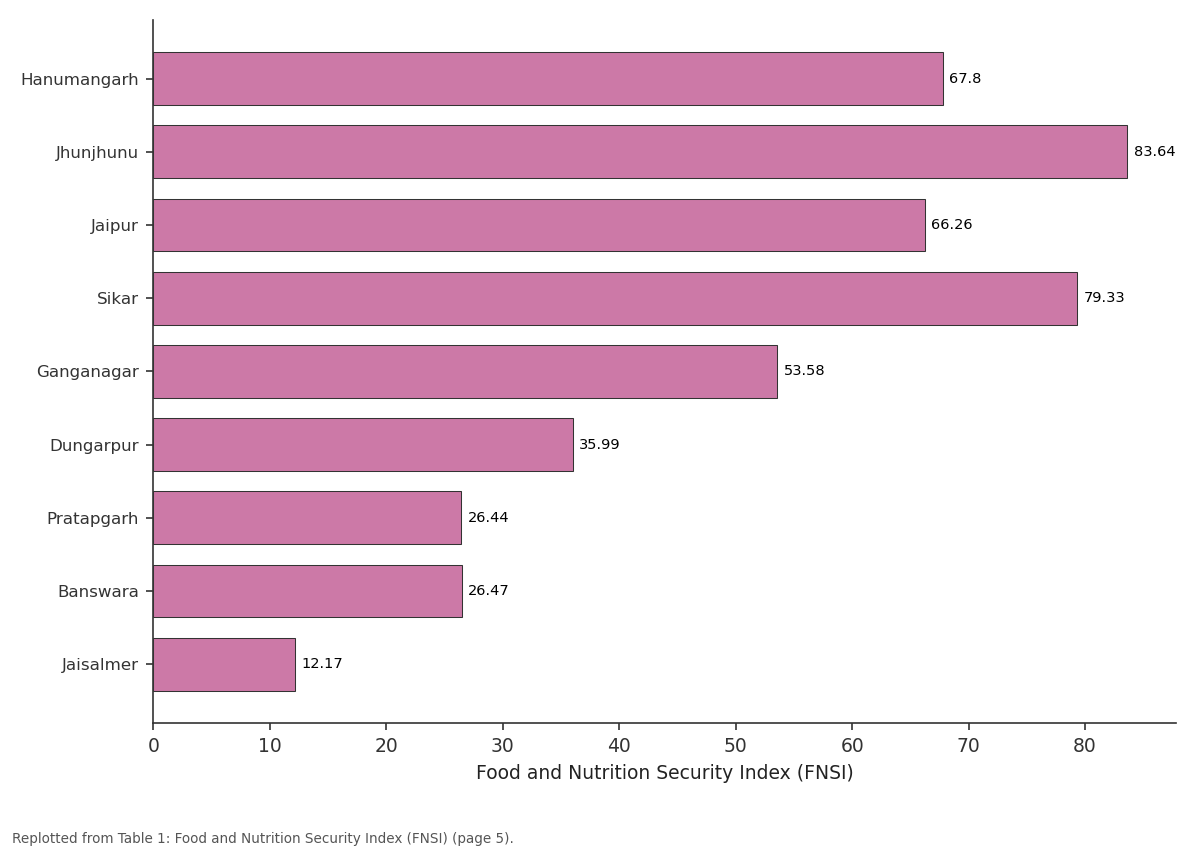
Food stability: Hanumangarh vs Jhunjhunu vs Jaipur vs Sikar vs Ganganagar
Replotted from Table 1 (page 5) of the original paper. Every bar is the paper's own table value.
View source evidence ↗Figures & tables
From the original paper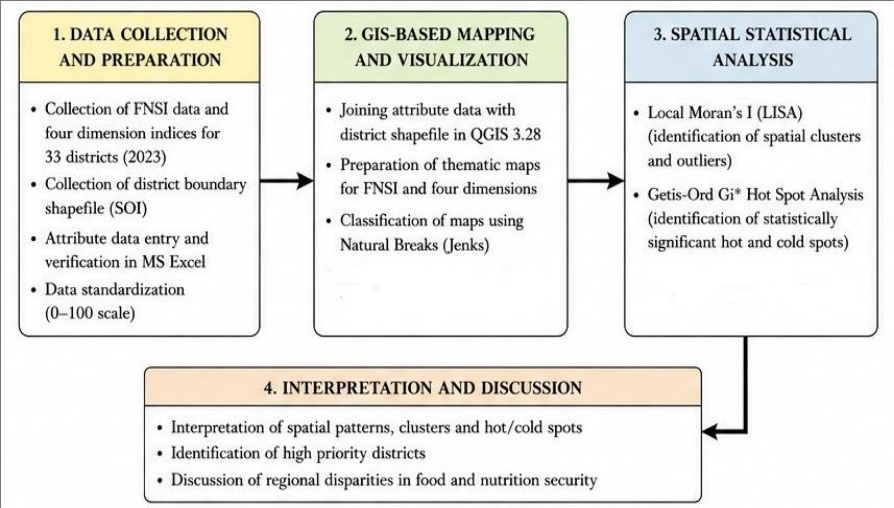 Figure 1
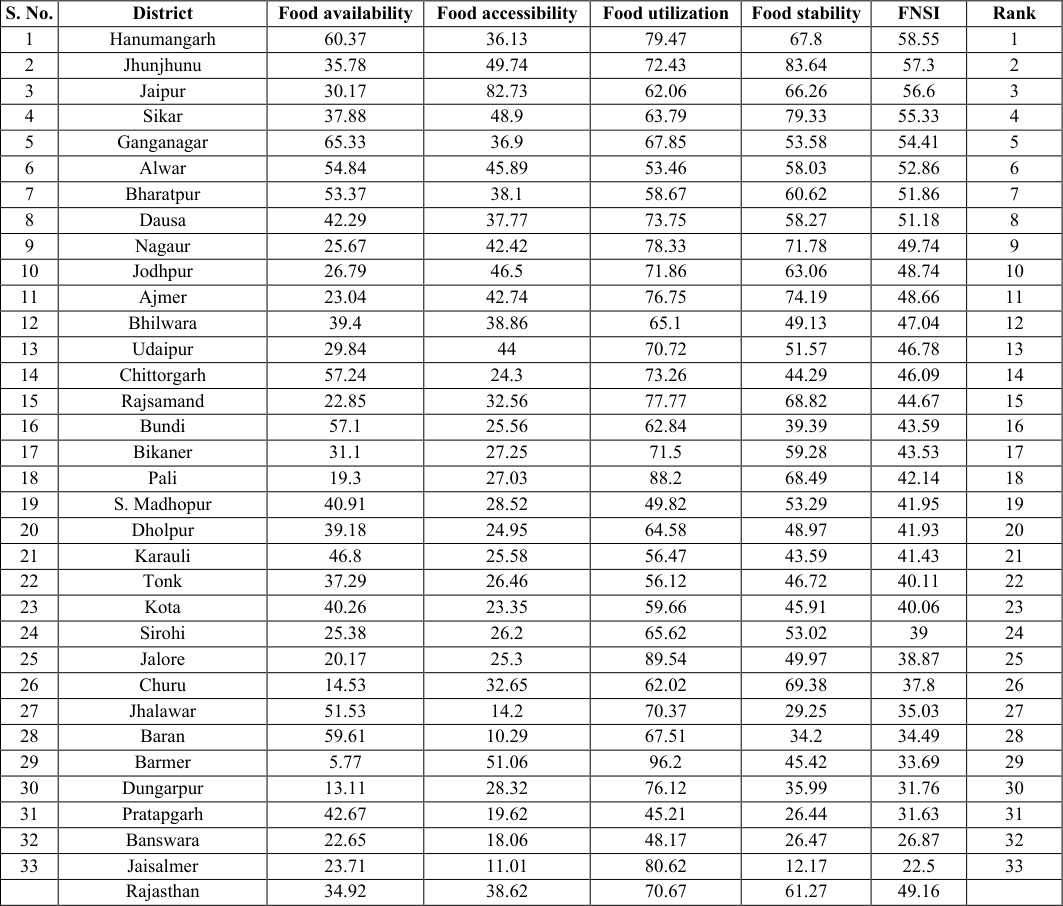 Table 1
 Table 2
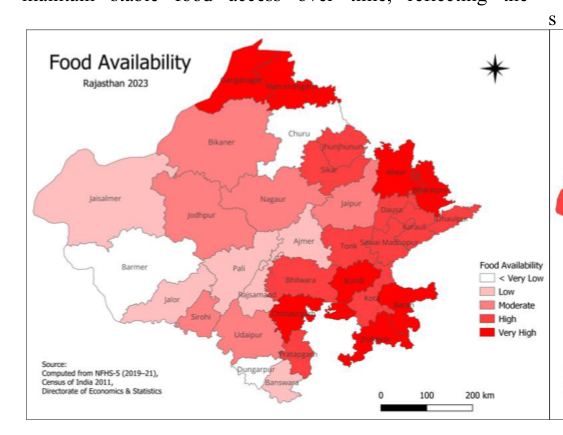 Figure 2
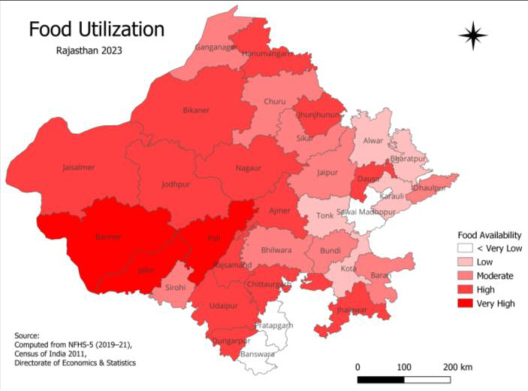 Figure 3
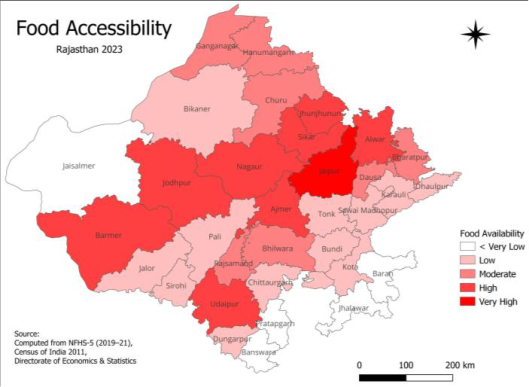 Figure 4
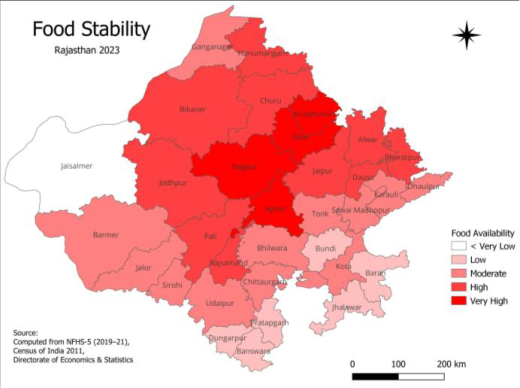 Figure 5
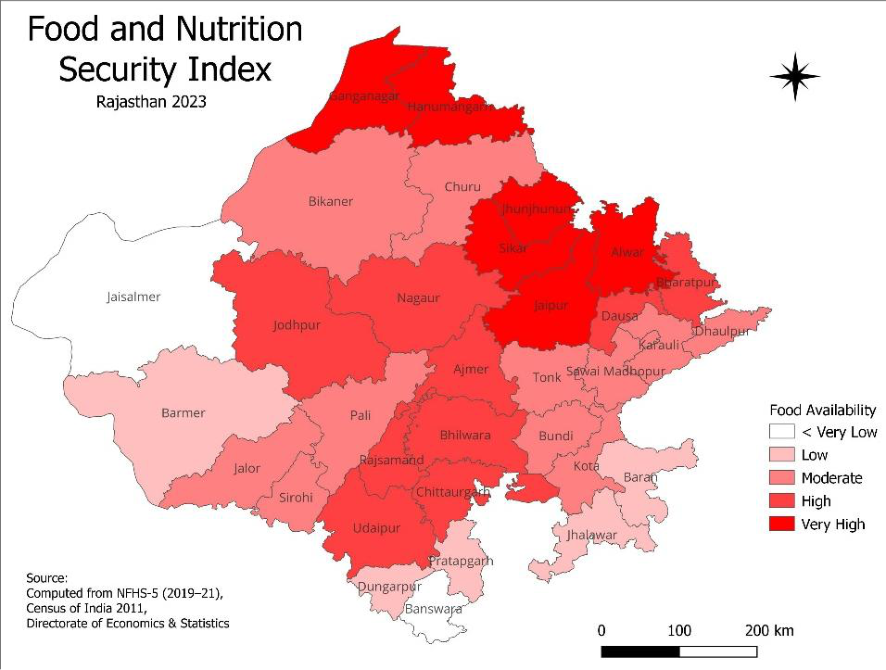 Figure 6
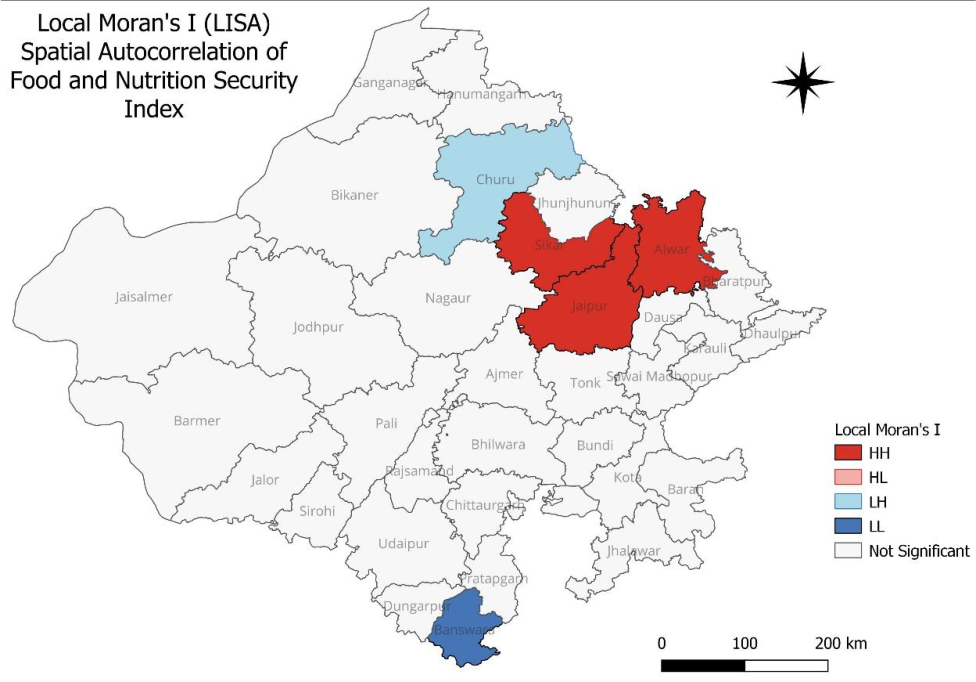 Figure 7
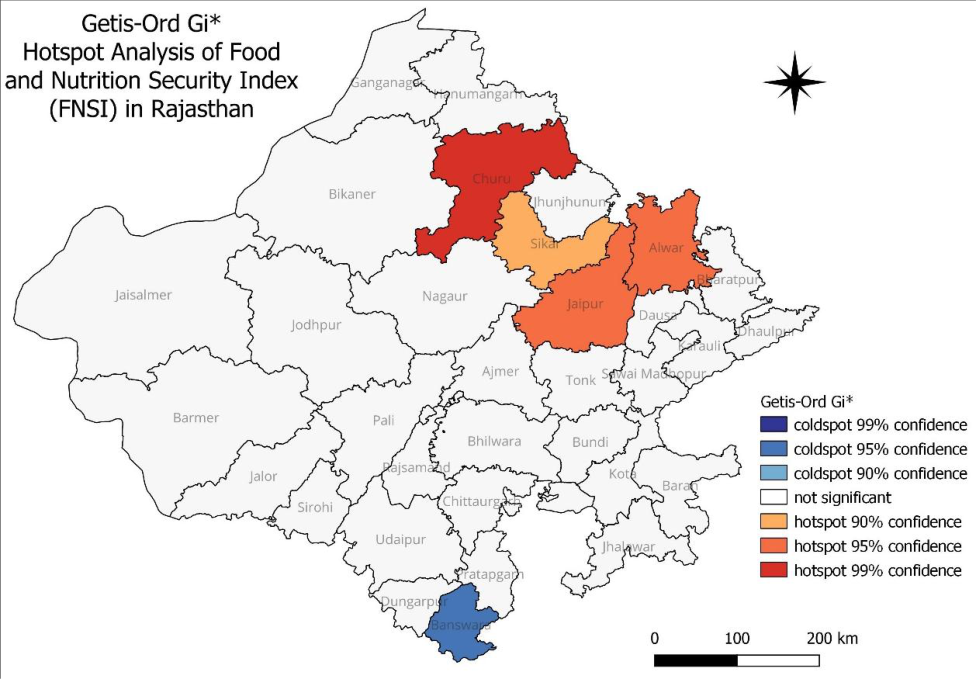 Figure 8
Introduction
Food and nutrition security remains one of the most significant development challenges of the twenty-first century. Despite remarkable advances in agricultural production, food distribution systems, and economic growth, ensuring that all people have continuous access to sufficient, safe, and nutritious food continues to be a global concern. The concept of food security has evolved considerably over the past few decades. It is no longer viewed solely in terms of food production or availability; rather, it encompasses four interconnected dimensions food availability, food accessibility, food utilization, and food stability. Together, these dimensions determine whether individuals and households can maintain healthy and productive lives. This broader understanding has become central to international development agendas, particularly Sustainable Development Goal 2 (SDG 2), which aims to end hunger, achieve food security, improve nutrition, and promote sustainable agriculture. Although India has made substantial progress in increasing food grain production and strengthening public food distribution systems, improvements in national food availability have not translated uniformly into nutritional well-being across regions. Considerable disparities persist because food security is shaped not only by agricultural output but also by income, infrastructure, education, healthcare, social protection, environmental conditions, and access to public services. Consequently, neighboring districts within the same state may experience markedly different levels of food and nutrition security depending on their socio-economic and geographical characteristics. Understanding these spatial differences is therefore essential for designing interventions that respond to local needs rather than relying on uniform state-level policies. Rajasthan presents a particularly relevant setting for examining regional variations in food and nutrition security. As India's largest state by area, Rajasthan encompasses diverse physiographic regions ranging from the arid Thar Desert in the west to the semi-arid plains and the hilly tribal belt of southern Rajasthan. These contrasting physical environments influence agricultural productivity, water availability, livelihood opportunities, and access to essential services. In addition, differences in rainfall, irrigation, market connectivity, infrastructure, and socio-economic development contribute to substantial inequalities among districts. Such diversity makes Rajasthan an appropriate case for investigating how geographical and regional factors shape food and nutrition security. The southern districts of Rajasthan, particularly those designated under the Tribal Sub-Plan (TSP), have historically experienced multiple developmental disadvantages. Districts such as Dungarpur, Banswara, and Pratapgarh are characterized by a high proportion of Scheduled Tribe population, dependence on rain-fed agriculture, fragmented landholdings, seasonal migration, and relatively limited infrastructure. Although these districts possess rich ecological and cultural resources, households often face recurrent challenges related to livelihood security, climate variability, access to markets, and nutritional outcomes. These structural conditions may influence different dimensions of food security in distinct ways. For example, households may maintain acceptable dietary utilization through traditional food practices while simultaneously experiencing constraints in food availability or long-term stability. Such variations highlight the importance of analyzing food security as a multidimensional phenomenon rather than relying on a single indicator. Recent efforts by the Government of Rajasthan, in collaboration with development partners, have resulted in the development of the Food and Nutrition Security Index (FNSI) 2023, which provides a comprehensive district-level assessment based on the four fundamental pillars of food and nutrition security. Unlike conventional measures that focus on individual indicators, the FNSI integrates multiple dimensions into a composite index, allowing systematic comparison across districts. This framework offers an opportunity to examine regional inequalities and identify districts that require greater policy attention. However, the analytical potential of these data has not yet been fully explored from a geographical perspective. Geographical Information Systems (GIS) have emerged as powerful tools for analysing spatial inequalities in development indicators. Beyond producing thematic maps, GIS enables researchers to examine the spatial organization of socio-economic phenomena, identify clusters of high and low values, and reveal regional patterns that may not be apparent through conventional statistical analysis. Spatial analytical techniques such as Local Indicators of Spatial Association (LISA), and Getis-Ord Gi* statistics have become widely used for investigating geographical clustering and regional disparities in health, poverty, environmental quality, and agricultural development. Applying these techniques to food and nutrition security can provide valuable insights into whether neighboring districts exhibit similar levels of food insecurity and whether vulnerable regions are geographically concentrated. Such evidence is particularly useful for planning targeted interventions and improving the efficiency of public investment. Previous studies on food security in India have primarily focused on household surveys, nutritional outcomes, poverty, or agricultural production. While these studies have significantly advanced understanding of food insecurity, comparatively fewer investigations have examined districtlevel spatial disparities using composite food security indices. Existing research on Rajasthan has also tended to emphasise individual aspects such as malnutrition, agricultural vulnerability, or socio-economic deprivation, often without integrating the multiple dimensions of food and nutrition security within a comprehensive spatial framework. As a result, limited evidence is available regarding the geographical distribution of food and nutrition security across the state's districts and the extent to which regional inequalities are spatially clustered. The present study seeks to address this gap by undertaking a GIS-based district-level analysis of the Food and Nutrition Security Index across Rajasthan. Using the Food and Nutrition Security Index and its four constituent dimensions food availability, food accessibility, food utilization, and food stability the study examines regional patterns and spatial disparities among districts. It further employs spatial analytical techniques to identify clusters of relatively high and low food security and pays particular attention to the position of the tribal districts within the broader regional context. By integrating spatial analysis with district-level food security indicators, the study provides a clearer understanding of geographical inequalities that can support evidence-based planning and more effective targeting of food and nutrition policies. The findings are expected to contribute to the growing body of literature on food security geography in India while offering practical insights for policymakers, planners, and development agencies working toward the achievement of Sustainable Development Goal 2. More importantly, the study demonstrates how spatial analysis can complement conventional food security assessments by revealing regional patterns that are critical for designing equitable and place-specific development strategies.
Objectives 1) To assess the district-level distribution of the Food and
Nutrition Security Index (FNSI) and its four dimensions food availability, food accessibility, food utilization, and food stability across Rajasthan. 2) To map and visualize the spatial patterns of Food and Nutrition Security across Rajasthan using Geographic Information System (GIS)-based thematic mapping techniques.
3) To identify spatial clusters and regional disparities in Food and Nutrition Security using Local Moran's I (LISA), and Getis-Ord Gi hotspot analysis.
Study area
Rajasthan, located in the northwestern part of India, is the country's largest state, covering an area of approximately 342,239 km², which accounts for about 10.4% of India's total geographical area. Geographically, the state extends between 23°03′ and 30°12′ North latitude and 69°30′ and 78°17′ East longitude. It shares international boundaries with Pakistan to the west and is bordered by the Indian states of Punjab, Haryana, Uttar Pradesh, Madhya Pradesh, and Gujarat. According to the 2011 Census of India, Rajasthan had a population of 68.55 million, making it one of the most populous states in the country.
The physical landscape of Rajasthan is highly diverse and is broadly divided by the Aravalli Range, one of the oldest fold mountain systems in the world. The western part of the state is dominated by the arid and semi-arid expanse of the Thar Desert, characterized by sparse vegetation, low and erratic rainfall, and frequent droughts. In contrast, the eastern, southeastern, and southern regions receive comparatively higher rainfall and support more intensive agricultural activities. Agriculture remains the principal livelihood for a large proportion of Rajasthan's population, although its nature varies considerably across regions. The state cultivates crops such as wheat, mustard, gram, pearl millet (bajra), maize, barley, soybean, and pulses, depending on agro-climatic conditions. Agricultural production is strongly influenced by the southwest monsoon, and recurrent rainfall variability poses persistent challenges to food production and rural livelihoods. While irrigation infrastructure has expanded in parts of northern and eastern Rajasthan through canal systems, reservoirs, and groundwater development, large areas particularly in the western desert and southern tribal regions continue to depend primarily on rainfall. This uneven distribution of natural resources and irrigation facilities contributes to regional differences in food availability and livelihood security. Rajasthan also exhibits considerable socioeconomic diversity. Rapid urbanization, industrial development, and improved infrastructure have accelerated economic growth in districts such as Jaipur, Alwar, and Jodhpur, whereas several southern and southeastern districts continue to face developmental constraints associated with limited infrastructure, lower educational attainment, dispersed rural settlements, and a high concentration of Scheduled Tribe populations. The combination of diverse physiographic conditions, climatic variability, agricultural dependence, and socio-economic inequalities makes Rajasthan an important region for examining food and nutrition security from a spatial perspective. The marked differences observed between the agriculturally advanced northern districts, the urbanizing central districts, the arid western desert, and the predominantly tribal southern region provide an appropriate setting for investigating regional disparities in food and nutrition security. Understanding these geographical variations is essential for identifying vulnerable regions and supporting evidence-based, locationspecific policy interventions aimed at achieving equitable food and nutrition outcomes across the state.
GIS database preparation
A district-level geospatial database was developed by integrating the Food and Nutrition Security Index dataset with the Rajasthan district boundary shapefile using district names as the common attribute. The spatial database was checked for attribute consistency, missing values, and duplicate records before analysis. After successful integration, a comprehensive geodatabase containing the composite Food and Nutrition Security Index and its four dimensions was created for all 33 districts. To facilitate spatial interpretation, each indicator was classified into five categories using the Natural Breaks (Jenks) classification method. This approach identifies inherent groupings within the data and minimizes variation within classes while maximizing variation between classes, thereby providing a meaningful representation of regional differences.
GIS-based spatial mapping
Geographic Information System (GIS) techniques were employed to examine the spatial distribution of Food and Nutrition Security across Rajasthan. Separate choropleth maps were prepared for the Food Availability Index, Food Accessibility Index, Food Utilization Index, Food Stability Index, and the composite Food and Nutrition Security Index (FNSI). Standard cartographic principles were followed during map preparation, including the incorporation of district boundaries, legends, scale bars, north arrows, and appropriate map projections to ensure clarity and consistency. These thematic maps provided an initial understanding of the spatial variation and regional disparities in food and nutrition security across the state.
Spatial statistical analysis
Spatial statistical analysis
Software used
Data compilation and preliminary processing were carried out using Microsoft Excel 365. Spatial database preparation, thematic mapping, and geospatial analyses were performed using QGIS, while spatial statistical analyses, Local Moran's I (LISA), and Getis-Ord Gi* hotspot analysis, were conducted using GeoDa. The integration of these software platforms facilitated efficient spatial data management, visualization, and statistical analysis throughout the study. The composite Food and Nutrition Security Index (FNSI) has a mean value of 43.84, with district scores ranging from 22.50 to 58.55, producing a range of 36.05. The standard deviation of 9.15 and coefficient of variation of 20.88% indicate a moderate level of variation in overall food and nutrition security across Rajasthan. While some districts demonstrate comparatively stronger food and nutrition security outcomes, others continue to experience significant challenges. The observed differences highlight the importance of location-specific planning and targeted policy interventions to reduce regional disparities and improve food and nutrition security across the state.
Spatial distribution 5.2.1 Food availability
Figure 2 shows considerable spatial variation in food availability across Rajasthan. Districts in the northern and eastern regions, including Hanumangarh, Ganganagar, Alwar, Bharatpur, Bundi, Chittorgarh, Baran, and Jhalawar, exhibit high to very high food availability, reflecting better irrigation facilities, favourable agricultural conditions, and higher crop productivity. In contrast, districts such as Barmer, Churu, Dungarpur, and Sawai Madhopur fall under the very low category due to arid climatic conditions, limited irrigation, dependence on rain-fed agriculture, and relatively lower agricultural output. Overall, food availability is highest in irrigated and agriculturally productive regions and lowest in the western desert and parts of the southern tribal belt.
Food accessibility
Figure 3 illustrates the spatial distribution of food accessibility across Rajasthan. Jaipur emerges as the district with very high food accessibility, while several adjoining districts in the central and northern regions, including Alwar, Sikar, Jhunjhunu, Nagaur, Jodhpur, Barmer, and Udaipur, fall within the high category. Conversely, districts in the south-eastern and southern tribal regions, such as Kota, Baran, Jhalawar, Pratapgarh, and Banswara, exhibit very low accessibility, indicating constraints related to income, employment opportunities, market connectivity, and purchasing power. The pattern suggests that urbanization and economic development significantly enhance food accessibility across the state.
Food utilization
Figure 4 depicts the spatial distribution of food utilization in Rajasthan. The western districts, including Barmer, Jalore, Pali, and Jaisalmer, along with Chittorgarh and Jhalawar, demonstrate very high food utilization, indicating relatively better nutritional outcomes, sanitation, healthcare, and dietary practices. In contrast, Banswara, Pratapgarh, Sawai Madhopur, and Dungarpur fall into the very low category, reflecting challenges related to nutrition, health services, sanitation, and awareness. Overall, the map indicates noticeable regional differences in the effective utilization of food despite variations in food availability.
Food stability
Figure 5 presents the spatial distribution of food stability across Rajasthan. Nagaur, Sikar, Ajmer, and Jhunjhunu exhibit very high food stability, suggesting greater resilience in maintaining food availability and access throughout the year. Several neighbouring districts in the northern and central parts of the state also record high stability. In contrast, Jaisalmer, Jhalawar, Banswara, Dungarpur, Kota, and Baran fall within the very low to low categories, indicating greater vulnerability to climatic variability, drought, economic fluctuations, and seasonal food insecurity. The spatial pattern highlights that food stability remains uneven across Rajasthan and is strongly influenced by environmental and socio-economic conditions.
Food and Nutrition Security Index (FNSI)
Figure 6 presents the spatial distribution of the Food and Nutrition Security Index (FNSI) across the districts of Rajasthan, revealing significant regional disparities in overall food and nutrition security. Districts in the northern and north-eastern regions, including Hanumangarh, Ganganagar, Jaipur, Alwar, Sikar, and Jhunjhunu, exhibit very high to high FNSI values, reflecting better performance in food availability, accessibility, utilization, and stability. Districts such as Nagaur, Jodhpur, Bhilwara, Chittorgarh, and Udaipur fall within the moderate to high category, indicating relatively balanced food security conditions. In contrast, districts in the western desert and southern tribal regions, including Jaisalmer, Barmer, Banswara, Dungarpur, Pratapgarh, Jhalawar, Kota, and Baran, are classified under the low to very low categories, highlighting persistent challenges related to climatic constraints, limited irrigation, lower economic development, weaker market access, and socio-economic vulnerabilities. Overall, the map demonstrates a clear spatial gradient, with food and nutrition security generally improving from the south-western and western districts towards the northern and north-eastern districts of Rajasthan. These findings underscore the need for region-specific policies that strengthen agricultural resilience, improve livelihoods, expand social protection programmes, and enhance nutrition and health services, particularly in the tribal and drought-prone districts of the state.
Local Moran's I (LISA) analysis
The Local Moran's I (LISA) cluster map (Figure 7) reveals that the Food and Nutrition Security Index exhibits distinct local spatial patterns rather than a random distribution. A statistically significant High-High (HH) cluster is observed in Jaipur, Alwar, and Sikar, indicating that these districts possess high food and nutrition security and are surrounded by neighbouring districts with similarly high index values. The formation of this cluster reflects the advantages of better agricultural productivity, stronger economic conditions, improved infrastructure, and greater access to markets and public services in the north-eastern part of Rajasthan.
A significant Low-Low (LL) cluster is identified in Banswara, suggesting that this district, along with its neighbouring areas, experiences consistently low food and nutrition security. This cluster corresponds to the southern tribal region of the state, where geographical isolation, limited livelihood opportunities, dependence on rain-fed agriculture, and socio-economic deprivation continue to influence food security outcomes. Overall, the LISA analysis demonstrates that food and nutrition security in Rajasthan is spatially clustered, with high-performing districts concentrated in the north-eastern region and low-performing areas confined mainly to the southern tribal belt. The Getis-Ord Gi* hotspot analysis (Figure 8) further confirms the presence of statistically significant spatial concentrations of food and nutrition security across Rajasthan. A 99% confidence hotspot is observed in Churu, indicating a strong concentration of high FNSI values in this part of the state. Jaipur and Alwar emerge 95% confidence hotspots, while Sikar is identified as a 90% confidence hotspot, collectively forming a prominent hotspot region in the north-eastern districts. These hotspots represent areas where favourable agricultural conditions, diversified economic activities, better infrastructure, and improved access to food, health, and social welfare programmes contribute to relatively higher food and nutrition security. In contrast, Banswara forms a statistically significant 95% confidence coldspot, highlighting a persistent concentration of low food and nutrition security in the southern tribal region. The presence of this coldspot reflects long-standing developmental challenges, including limited irrigation facilities, lower agricultural productivity, widespread dependence on subsistence farming, lower household incomes, and restricted access to essential services. Such conditions reduce the resilience of households to food insecurity and nutritional deficiencies.
Getis-Ord Gi* hotspot analysis
The hotspot analysis reinforces the findings of the LISA cluster analysis by demonstrating that food and nutrition security is geographically concentrated rather than randomly distributed. The clear contrast between the hotspot districts in north-eastern Rajasthan and the coldspot in the southern tribal region underscores the existence of pronounced regional disparities. These findings emphasize the importance of adopting region-specific development strategies, with priority interventions directed towards the tribal and economically disadvantaged districts to reduce spatial inequalities in food and nutrition security.
Overall result
The combined results of the Local Moran's I and Getis-Ord Gi* analyses indicate that the spatial distribution of food and nutrition security in Rajasthan is characterized by significant regional clustering. High levels of food and nutrition security are concentrated in the north-eastern districts, whereas persistent pockets of low food security are evident in the southern tribal region. These spatial patterns suggest that geographical location, agricultural potential, infrastructure, economic development, and social conditions collectively shape food and nutrition security across the state. The identification of statistically significant clusters and hotspots provides valuable evidence for designing geographically targeted policies aimed at reducing regional disparities and promoting equitable food and nutrition security throughout Rajasthan.
Conclusion
The spatial analysis of the Food and Nutrition Security Index demonstrates that food and nutrition security in Rajasthan is not evenly distributed but exhibits clear regional differences. The results of the Local Moran's I and Getis-Ord Gi* analyses reveal that districts in the northeastern part of the state form significant clusters of higher food and nutrition security, whereas the southern tribal region, particularly Banswara, represents a persistent area of low food and nutrition security. These spatial patterns indicate that food security is influenced not only by food production but also by differences in economic development, infrastructure, accessibility, public services, and social conditions. The concentration of both highperforming and low-performing districts highlights the importance of considering geographical context while designing development policies. Therefore, improving food and nutrition security in Rajasthan requires region-specific interventions, with greater attention to the tribal and economically disadvantaged districts where multiple dimensions of food insecurity continue to coexist. The findings provide a useful spatial framework for planners and policymakers to prioritize resources and formulate targeted strategies that can reduce regional disparities and promote balanced and inclusive development across the state.
*Financial support for this research from the Indian Council of Social Science Research (ICSSR), New Delhi, through a Post-Doctoral Fellowship is gratefully acknowledged.
Figures and tables from the paper
| S. No. | District | Food availability | Food accessibility | Food utilization | Food stability | FNSI | Rank |
|---|---|---|---|---|---|---|---|
| 1 | Hanumangarh | 60.37 | 36.13 | 79.47 | 67.8 | 58.55 | 1 |
| 2 | Jhunjhunu | 35.78 | 49.74 | 72.43 | 83.64 | 57.3 | 2 |
| 3 | Jaipur | 30.17 | 82.73 | 62.06 | 66.26 | 56.6 | 3 |
| 4 | Sikar | 37.88 | 48.9 | 63.79 | 79.33 | 55.33 | 4 |
| 5 | Ganganagar | 65.33 | 36.9 | 67.85 | 53.58 | 54.41 | 5 |
| 6 | Alwar | 54.84 | 45.89 | 53.46 | 58.03 | 52.86 | 6 |
| 7 | Bharatpur | 53.37 | 38.1 | 58.67 | 60.62 | 51.86 | 7 |
| 8 | Dausa | 42.29 | 37.77 | 73.75 | 58.27 | 51.18 | 8 |
| 9 | Nagaur | 25.67 | 42.42 | 78.33 | 71.78 | 49.74 | 9 |
| 10 | Jodhpur | 26.79 | 46.5 | 71.86 | 63.06 | 48.74 | 10 |
| 11 | Ajmer | 23.04 | 42.74 | 76.75 | 74.19 | 48.66 | 11 |
| 12 | Bhilwara | 39.4 | 38.86 | 65.1 | 49.13 | 47.04 | 12 |
| 13 | Udaipur | 29.84 | 44 | 70.72 | 51.57 | 46.78 | 13 |
| 14 | Chittorgarh | 57.24 | 24.3 | 73.26 | 44.29 | 46.09 | 14 |
| 15 | Rajsamand | 22.85 | 32.56 | 77.77 | 68.82 | 44.67 | 15 |
| 16 | Bundi | 57.1 | 25.56 | 62.84 | 39.39 | 43.59 | 16 |
| 17 | Bikaner | 31.1 | 27.25 | 71.5 | 59.28 | 43.53 | 17 |
| 18 | Pali | 19.3 | 27.03 | 88.2 | 68.49 | 42.14 | 18 |
| 19 | S. Madhopur | 40.91 | 28.52 | 49.82 | 53.29 | 41.95 | 19 |
| 20 | Dholpur | 39.18 | 24.95 | 64.58 | 48.97 | 41.93 | 20 |
| 21 | Karauli | 46.8 | 25.58 | 56.47 | 43.59 | 41.43 | 21 |
| 22 | Tonk | 37.29 | 26.46 | 56.12 | 46.72 | 40.11 | 22 |
| 23 | Kota | 40.26 | 23.35 | 59.66 | 45.91 | 40.06 | 23 |
| 24 | Sirohi | 25.38 | 26.2 | 65.62 | 53.02 | 39 | 24 |
| 25 | Jalore | 20.17 | 25.3 | 89.54 | 49.97 | 38.87 | 25 |
| 26 | Churu | 14.53 | 32.65 | 62.02 | 69.38 | 37.8 | 26 |
| 27 | Jhalawar | 51.53 | 14.2 | 70.37 | 29.25 | 35.03 | 27 |
| 28 | Baran | 59.61 | 10.29 | 67.51 | 34.2 | 34.49 | 28 |
| 29 | Barmer | 5.77 | 51.06 | 96.2 | 45.42 | 33.69 | 29 |
| 30 | Dungarpur | 13.11 | 28.32 | 76.12 | 35.99 | 31.76 | 30 |
| 31 | Pratapgarh | 42.67 | 19.62 | 45.21 | 26.44 | 31.63 | 31 |
| 32 | Banswara | 22.65 | 18.06 | 48.17 | 26.47 | 26.87 | 32 |
| 33 | Jaisalmer | 23.71 | 11.01 | 80.62 | 12.17 | 22.5 | 33 |
| Rajasthan | 34.92 | 38.62 | 70.67 | 61.27 | 49.16 |
Table text extracted from the original PDF; superscript letters are shown inline. The original table image is below.
View original table image
| Statistics | Food availability | Food accessibility | Food utilization | Food stability | FNSI |
|---|---|---|---|---|---|
| Mean | 36.49 | 34.25 | 69.73 | 53.53 | 43.84 |
| Minimum | 5.77 | 10.29 | 45.21 | 12.17 | 22.50 |
| Maximum | 65.33 | 82.73 | 96.20 | 83.64 | 58.55 |
| Standard deviation | 16.24 | 13.95 | 12.11 | 17.07 | 9.15 |
| Coefficient of variation (CV %) | 44.50 | 40.72 | 17.37 | 31.89 | 20.88 |
| Range | 59.56 | 72.44 | 50.99 | 71.47 | 36.05 |
Table text extracted from the original PDF; superscript letters are shown inline. The original table image is below.
View original table image
References
14 in the original paper- Anselin L. Exploring spatial data with GeoDa: A workbook. Urbana (IL): Center for Spatially Integrated Social Science, University of Illinois; 2005.
- Census of India. Primary Census Abstract. New Delhi: Office of the Registrar General & Census Commissioner, Government of India; 2011. https://censusindia.gov.in
- Food and Agriculture Organization. An introduction to the basic concepts of food security. Rome: FAO; 2008. https://www.fao.org
- Food and Agriculture Organization, International Fund for Agricultural Development, United Nations Children's Fund, World Food Programme, World Health Organization. The state of food security and nutrition in the world 2023. Rome: FAO; 2023. https://www.fao.org/publications/sofi
- Getis A, Ord JK. The analysis of spatial association by use of distance statistics. Geogr Anal. 1992;24(3):189206. DOI:10.1111/j.1538-4632.1992.tb00261.x.
- Government of Rajasthan. Statistical Abstract Rajasthan 2023. Jaipur: Directorate of Economics and Statistics; 2023.
- International Institute for Population Sciences (IIPS), ICF. National Family Health Survey (NFHS-5), 201921: India report. Mumbai: IIPS; 2021. https://www.nfhs.in
- Ord JK, Getis A. Local spatial autocorrelation statistics: Distributional issues and an application. Geogr Anal. 1995;27(4):286-306. DOI:10.1111/j.15384632.1995.tb00912.x.
- QGIS Development Team. QGIS Geographic Information System. Beaverton (OR): Open-Source Geospatial Foundation; 2024. https://qgis.org
- Sen A. Poverty and famines: An essay on entitlement and deprivation. Oxford: Oxford University Press; 1981.
- United Nations. Transforming our world: The 2030 Agenda for Sustainable Development. New York: United Nations; 2015. https://sdgs.un.org/2030agenda
- United Nations Development Programme. Human development report 2021/2022: Uncertain times, unsettled lives. New York: UNDP; 2022. https://hdr.undp.org
- World Food Programme. Comprehensive food security and vulnerability analysis guidelines. Rome: World Food Programme; 2009.
- World Health Organization. WHO global nutrition targets 2025: Policy brief series. Geneva: World Health Organization; 2021. https://www.who.int