
Research article · 2026 · Full text
International Journal of Horticulture and Food ScienceQuantifying genetic parameters and mean performance for yield and quality traits in Okra [Abelmoschus esculentus (L.) Moench]
Volume 8(7) · Pages 191–197 · DOI: 10.33545/26631067.2026.v8.i7c.824 ↗
Research areasAgricultural Practices and Plant GeneticsGenetics and Plant BreedingAgricultural pest management studies
Abstract
Author-writtenThe present investigation was carried out to assess genetic variability, heritability, genetic advance and reaction against Yellow Vein Mosaic Virus (YVMV) and Enation Leaf Curl Virus (ELCV) in thirty-three okra genotypes under field conditions using a Completely Randomized Block Design with three replications. Considerable variability was observed among the genotypes for all the characters studied. Pod yield per plant ranged from 80.74 to 238.51 g, while total pod yield varied from 37.29 to 128.08 q/ha, indicating ample scope for selection and improvement. High genotypic and phenotypic coefficients of variation were recorded for total pod yield (25.45 and 26.18%), pod yield per plot (24.79 and 25.63%) and pod yield per plant (22.03 and 22.65%). High heritability coupled with high genetic advance as per cent of mean was observed for total pod yield (94.54%, 50.98%), pod yield per plot (93.55%, 49.39%) and pod yield per plant (94.65%, 44.16%) indicating the predominance of additive gene action and effectiveness of direct selection. Screening for YVMV and ELCV under natural epiphytotic conditions revealed substantial variation in disease reaction among genotypes. Twelve genotypes remained completely free from YVMV infection throughout the crop period, whereas the highest YVMV incidence was recorded in NDO-24-32 (53.23%) followed by NDO-24-49 (42.61%). For ELCV, genotypes NDO-24-42 and NDO-24-46 exhibited complete resistance, while maximum disease incidence was observed in NDO-24- 37 (96.85%) followed by NDO-24-30 (84.81%). The check variety ‘Arka Anamika’ recorded 10.72% YVMV and 17.85% ELCV incidence at 75 DAS. The identified resistant genotypes may serve as valuable donors for developing high-yielding and virus-resistant okra cultivars.
Summary
Source-checkedPlain-language reading of the full paper, prepared with AI and checked against the text. Each point links to the authors' own words.
Why it matters
- Okra is a significant vegetable crop grown in tropical and subtropical regions globally. View evidence ↗
- Yellow Vein Mosaic Virus (YVMV) is the most destructive biotic stress for okra, potentially causing yield losses of up to 94% if infection occurs early. View evidence ↗
- The emergence of new viral strains has led to the breakdown of resistance in previously resistant okra varieties, necessitating ongoing varietal improvement. View evidence ↗
What they did
- The research was conducted during the 2025 Kharif season at the Main Experimental Station of Acharya Narendra Deva University of Agriculture and Technology. View evidence ↗
- Data were collected from five randomly selected plants per genotype per replication, and mean values were used for analysis. View evidence ↗
What they found
- Significant variability was found in yield: pod yield per plant ranged from 80.74 to 238.51 g (mean 163.53 g), pod yield per plot from 3.36 to 10.75 kg, and total pod yield from 37.29 to 128.08 q/ha. View evidence ↗
- The highest genetic advance as a percentage of mean was found for total pod yield (50.98%), pod yield per plot (49.39%), and pod yield per plant (44.16%). View evidence ↗
- For ELCV, genotypes NDO-24-42 and NDO-24-46 were completely resistant, whereas NDO-24-37 showed the maximum incidence at 96.85%. View evidence ↗
- The highest total pod yield was recorded in genotype NDO-24-46 (128.08 q/ha), followed by NDO-24-33 (119.39 q/ha) and NDO-24-39 (108.24 q/ha). View evidence ↗
What it means
- The authors concluded that the predominance of additive gene action for yield and quality traits means that direct phenotypic selection would be effective for developing superior genotypes. View evidence ↗
- Total pod yield, pod yield per plot, and pod yield per plant are recommended as reliable selection indices for future breeding programs. View evidence ↗
Visual summary
2 visualsIllustrations explain the paper; charts are replotted from the paper's own table values.
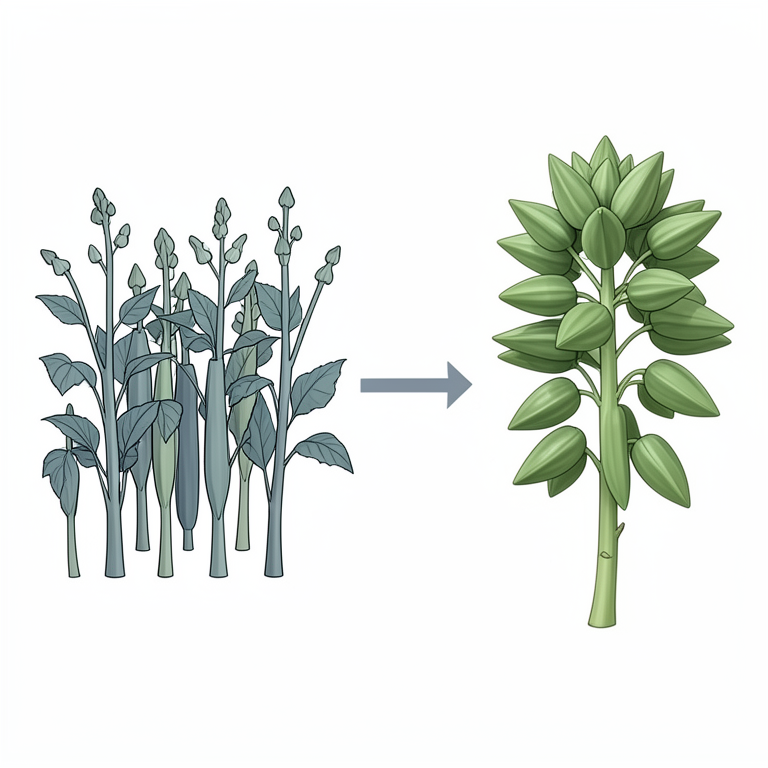
Selection Logic for Okra Improvement
AI-generated conceptual illustration (Okra plants (Abelmoschus esculentus)). It explains the idea and does not show study data.
View source evidence ↗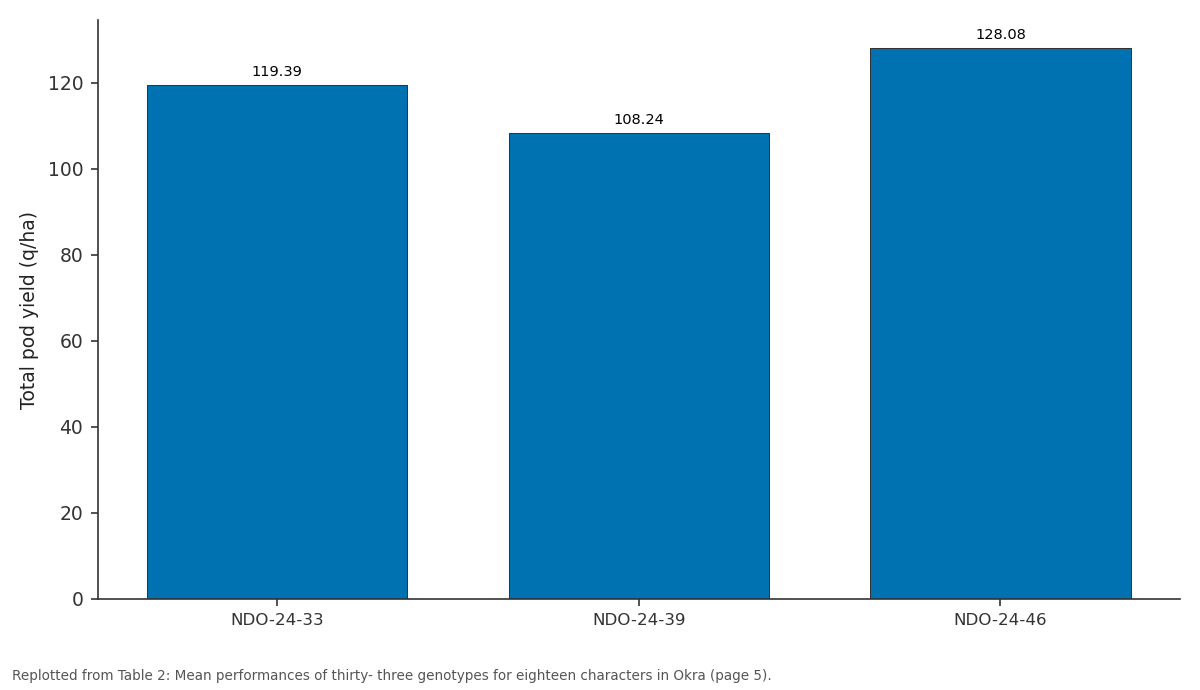
TPYH: NDO-24-33 vs NDO-24-39 vs NDO-24-46
Replotted from Table 2 (page 5) of the original paper. Every bar is the paper's own table value.
View source evidence ↗Figures & tables
From the original paper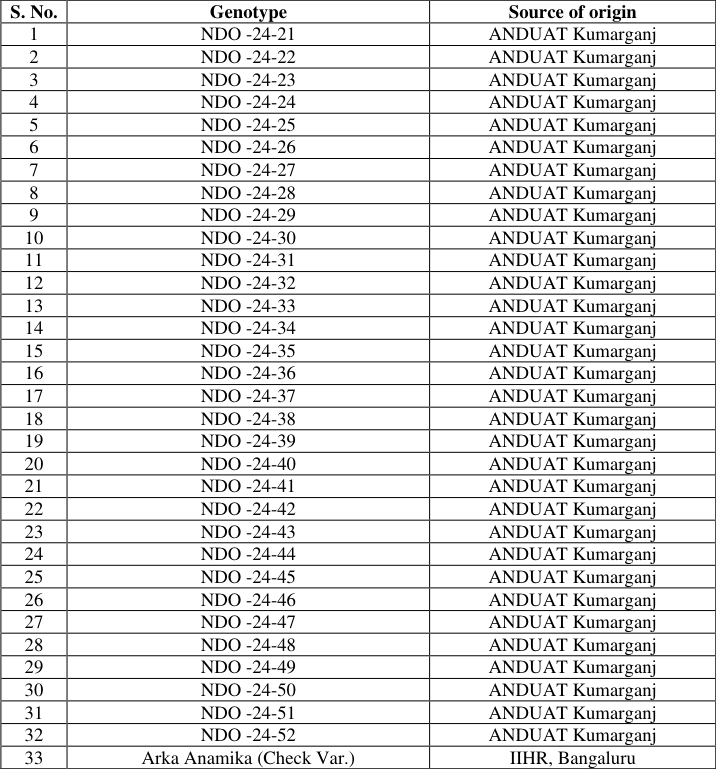 Table 1
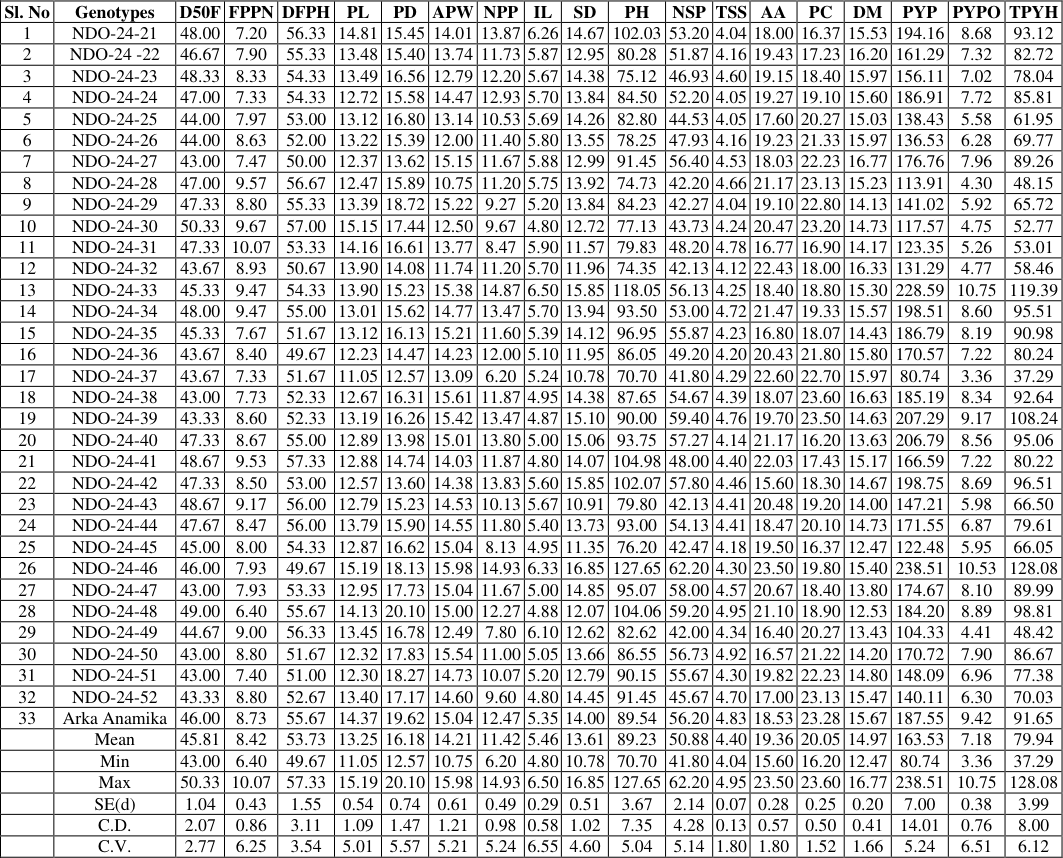 Table 2
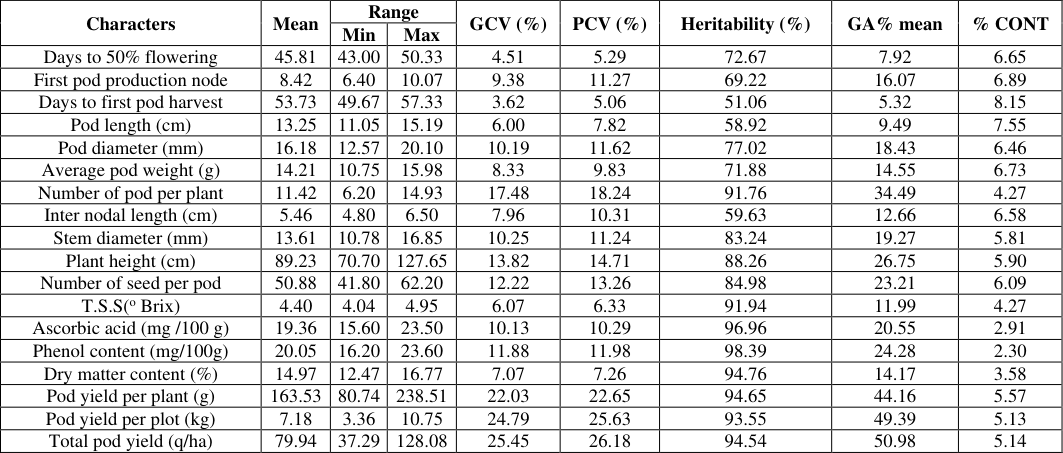 Table 3
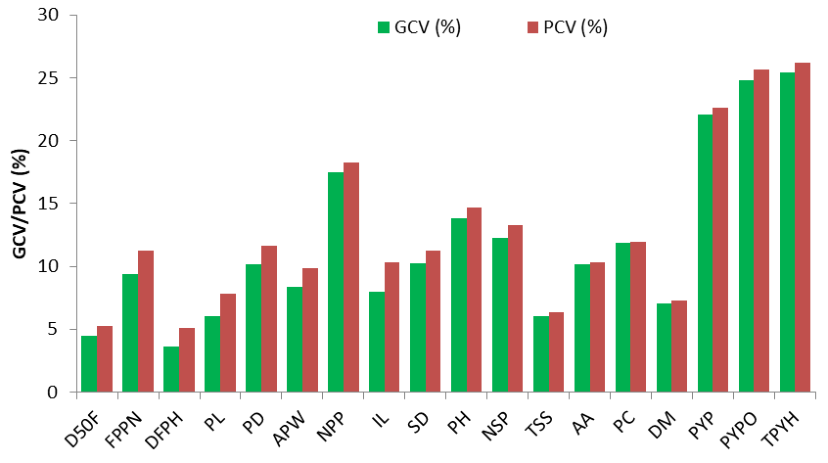 Figure 1
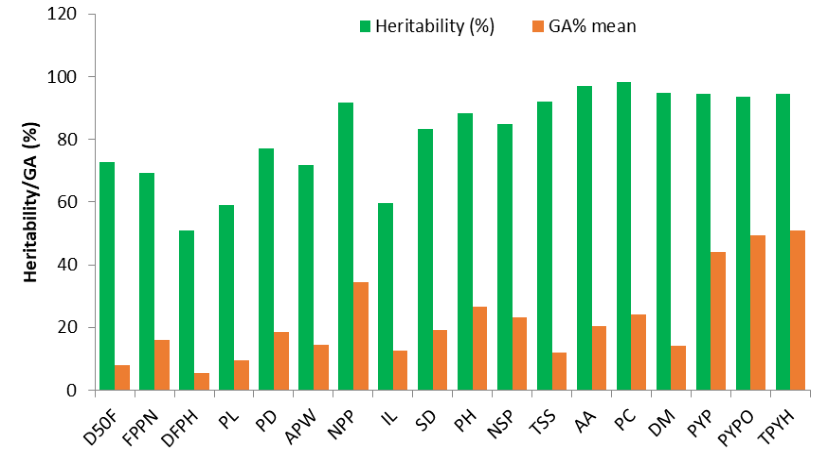 Figure 2
Introduction
Okra [Abelmoschus esculentus (L.) Moench], a member of the family Malvaceae, is one of the most important vegetable crops cultivated in tropical and subtropical regions of the world. Commonly known as lady's finger, gumbo, bamieh, bhindi, dharos, kacang, and qiukui, the crop is widely valued for its nutritional, medicinal, and economic significance (Jain et al., 2012) [1] . Although its origin is generally associated with the Abyssinian region comprising present-day Ethiopia, Eritrea, and eastern Sudan, the exact center of origin remains controversial. Some researchers have also suggested northern India as a possible centre of origin because of the occurrence of related wild species such as A. tuberculatus in the region (Rao et al., 2019) [2] . Okra is cultivated extensively under warm climatic conditions and is adapted to a wide range of agro-ecological environments. India is the leading producer of okra globally, with the crop occupying about 5.55 lakh hectares and producing approximately 73.09 lakh metric tonnes, with an average productivity of 13.17 t/ha (MoA & FW, 2024) [3] . Major okra-producing states in India include Uttar Pradesh, Bihar, and West Bengal (Eagri, 2023) [4] . The crop is suitable for both kitchen gardening and commercial cultivation and is also widely consumed in countries of Africa, South America, and Asia. The crop possesses considerable nutritional and medicinal importance. Okra fruits are rich sources of dietary fibre, vitamins, minerals, antioxidants, and bioactive compounds. The polysaccharide fraction contains substantial amounts of uronic acid, with rhamnogalacturonan being the predominant polysaccharide (Liu et al., 2018; Wang et al., 2020) [5] . Several phenolic compounds, including quercetin, rutin, catechin, caffeic acid, isoquercitrin, and protocatechuic acid, have been identified in okra fruits and are associated with antioxidant activity (Shen et al., 2019) [6] . In traditional medicine, okra has been used for its cooling, appetite-stimulating, and astringent properties. Despite its economic importance, okra productivity is constrained by several biotic and abiotic stresses. Among the biotic stresses, Yellow Vein Mosaic Virus (YVMV) is considered the most destructive disease affecting okra cultivation. The disease, transmitted by the whitefly (Bemisia tabaci Genn.), was first reported by Varma (1952) [7] and has since become widespread in major okra-growing regions. YVMV causes severe reductions in growth, fruit quality, and yield, with losses reaching up to 94% when infection occurs during the early stages of crop growth (Sanwal et al., 2014). Moreover, the breakdown of resistance in previously resistant varieties such as Parbhani Kranti, Punjab-7, Arka Anamika, and Arka Abhay suggests the emergence of new viral strains and highlights the need for continuous varietal improvement. In addition to disease pressure, abiotic stresses such as drought, high temperature, and low moisture availability adversely affect crop performance, particularly in arid and semi-arid regions (Abd El-Fattah et al., 2020) [8] . The cultivation of low-yielding and poorly adapted genotypes further limits productivity. Therefore, the identification and development of superior genotypes with enhanced yield potential, adaptability, and stress tolerance are essential for sustainable okra production. Agro-morphological characterization is an important tool for assessing genetic variability and identifying promising genotypes for crop improvement programmes. Evaluation of diverse germplasm provides valuable information on the extent of variability present in different traits and facilitates the selection of desirable parents for breeding programmes (Temam et al., 2020) [9] . The availability of wide genetic diversity in cultivated and wild species of okra offers immense opportunities for genetic improvement. However, the utilization of wild species is often restricted due to reproductive barriers, hybrid sterility, and incompatibility among species (Hamon and Hamon, 1991) [10] . Therefore, systematic evaluation of okra genotypes based on agromorphological and yield attributes is essential for identifying superior genotypes and understanding the nature of genetic variability. Such information forms the basis for effective selection and breeding strategies aimed at developing high-yielding, adaptable, and disease-resistant okra cultivars suitable for diverse agro-climatic conditions.
Materials and Methods
The present investigation entitled "Assessment of yield potential and YVMV resistance in diverse genotypes of Okra [(Abelmoschus esculentus L.) Moench]" was conducted during the Kharif season of 2025 at the Main Experimental Station, Department of Vegetable Science, Acharya Narendra Deva University of Agriculture and Technology. The study, titled ''Assessment of yield potential and YVMV resistance in diverse genotypes of Okra [Abelmoschus esculentus (L.) Moench].'' The experimental material consists of thirtythree genotypes along with check variety Arka Anamika. Thirty-two genotypes (NDO-24-21 to NDO-24-52) were obtained from the germplasm stock maintained at the Department of Vegetable Science, ANDUAT, Kumarganj, Ayodhya, while the variety 'Arka Anamika obtained from IIHR, Bengaluru, served as the check cultivar. The experiment was laid out in a Completely Randomized Block Design (CRBD) with three replications. Each genotype was sown in three rows of 3.0 m length with spacing of 60 cm × 30 cm between rows and plants, respectively. Sowing was carried out during Kharif season. Recommended agronomic practices and plant protection measures were adopted uniformly to raise a healthy crop. Observations were recorded on five randomly selected plants from each genotype in each replication, and the mean values were used for statistical analysis
Statistical Analysis
The mean values obtained from three replications were subjected to statistical analysis. Analysis of variance (ANOVA) was performed following the procedure of Panse and Sukhatme (2000) [11] . Genotypic and phenotypic coefficients of variation were estimated according to Burton and De Vane (1953) [12] . Broad-sense heritability was calculated following Allard (1960) [13] , while genetic advance as percent of mean was estimated according to Hanson et al. (1956) [14] . Genotypic and phenotypic correlation coefficients were computed following Pearson (1909) [15] and path coefficient analysis was carried out using the method proposed by Dewey and Lu (1959) [16] . Genetic divergence among genotypes was estimated using Mahalanobis D² statistics (Mahalanobis, 1936) [17] and clustering of genotypes was performed by Tocher's method.
Results and Discussion
Results and Discussion
Genetic Variability
The estimates of mean, range, genotypic variance, phenotypic variance, genotypic coefficient of variation (GCV), phenotypic coefficient of variation (PCV), broadsense heritability and genetic advance as per cent of mean for eighteen characters are presented in Table 2. A wide range of variation was observed among the thirtythree genotypes for most of the characters studied, indicating the existence of considerable genetic diversity. Pod yield per plant ranged from 80.74 to 238.51 g with a mean value of 163.53 g, whereas pod yield per plot varied from 3.36 to 10.75 kg and total pod yield ranged from 37.29 to 128.08 q/ha. Plant height also exhibited a wide range from 70.70 to 127.65 cm, while number of pods per plant varied from 6.20 to 14.93. The presence of such wide variability among the genotypes provides ample opportunity for effective selection and crop improvement. Similar results were reported by Abd El-Fattah et al. (2020) [8] , Temam et al. (2020) [9] , Prakash et al. (2022) [18] and Bambhaniya et al. (2024) [19] . In all the traits, PCV values were slightly higher than the corresponding GCV values, indicating that environmental factors had some influence on the expression of these characters. However, the narrow differences between PCV and GCV for most traits suggested that the observed variability was mainly genetic in nature. Similar observations were reported by Prakash et al. (2022) [18] and Bambhaniya et al. (2024) [19] . High estimates of GCV and PCV were recorded for total pod yield (25.45 and 26.18%, respectively), pod yield per plot (24.79 and 25.63%, respectively) and pod yield per plant (22.03 and 22.65%, respectively), indicating the presence of substantial genetic variability for these traits and suggesting greater scope for improvement through selection.
| Sl. No | Genotypes | D50F | FPPN | DFPH | PL | PD | APW | NPP | IL | SD | PH | NSP | TSS | AA | PC | DM | PYP | PYPO | TPYH |
|---|---|---|---|---|---|---|---|---|---|---|---|---|---|---|---|---|---|---|---|
| 1 | NDO-24-21 | 48.00 | 7.20 | 56.33 | 14.81 | 15.45 | 14.01 | 13.87 | 6.26 | 14.67 | 102.03 | 53.20 | 4.04 | 18.00 | 16.37 | 15.53 | 194.16 | 8.68 | 93.12 |
| 2 | NDO-24 -22 | 46.67 | 7.90 | 55.33 | 13.48 | 15.40 | 13.74 | 11.73 | 5.87 | 12.95 | 80.28 | 51.87 | 4.16 | 19.43 | 17.23 | 16.20 | 161.29 | 7.32 | 82.72 |
| 3 | NDO-24-23 | 48.33 | 8.33 | 54.33 | 13.49 | 16.56 | 12.79 | 12.20 | 5.67 | 14.38 | 75.12 | 46.93 | 4.60 | 19.15 | 18.40 | 15.97 | 156.11 | 7.02 | 78.04 |
| 4 | NDO-24-24 | 47.00 | 7.33 | 54.33 | 12.72 | 15.58 | 14.47 | 12.93 | 5.70 | 13.84 | 84.50 | 52.20 | 4.05 | 19.27 | 19.10 | 15.60 | 186.91 | 7.72 | 85.81 |
| 5 | NDO-24-25 | 44.00 | 7.97 | 53.00 | 13.12 | 16.80 | 13.14 | 10.53 | 5.69 | 14.26 | 82.80 | 44.53 | 4.05 | 17.60 | 20.27 | 15.03 | 138.43 | 5.58 | 61.95 |
| 6 | NDO-24-26 | 44.00 | 8.63 | 52.00 | 13.22 | 15.39 | 12.00 | 11.40 | 5.80 | 13.55 | 78.25 | 47.93 | 4.16 | 19.23 | 21.33 | 15.97 | 136.53 | 6.28 | 69.77 |
| 7 | NDO-24-27 | 43.00 | 7.47 | 50.00 | 12.37 | 13.62 | 15.15 | 11.67 | 5.88 | 12.99 | 91.45 | 56.40 | 4.53 | 18.03 | 22.23 | 16.77 | 176.76 | 7.96 | 89.26 |
| 8 | NDO-24-28 | 47.00 | 9.57 | 56.67 | 12.47 | 15.89 | 10.75 | 11.20 | 5.75 | 13.92 | 74.73 | 42.20 | 4.66 | 21.17 | 23.13 | 15.23 | 113.91 | 4.30 | 48.15 |
| 9 | NDO-24-29 | 47.33 | 8.80 | 55.33 | 13.39 | 18.72 | 15.22 | 9.27 | 5.20 | 13.84 | 84.23 | 42.27 | 4.04 | 19.10 | 22.80 | 14.13 | 141.02 | 5.92 | 65.72 |
| 10 | NDO-24-30 | 50.33 | 9.67 | 57.00 | 15.15 | 17.44 | 12.50 | 9.67 | 4.80 | 12.72 | 77.13 | 43.73 | 4.24 | 20.47 | 23.20 | 14.73 | 117.57 | 4.75 | 52.77 |
| 11 | NDO-24-31 | 47.33 | 10.07 | 53.33 | 14.16 | 16.61 | 13.77 | 8.47 | 5.90 | 11.57 | 79.83 | 48.20 | 4.78 | 16.77 | 16.90 | 14.17 | 123.35 | 5.26 | 53.01 |
| 12 | NDO-24-32 | 43.67 | 8.93 | 50.67 | 13.90 | 14.08 | 11.74 | 11.20 | 5.70 | 11.96 | 74.35 | 42.13 | 4.12 | 22.43 | 18.00 | 16.33 | 131.29 | 4.77 | 58.46 |
| 13 | NDO-24-33 | 45.33 | 9.47 | 54.33 | 13.90 | 15.23 | 15.38 | 14.87 | 6.50 | 15.85 | 118.05 | 56.13 | 4.25 | 18.40 | 18.80 | 15.30 | 228.59 | 10.75 | 119.39 |
| 14 | NDO-24-34 | 48.00 | 9.47 | 55.00 | 13.01 | 15.62 | 14.77 | 13.47 | 5.70 | 13.94 | 93.50 | 53.00 | 4.72 | 21.47 | 19.33 | 15.57 | 198.51 | 8.60 | 95.51 |
| 15 | NDO-24-35 | 45.33 | 7.67 | 51.67 | 13.12 | 16.13 | 15.21 | 11.60 | 5.39 | 14.12 | 96.95 | 55.87 | 4.23 | 16.80 | 18.07 | 14.43 | 186.79 | 8.19 | 90.98 |
| 16 | NDO-24-36 | 43.67 | 8.40 | 49.67 | 12.23 | 14.47 | 14.23 | 12.00 | 5.10 | 11.95 | 86.05 | 49.20 | 4.20 | 20.43 | 21.80 | 15.80 | 170.57 | 7.22 | 80.24 |
| 17 | NDO-24-37 | 43.67 | 7.33 | 51.67 | 11.05 | 12.57 | 13.09 | 6.20 | 5.24 | 10.78 | 70.70 | 41.80 | 4.29 | 22.60 | 22.70 | 15.97 | 80.74 | 3.36 | 37.29 |
| 18 | NDO-24-38 | 43.00 | 7.73 | 52.33 | 12.67 | 16.31 | 15.61 | 11.87 | 4.95 | 14.38 | 87.65 | 54.67 | 4.39 | 18.07 | 23.60 | 16.63 | 185.19 | 8.34 | 92.64 |
| 19 | NDO-24-39 | 43.33 | 8.60 | 52.33 | 13.19 | 16.26 | 15.42 | 13.47 | 4.87 | 15.10 | 90.00 | 59.40 | 4.76 | 19.70 | 23.50 | 14.63 | 207.29 | 9.17 | 108.24 |
| 20 | NDO-24-40 | 47.33 | 8.67 | 55.00 | 12.89 | 13.98 | 15.01 | 13.80 | 5.00 | 15.06 | 93.75 | 57.27 | 4.14 | 21.17 | 16.20 | 13.63 | 206.79 | 8.56 | 95.06 |
| 21 | NDO-24-41 | 48.67 | 9.53 | 57.33 | 12.88 | 14.74 | 14.03 | 11.87 | 4.80 | 14.07 | 104.98 | 48.00 | 4.40 | 22.03 | 17.43 | 15.17 | 166.59 | 7.22 | 80.22 |
| 22 | NDO-24-42 | 47.33 | 8.50 | 53.00 | 12.57 | 13.60 | 14.38 | 13.83 | 5.60 | 15.85 | 102.07 | 57.80 | 4.46 | 15.60 | 18.30 | 14.67 | 198.75 | 8.69 | 96.51 |
| 23 | NDO-24-43 | 48.67 | 9.17 | 56.00 | 12.79 | 15.23 | 14.53 | 10.13 | 5.67 | 10.91 | 79.80 | 42.13 | 4.41 | 20.48 | 19.20 | 14.00 | 147.21 | 5.98 | 66.50 |
| 24 | NDO-24-44 | 47.67 | 8.47 | 56.00 | 13.79 | 15.90 | 14.55 | 11.80 | 5.40 | 13.73 | 93.00 | 54.13 | 4.41 | 18.47 | 20.10 | 14.73 | 171.55 | 6.87 | 79.61 |
| 25 | NDO-24-45 | 45.00 | 8.00 | 54.33 | 12.87 | 16.62 | 15.04 | 8.13 | 4.95 | 11.35 | 76.20 | 42.47 | 4.18 | 19.50 | 16.37 | 12.47 | 122.48 | 5.95 | 66.05 |
| 26 | NDO-24-46 | 46.00 | 7.93 | 49.67 | 15.19 | 18.13 | 15.98 | 14.93 | 6.33 | 16.85 | 127.65 | 62.20 | 4.30 | 23.50 | 19.80 | 15.40 | 238.51 | 10.53 | 128.08 |
| 27 | NDO-24-47 | 43.00 | 7.93 | 53.33 | 12.95 | 17.73 | 15.04 | 11.67 | 5.00 | 14.85 | 95.07 | 58.00 | 4.57 | 20.67 | 18.40 | 13.80 | 174.67 | 8.10 | 89.99 |
| 28 | NDO-24-48 | 49.00 | 6.40 | 55.67 | 14.13 | 20.10 | 15.00 | 12.27 | 4.88 | 12.07 | 104.06 | 59.20 | 4.95 | 21.10 | 18.90 | 12.53 | 184.20 | 8.89 | 98.81 |
| 29 | NDO-24-49 | 44.67 | 9.00 | 56.33 | 13.45 | 16.78 | 12.49 | 7.80 | 6.10 | 12.62 | 82.62 | 42.00 | 4.34 | 16.40 | 20.27 | 13.43 | 104.33 | 4.41 | 48.42 |
| 30 | NDO-24-50 | 43.00 | 8.80 | 51.67 | 12.32 | 17.83 | 15.54 | 11.00 | 5.05 | 13.66 | 86.55 | 56.73 | 4.92 | 16.57 | 21.22 | 14.20 | 170.72 | 7.90 | 86.67 |
| 31 | NDO-24-51 | 43.00 | 7.40 | 51.00 | 12.30 | 18.27 | 14.73 | 10.07 | 5.20 | 12.79 | 90.15 | 55.67 | 4.30 | 19.82 | 22.23 | 14.80 | 148.09 | 6.96 | 77.38 |
| 32 | NDO-24-52 | 43.33 | 8.80 | 52.67 | 13.40 | 17.17 | 14.60 | 9.60 | 4.80 | 14.45 | 91.45 | 45.67 | 4.70 | 17.00 | 23.13 | 15.47 | 140.11 | 6.30 | 70.03 |
| 33 | Arka Anamika | 46.00 | 8.73 | 55.67 | 14.37 | 19.62 | 15.04 | 12.47 | 5.35 | 14.00 | 89.54 | 56.20 | 4.83 | 18.53 | 23.28 | 15.67 | 187.55 | 9.42 | 91.65 |
| Mean | 45.81 | 8.42 | 53.73 | 13.25 | 16.18 | 14.21 | 11.42 | 5.46 | 13.61 | 89.23 | 50.88 | 4.40 | 19.36 | 20.05 | 14.97 | 163.53 | 7.18 | 79.94 | |
| Min | 43.00 | 6.40 | 49.67 | 11.05 | 12.57 | 10.75 | 6.20 | 4.80 | 10.78 | 70.70 | 41.80 | 4.04 | 15.60 | 16.20 | 12.47 | 80.74 | 3.36 | 37.29 | |
| Max | 50.33 | 10.07 | 57.33 | 15.19 | 20.10 | 15.98 | 14.93 | 6.50 | 16.85 | 127.65 | 62.20 | 4.95 | 23.50 | 23.60 | 16.77 | 238.51 | 10.75 | 128.08 | |
| SE(d) | 1.04 | 0.43 | 1.55 | 0.54 | 0.74 | 0.61 | 0.49 | 0.29 | 0.51 | 3.67 | 2.14 | 0.07 | 0.28 | 0.25 | 0.20 | 7.00 | 0.38 | 3.99 | |
| C.D. | 2.07 | 0.86 | 3.11 | 1.09 | 1.47 | 1.21 | 0.98 | 0.58 | 1.02 | 7.35 | 4.28 | 0.13 | 0.57 | 0.50 | 0.41 | 14.01 | 0.76 | 8.00 | |
| C.V. | 2.77 | 6.25 | 3.54 | 5.01 | 5.57 | 5.21 | 5.24 | 6.55 | 4.60 | 5.04 | 5.14 | 1.80 | 1.80 | 1.52 | 1.66 | 5.24 | 6.51 | 6.12 |
Table text extracted from the original PDF; superscript letters are shown inline. The original table image is below.
View original table image
Moderate GCV and PCV values were observed for number of pods per plant (17.48 and 18.24%), plant height (13.82 and 14.71%), number of seeds per pod (12.22 and 13.26%), phenol content (11.88 and 11.98%), stem diameter (10.25 and 11.24%), ascorbic acid content (10.13 and 10.29%) and pod diameter (10.19 and 11.62%). Low values were recorded for days to 50% flowering, days to first pod harvest, pod length, average pod weight, inter nodal length, TSS and dry matter content. Similar findings were reported by Temam et al. (2020) [9] , Prakash et al. (2022) [18] and Bambhaniya et al. (2024) [19] . The heritability estimates varied from 51.06% for days to first pod harvest to 98.39% for phenolic content. Very high heritability was recorded for phenolic content (98.39%), ascorbic acid content (96.96%), dry matter content (94.76%), pod yield per plant (94.65%), total pod yield (94.54%), pod yield per plot (93.55%), TSS (91.94%) and number of pods per plant (91.76%). High heritability estimates indicate that these traits are less influenced by environmental factors and are largely controlled by genetic factors. Similar results were obtained by Bambhaniya et al. (2024) [19] and Prakash et al. (2022) [18] . Genetic advance as per cent of mean ranged from 5.32% for days to first pod harvest to 50.98% for total pod yield. The highest genetic advance as percentage of mean was recorded for total pod yield (50.98%), followed by pod yield per plot (49.39%), pod yield per plant (44.16%), number of pods per plant (34.49%), plant height (26.75%), phenolic content (24.28%), number of seeds per pod (23.21%) and ascorbic acid content (20.55%). High heritability coupled with high genetic advance for these traits suggested the predominance of additive gene action and indicated that improvement through simple phenotypic selection would be effective. This observation is in agreement with the findings of Allard (1960) [13] , Temam et al. (2020) [9] , Prakash et al. (2022) [18] and Bambhaniya et al. (2024) [19] . On the other hand, days to 50% flowering (7.92%), days to first pod harvest (5.32%), pod length (9.49%) and TSS (11.99%) exhibited relatively low genetic advance despite moderate to high heritability, suggesting the possible involvement of non-additive gene action and environmental influence in the expression of these characters. Therefore, direct selection for these traits may be less effective. Overall, the present investigation revealed substantial genetic variability among the thirty-three okra genotypes. The traits such as pod yield per plant, pod yield per plot, total pod yield, number of pods per plant, plant height, number of seeds per pod, phenolic content and ascorbic acid content exhibited high heritability coupled with high genetic advance and therefore can be considered reliable selection criteria for the development of superior highyielding okra genotypes.
Mean Performance
Days to 50 per cent flowering ranged from 43.00 to 50.33 days, with an overall mean of 45.81 days. The earliest flowering was observed in genotypes NDO-24-27, NDO-24-38, NDO-24-47, NDO-24-50, and NDO-24-51 (43.00 days), whereas NDO-24-30 flowered the latest (50.33 days). Early flowering genotypes are desirable as they facilitate early harvesting and allow growers to capture premium market prices. Similar variability for flowering behaviour in okra has been reported by Ramanjinappa et al. (2011) [20] , Temam et al. (2020) [9] , Prakash et al. (2022) [18] , and Bambhaniya et al. (2024) [19] , who attributed such differences primarily to genetic constitution and genotypeenvironment interactions. The first pod production node varied from 6.40 to 10.07, with a mean of 8.42. The lowest node number was recorded in NDO-24-48 (6.40), indicating earlier fruit initiation, while the highest value was observed in NDO-24-31 (10.07). Lower fruiting nodes are generally associated with earliness and enhanced yield potential because fruiting begins closer to the base of the plant. Comparable observations were reported by Prakash et al. (2022) [18] and Maurya et al. (2025) [21] . The days to first pod harvest ranged between 49.67 and 57.33 days, with a mean value of 53.73 days. Genotypes NDO-24-36 and NDO-24-46 recorded the earliest harvest (49.67 days), whereas NDO-24-41 required the maximum time (57.33 days). Early maturity is an economically important trait because it permits multiple harvests and increases market opportunities. Similar variation for maturity traits has been documented by Temam et al. (2020) [9] , Bambhaniya et al. (2024) [19] , and Maurya et al. (2025) [21] . Significant variation was observed for pod length, which ranged from 11.05 to 15.19 cm, with an overall mean of 13.25 cm. The maximum pod length was recorded in NDO-24-46 (15.19 cm) followed by NDO-24-30 (15.15 cm), whereas the minimum was recorded in NDO-24-37 (11.05 cm). Longer pods are generally preferred in fresh vegetable markets due to better consumer acceptance. Similar variability has been reported by Prakash et al. (2022) [18] , Temam et al. (2020) [9] , and Bambhaniya et al. (2024) [19] . Pod diameter varied from 12.57 to 20.10 mm, with a mean value of 16.18 mm. The highest pod diameter was observed in NDO-24-48 (20.10 mm) followed by Arka Anamika (19.62 mm), while NDO-24-37 produced the thinnest pods (12.57 mm). Differences in pod diameter among genotypes may be attributed to inherent genetic variability and have also been reported by Ramanjinappa et al. (2011) [20] and Bambhaniya et al. (2024) [19] . Plant height exhibited considerable variability, ranging from 70.70 to 127.65 cm, with an average of 89.23 cm. The tallest plants were recorded in NDO-24-46, whereas NDO-24-37 exhibited the shortest stature. Variation in plant height reflects differences in growth vigour and genetic background among the evaluated genotypes. Similar findings have been reported by Temam et al. (2020) [9] , Prakash et al. (2022) [18] , and Maurya et al. (2025) [21] . Substantial variation was also observed for total pod yield, which ranged from 37.29 to 128.08qha⁻¹ , with an overall mean of 79.94qha⁻¹ . . The highest yield was recorded in NDO-24-46 (128.08 q ha ¹) followed by NDO-24-33 ⁻ (119.39qha⁻¹) and NDO-24-39 (108.24 qha⁻¹) . The superior performance of these genotypes may be attributed to their favourable combination of yield-contributing characters such as longer pods, higher pod weight, and increased number of pods per plant. Similar ranges of variability for yield have been reported by Temam et al. (2020) [9] , Prakash et al. (2022) [18] , Bambhaniya et al. (2024) [19] , and Maurya et al. (2025) [21] .
Genetic Variability
The estimates of genotypic coefficient of variation (GCV) and phenotypic coefficient of variation (PCV) indicated varying degrees of variability among the studied traits. In general, PCV values were marginally higher than the corresponding GCV values for all characters, suggesting a relatively small influence of environmental factors on trait expression and indicating that most of the observed variation was genetic in nature. Similar observations were reported by Burton and De Vane (1953) [12] , Hanson et al. (1956) [14] , Prakash et al. (2022) [18] , and Bambhaniya et al. (2024) [19] . Among the traits studied, total pod yield (25.45 and 26.18%), pod yield per plot (24.79 and 25.63%), and pod yield per plant (22.03 and 22.65%) recorded the highest GCV and PCV values, respectively. Likewise, number of pods per plant (17.48 and 18.24%) and plant height (13.82 and 14.71%) also exhibited high variability, indicating the presence of ample genetic variation and greater scope for effective selection. Similar findings have been reported by Ramanjinappa et al. (2011) [20] , Temam et al. (2020) [9] , Prakash et al. (2022) [18] , and Bambhaniya et al. (2024) [19] . Moderate GCV and PCV estimates were observed for pod diameter, stem diameter, number of seeds per pod, phenol content, ascorbic acid, average pod weight, and first pod production node, suggesting the presence of appreciable genetic variability for these traits. On the other hand, days to 50 per cent flowering, days to first pod harvest, pod length, TSS, and dry matter content recorded comparatively lower GCV and PCV values, indicating relatively narrow variability among the genotypes. Broad-sense heritability estimates ranged from 51.06% for days to first pod harvest to 98.39% for phenol content. High heritability (>80%) was observed for most yield and quality traits, including phenol content (98.39%), ascorbic acid (96.96%), dry matter content (94.76%), pod yield per plant (94.65%), pod yield per plot (93.55%), total pod yield (94.54%), number of pods per plant (91.76%), TSS (91.94%), plant height (88.26%), number of seeds per pod (84.98%), and stem diameter (83.24%). High heritability indicates that the observed phenotypic variation is predominantly governed by genetic factors and that selection based on phenotype would be effective. Similar findings have been reported by Burton and De Vane (1953) [12] , Hanson et al. (1956) [14] , Prakash et al. (2022) [18] , and Bambhaniya et al. (2024) [19] . Genetic advance expressed as percentage of mean (GAM) ranged from 5.32% for days to first pod harvest to 50.98% for total pod yield. High GAM was recorded for total pod yield (50.98%), pod yield per plot (49.39%), pod yield per plant (44.16%), and number of pods per plant (34.49%), followed by plant height (26.75%), phenol content (24.28%), number of seeds per pod (23.21%), and ascorbic acid (20.55%). The simultaneous occurrence of high heritability and high genetic advance for these characters suggests the predominance of additive gene action, making them reliable selection criteria for yield improvement. Similar conclusions have been drawn by Hanson et al. (1956) [14] , Dewey and Lu (1959) [16] , Prakash et al. (2022) [18] , and Bambhaniya et al. (2024) [19] .
Conclusion
The present investigation involving thirty-three diverse okra genotypes revealed the existence of considerable genetic variability for yield and its associated traits, indicating ample scope for genetic improvement through selection. Significant differences among genotypes for most of the characters confirmed the presence of substantial diversity in the experimental material. Higher estimates of phenotypic coefficient of variation than genotypic coefficient of variation for all the traits indicated the influence of environmental factors on trait expression; however, the narrow differences between PCV and GCV for most characters suggested that the variability was predominantly genetic in nature. High heritability coupled with high genetic advance as percentage of mean was observed for pod yield per plant, pod yield per plot, total pod yield, number of pods per plant, plant height, number of seeds per pod, phenolic content and ascorbic acid content, indicating the predominance of additive gene action for these traits. Therefore, direct phenotypic selection for these characters would be effective in developing superior and high-yielding okra genotypes. Among the studied traits, total pod yield, pod yield per plot and pod yield per plant exhibited high variability, high heritability and high genetic advance, suggesting that these characters can serve as reliable selection indices in future breeding programmes. Hence, the identified variability among the genotypes may be effectively utilized for the development of improved okra cultivars with enhanced yield and quality attributes.
Acknowledgement
AcknowledgementThe authors express their sincere gratitude to the Department of Vegetable Science, Acharya Narendra Deva University of Agriculture and Technology (ANDUAT), Kumarganj, Ayodhya, Uttar Pradesh, for providing the necessary facilities, infrastructure, and support for conducting the present research work. The authors also acknowledge the University authorities, faculty members, and staff of the Department for their valuable guidance, cooperation, and encouragement throughout the course of the study.
Figures and tables from the paper
| S. No. | Genotype | Source of origin |
|---|---|---|
| 1 | NDO -24-21 | ANDUAT Kumarganj |
| 2 | NDO -24-22 | ANDUAT Kumarganj |
| 3 | NDO -24-23 | ANDUAT Kumarganj |
| 4 | NDO -24-24 | ANDUAT Kumarganj |
| 5 | NDO -24-25 | ANDUAT Kumarganj |
| 6 | NDO -24-26 | ANDUAT Kumarganj |
| 7 | NDO -24-27 | ANDUAT Kumarganj |
| 8 | NDO -24-28 | ANDUAT Kumarganj |
| 9 | NDO -24-29 | ANDUAT Kumarganj |
| 10 | NDO -24-30 | ANDUAT Kumarganj |
| 11 | NDO -24-31 | ANDUAT Kumarganj |
| 12 | NDO -24-32 | ANDUAT Kumarganj |
| 13 | NDO -24-33 | ANDUAT Kumarganj |
| 14 | NDO -24-34 | ANDUAT Kumarganj |
| 15 | NDO -24-35 | ANDUAT Kumarganj |
| 16 | NDO -24-36 | ANDUAT Kumarganj |
| 17 | NDO -24-37 | ANDUAT Kumarganj |
| 18 | NDO -24-38 | ANDUAT Kumarganj |
| 19 | NDO -24-39 | ANDUAT Kumarganj |
| 20 | NDO -24-40 | ANDUAT Kumarganj |
| 21 | NDO -24-41 | ANDUAT Kumarganj |
| 22 | NDO -24-42 | ANDUAT Kumarganj |
| 23 | NDO -24-43 | ANDUAT Kumarganj |
| 24 | NDO -24-44 | ANDUAT Kumarganj |
| 25 | NDO -24-45 | ANDUAT Kumarganj |
| 26 | NDO -24-46 | ANDUAT Kumarganj |
| 27 | NDO -24-47 | ANDUAT Kumarganj |
| 28 | NDO -24-48 | ANDUAT Kumarganj |
| 29 | NDO -24-49 | ANDUAT Kumarganj |
| 30 | NDO -24-50 | ANDUAT Kumarganj |
| 31 | NDO -24-51 | ANDUAT Kumarganj |
| 32 | NDO -24-52 | ANDUAT Kumarganj |
| 33 | Arka Anamika (Check Var.) | IIHR, Bangaluru |
Table text extracted from the original PDF; superscript letters are shown inline. The original table image is below.
View original table image
| Characters | Mean | Range | — | GCV (%) | PCV (%) | Heritability (%) | GA% mean | % CONT |
|---|---|---|---|---|---|---|---|---|
| Min | Max | |||||||
| Days to 50% flowering | 45.81 | 43.00 | 50.33 | 4.51 | 5.29 | 72.67 | 7.92 | 6.65 |
| First pod production node | 8.42 | 6.40 | 10.07 | 9.38 | 11.27 | 69.22 | 16.07 | 6.89 |
| Days to first pod harvest | 53.73 | 49.67 | 57.33 | 3.62 | 5.06 | 51.06 | 5.32 | 8.15 |
| Pod length (cm) | 13.25 | 11.05 | 15.19 | 6.00 | 7.82 | 58.92 | 9.49 | 7.55 |
| Pod diameter (mm) | 16.18 | 12.57 | 20.10 | 10.19 | 11.62 | 77.02 | 18.43 | 6.46 |
| Average pod weight (g) | 14.21 | 10.75 | 15.98 | 8.33 | 9.83 | 71.88 | 14.55 | 6.73 |
| Number of pod per plant | 11.42 | 6.20 | 14.93 | 17.48 | 18.24 | 91.76 | 34.49 | 4.27 |
| Inter nodal length (cm) | 5.46 | 4.80 | 6.50 | 7.96 | 10.31 | 59.63 | 12.66 | 6.58 |
| Stem diameter (mm) | 13.61 | 10.78 | 16.85 | 10.25 | 11.24 | 83.24 | 19.27 | 5.81 |
| Plant height (cm) | 89.23 | 70.70 | 127.65 | 13.82 | 14.71 | 88.26 | 26.75 | 5.90 |
| Number of seed per pod | 50.88 | 41.80 | 62.20 | 12.22 | 13.26 | 84.98 | 23.21 | 6.09 |
| T.S.S(o Brix) | 4.40 | 4.04 | 4.95 | 6.07 | 6.33 | 91.94 | 11.99 | 4.27 |
| Ascorbic acid (mg /100 g) | 19.36 | 15.60 | 23.50 | 10.13 | 10.29 | 96.96 | 20.55 | 2.91 |
| Phenol content (mg/100g) | 20.05 | 16.20 | 23.60 | 11.88 | 11.98 | 98.39 | 24.28 | 2.30 |
| Dry matter content (%) | 14.97 | 12.47 | 16.77 | 7.07 | 7.26 | 94.76 | 14.17 | 3.58 |
| Pod yield per plant (g) | 163.53 | 80.74 | 238.51 | 22.03 | 22.65 | 94.65 | 44.16 | 5.57 |
| Pod yield per plot (kg) | 7.18 | 3.36 | 10.75 | 24.79 | 25.63 | 93.55 | 49.39 | 5.13 |
| Total pod yield (q/ha) | 79.94 | 37.29 | 128.08 | 25.45 | 26.18 | 94.54 | 50.98 | 5.14 |
Table text extracted from the original PDF; superscript letters are shown inline. The original table image is below.
View original table image
References
23 in the original paper- Anonymous. Area and production of horticultural crops (2024-2025). Ministry of Agriculture and Farmers Welfare; 2024.
- Moench] varieties. Genet Resour Crop Evol. 2020;67(4):831-851.
- Allard RW. Principles of Plant Breeding. 2nd ed. New York: John Wiley and Sons Inc.; 1960.
- Barot DC, Parmar VK, Patel RK, Patel NB, Patel AI, Desai KD, Srivastava A. Assessment of okra genotypes for resistance against shoot and fruit borer, yellow vein mosaic virus and enation leaf curl virus under natural field conditions. Adv Res Teach. 2024;25(4):276-285.
- Burton GW, De Vane EH. Estimated heritability in tall replicated clonal material. Agron J. 1953;45:474-478.
- Dewey DR, Lu KH. A correlation and path coefficient analysis of components of crested wheat grass seed production. Agron J. 1959;51(9):515-518.
- Eagri. Origin, area, production, varieties, package of practices for bhindi (syn: lady's finger, bhindi) [Abelmoschus esculentus (L.) Moench] (2n = 130); 2023.
- Hamon S, Hamon P. Future prospects of the genetic integrity of two species of okra [Abelmoschus esculentus and A. caillei] cultivated in West Africa. Euphytica. 1991;58(2):101-111.
- Hanson CH, Robinson HF, Comstock RE. Biometrical studies of yield in segregating populations of Korean lespedeza. Agron J. 1956;48(6):268-272.
- Jain N, Jain R, Jain V, Jain S. A review on Abelmoschus esculentus. Pharmacia. 2012;1(3):84-89.
- Kumari P, Singh SP, Gangopadhyay KK, Chalam VC, Dubey SC, Ranjan P. Screening for okra enation leaf curl disease resistance in wild okra [Abelmoschus moschatus ssp. moschatus] germplasm of India. Indian J Agric Sci. 2021;91(10):1487-1494.
- Liu R, Lehman J, Molino P, Petroski Such F, Frank E, Sergeev A, et al. On the generalized distance in statistics. Proc Natl Inst Sci India. 1936;2(1):49-55.
- Panse VG, Sukhatme PV. Statistical Methods for Agricultural Workers. New Delhi: ICAR Publication; 2000. p. 187-197.
- Pearson K. Determination of the coefficient of correlation. Science. 1909;30(757):23-25.
- Prakash G, Halesh GK, Jagadeesha RC, Ravishankar KV, Pitchaimuthu M, Shankarappa KS. Studies on genetic variability and character association in okra [Abelmoschus esculentus (L.) Moench] for yield and its contributing traits. Pharma Innov J. 2022;11(12):36393643.
- Ramanjinappa V, Arunkumar KH, Hugar A, Shashibhaskar MS. Genetic variability in okra [Abelmoschus esculentus (L.) Moench]. Plant Arch. 2011;11:435-437.
- Rao SR, Nongsiang RH, Devi MK. Okra an important vegetable crop of India. Nehu J. 2019;17(1-2):126-131.
- Santhiya S, Yadav RK, Lata S, Sharma BB, Talukdar A, Ghosh A, Janani R. Screening of wild okra [Abelmoschus esculentus] against yellow vein mosaic and enation leaf curl diseases. Indian J Agric Sci. 2022;92(10):1268-1273.
- Sanwal SK, Venkataravanappa V, Singh A. Resistance to okra yellow mosaic disease: A review. Indian J Agric Sci. 2016;6(7):835-843.
- Shen DD, Li X, Qin YL, Li MT, Han QH, Zhou J, Wu et al. Physicochemical properties, phenolic profiles, antioxidant capacities, and inhibitory effects on digestive enzymes of okra [Abelmoschus esculentus] fruit at different maturation stages. J Food Sci Technol. 2019;56(3):1275-1286.
- Swamy KRM. Origin, distribution, taxonomy, botanical description, cytogenetic, genetic diversity and breeding of okra [Abelmoschus esculentus (L.) Moench]. Int J Dev Res. 2023;13(3):62026-62046.
- Temam N, Mohamed W, Aklilu S. Agro morphological characterization and evaluation of okra [Abelmoschus esculentus (L.) Moench] genotypes for yield and other variability components at Melkassa, Central Ethiopia. MOJ Ecol Environ Sci. 2020;5(2):80-87.
- Varma PM. Studies on the relationship of bhindi yellow vein mosaic virus and its vector the whitefly (Bemisia tabaci). Indian J Agric Sci. 1952;22:75-91.