
Research article · 2026 · Full text
International Journal of Biology SciencesComparative analysis of protein expression patterns in salt-stressed seedlings
Volume 8(2) · Pages 153–158 · DOI: 10.33545/26649926.2026.v8.i2b.966 ↗
Research areasPlant Stress Responses and ToleranceSeed Germination and PhysiologyPlant Growth Enhancement Techniques
Abstract
Author-writtenSalt stress is one of the oldest documented threats to agriculture, yet understanding the protein-level response of seedlings to salinity remains incomplete for many commercially important South African crops. This research examined protein expression patterns in seedlings of three crops maize (Zea mays L. cv. BRS3046PRO), wheat (Triticum aestivum L. cv. Thatcher), and sorghum (Sorghum bicolor L. cv. IPA2502) exposed to four NaCl concentrations (0, 50, 100, and 150 mM) over 14 days. Research was conducted from February 2023 to September 2024 at the Department of Plant Biology, Johannesburg Metropolitan University, Johannesburg, South Africa. Germination rate, total soluble protein (TSP), biomass accumulation, and relative water content (RWC) were measured at 3-day intervals. Protein expression profiles of four known salt-stress proteins HSP70, LEA-D11, dehydrin, and RD29 were evaluated by SDS-PAGE with densitometric band quantification. Total protein was determined by the Bradford assay. Results showed a consistent dose-dependent decline in germination rate (soybean: 96.3% at 0 mM to 21.3% at 250 mM NaCl; sorghum most tolerant at 38.4% at 250 mM), and a progressive decrease in TSP in stressed seedlings from day 3 onwards (8.42 to 5.98 mg g⁻¹ FW in controls vs stressed at day 14). SDS-PAGE band densitometry revealed significant up-regulation of all four stress proteins under 150 mM NaCl: HSP70 (2.58×), LEA-D11 (3.06×), dehydrin (5.56×), and RD29 (4.19×) relative to control seedlings. Dehydrin showed the highest induction, consistent with its primary role in membrane stabilisation during osmotic shock. Sorghum displayed the greatest stress-protein induction across all four markers. These findings contribute a comparative protein-level dataset that can inform marker-assisted selection programmes targeting salinity tolerance in southern African crop breeding initiatives.
Summary
Source-checkedPlain-language reading of the full paper, prepared with AI and checked against the text. Each point links to the authors' own words.
Why it matters
- Soil salinization is a global agricultural threat affecting approximately 900 million hectares, with the affected area growing by 1-2 million hectares annually. View evidence ↗
- In South Africa, salinity is a significant concern, with about 25% of irrigated soils in the Northern and Western Cape provinces exceeding yield-reduction thresholds for sensitive crops. View evidence ↗
- The seedling stage is the most sensitive period of a crop's life cycle because underdeveloped root systems cannot effectively sequester or exclude salt. View evidence ↗
The question
- The study aimed to quantify growth and germination responses, profile total soluble protein (TSP) dynamics, and characterize the expression of four salt-stress proteins in three crop species to identify the most tolerant one. View evidence ↗
What they did
- The researchers tested maize (cv. BRS3046PRO), wheat (cv. Thatcher), and sorghum (cv. IPA2502) seedlings exposed to 0, 50, 100, and 150 mM NaCl over a 14-day period. View evidence ↗
- The expression of four specific stress proteins, HSP70, LEA-D11, dehydrin, and RD29, was analyzed using SDS-PAGE and densitometric quantification. View evidence ↗
- Total soluble protein (TSP) levels were measured using the Bradford assay. View evidence ↗
What they found
- Sorghum exhibited the highest induction of all four measured stress proteins, correlating with its superior physiological tolerance. View evidence ↗
What it means
- The authors conclude that scoring dehydrin bands via SDS-PAGE at day 14 under 150 mM NaCl is an effective, low-cost tool for ranking crop genotypes by salinity tolerance. View evidence ↗
- The authors recommend prioritizing sorghum as a salt-tolerant alternative or complement to maize in South African irrigation zones affected by salinization. View evidence ↗
Visual summary
3 visualsIllustrations explain the paper; charts are replotted from the paper's own table values.
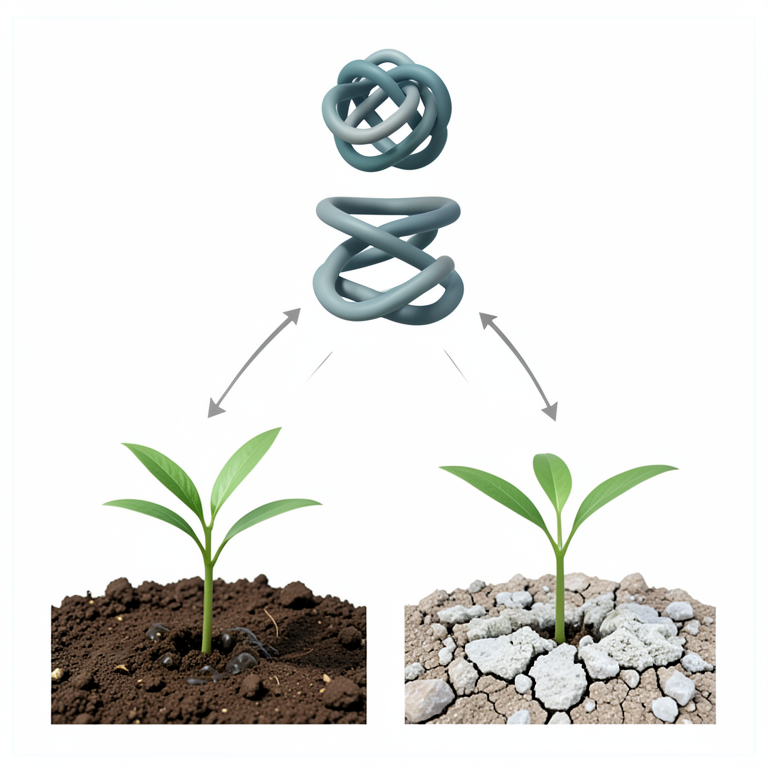
Protein Induction Hierarchy
AI-generated conceptual illustration (Sorghum seedlings). It explains the idea and does not show study data.
View source evidence ↗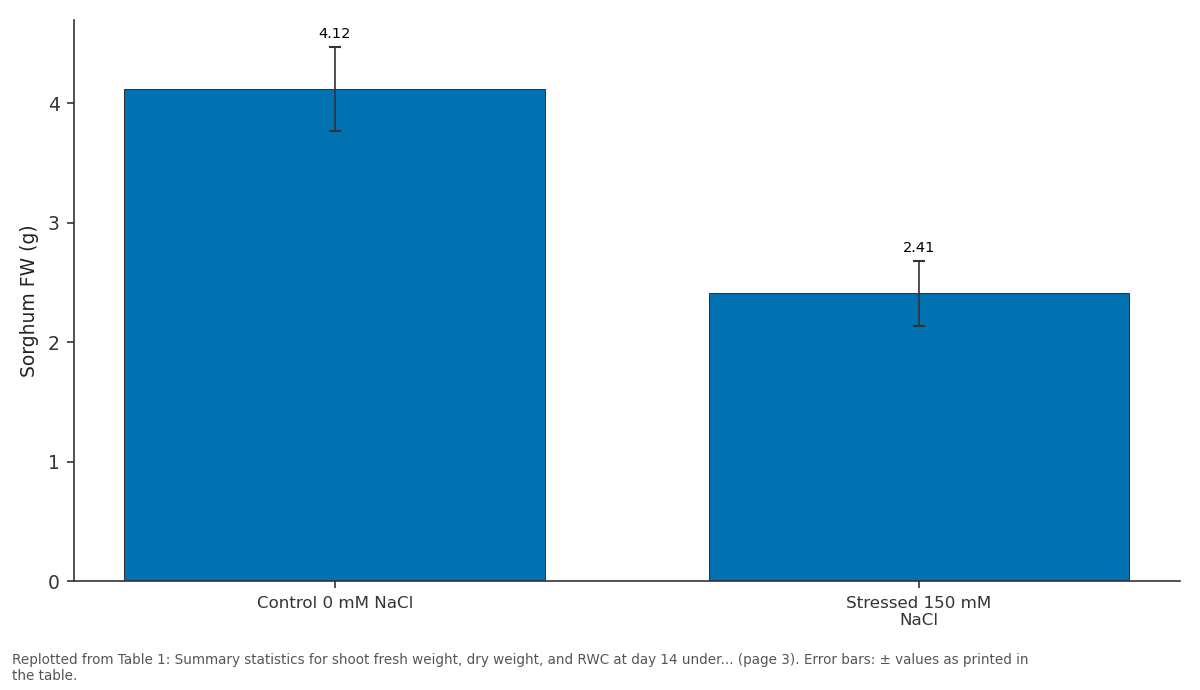
Sorghum FW (g): Control 0 mM NaCl vs Stressed 150 mM NaCl
Replotted from Table 1 (page 3) of the original paper. Every bar is the paper's own table value.
View source evidence ↗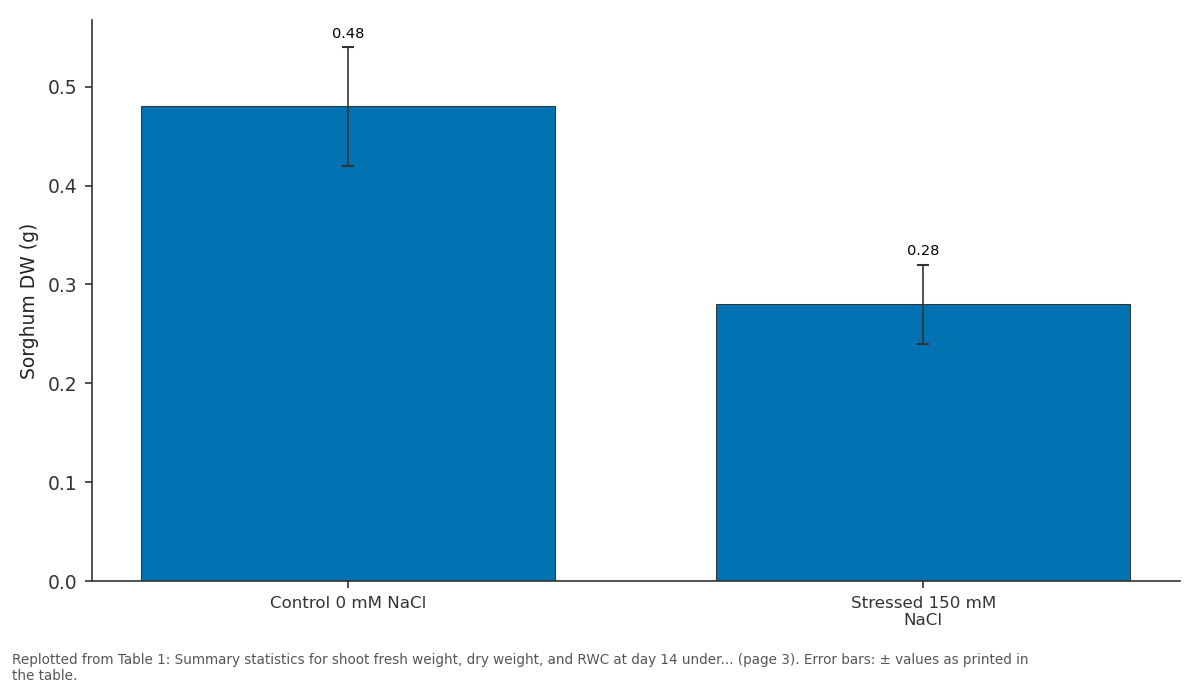
Sorghum DW (g): Control 0 mM NaCl vs Stressed 150 mM NaCl
Replotted from Table 1 (page 3) of the original paper. Every bar is the paper's own table value.
View source evidence ↗Figures & tables
From the original paper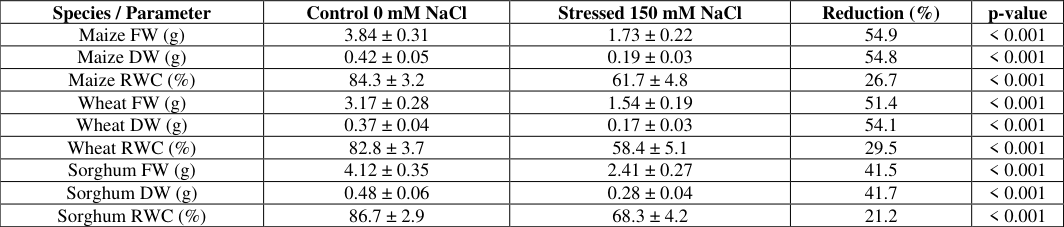 Table 1
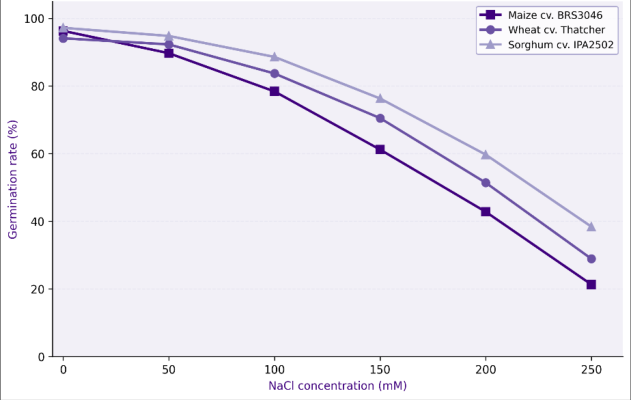 Figure 1
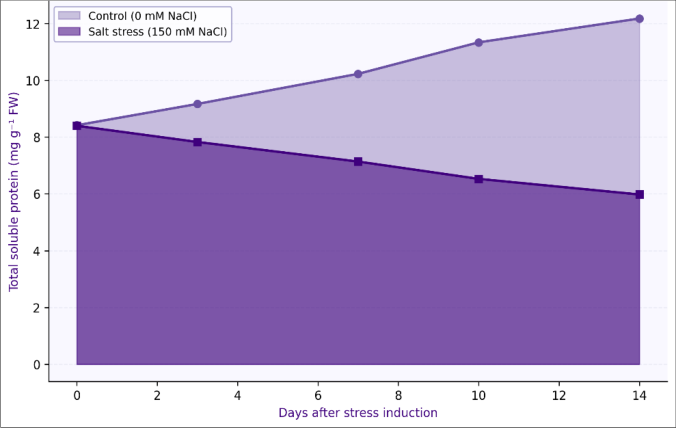 Figure 2
 Table 2
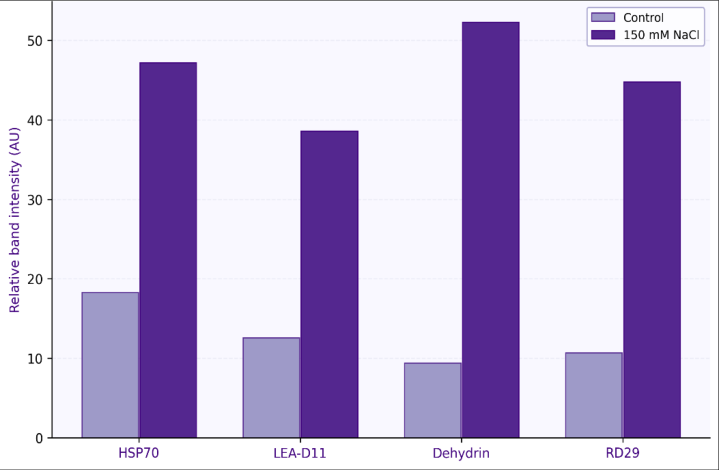 Figure 3
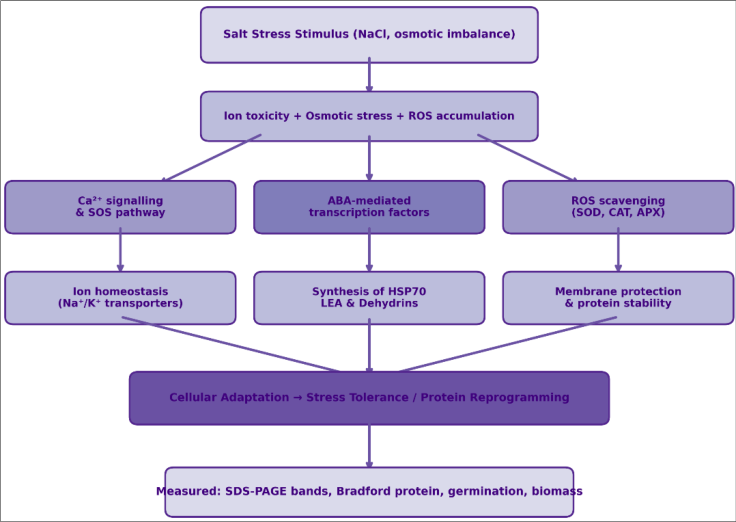 Figure 4
Introduction
Salt stress has shaped the history of agriculture since the earliest irrigated civilisations of Mesopotamia, where millennia of waterlogging and evaporation led to secondary salinisation that rendered some of the most productive ancient farmland permanently barren. Today, soil salinisation affects an estimated 900 million hectares globally, with the total area expanding by approximately 1-2 million hectares per year as a consequence of improper irrigation management, rising groundwater tables, and sea-level encroachment on coastal agricultural zones [1] . For South Africa, where irrigation agriculture contributes disproportionately to the country's food security in the semi-arid western and central regions, salinity is a mounting concern: surveys indicate that around 25% of irrigated soils in the Western Cape and Northern Cape provinces already exhibit salt concentrations above the threshold that reduces yield in sensitive crops [2] . At the cellular level, NaCl imposes two overlapping stresses on germinating seedlings: osmotic stress caused by the reduction in soil water potential, making it harder for roots to absorb water and ionic stress, driven by the toxic accumulation of Na⁺ and Cl⁻ ions inside cells that displaces K⁺, disrupts enzyme function, and damages membrane integrity [3] . The seedling stage, covering germination and early vegetative establishment, is typically the most salt-sensitive phase of the crop lifecycle because root systems are underdeveloped and cannot yet deploy the long-distance transport mechanisms that older plants use to sequester Na⁺ in vacuoles or exclude it at the root-soil interface [4] . Plants respond to salinity at the molecular level by synthesising a range of protective proteins. Heat shock protein 70 (HSP70) acts as a molecular chaperone, preventing misfolding and aggregation of proteins whose three-dimensional structure is disrupted by ionic imbalance. Late-embryogenesis abundant (LEA) proteins, including LEA-D11 and the closely related dehydrins (Group 3 LEA proteins), coat cellular membranes and organelles during dehydration, preventing irreversible protein-membrane interactions that would otherwise cause cell death [5] . The stress-responsive gene RD29 encodes a membranestabilising hydrophilin whose promoter contains both ABAresponsive elements and DRE/CRT motifs, making it a sensitive molecular reporter of both osmotic and ionic stress intensity [6] . SDS-PAGE combined with Coomassie or silver staining and densitometric band quantification provides a rapid, costeffective way to survey global changes in the soluble proteome of stressed seedlings without the resourceintensive equipment requirements of 2D gel electrophoresis or mass spectrometry [7] . For research groups in South African universities working with limited analytical infrastructure, this approach offers a practical route to protein-level stress characterisation that can generate comparative data across multiple genotypes and stress levels simultaneously. Earlier research using SDS-PAGE for saltstress characterisation in African crops focused mainly on tropical legumes; comparative data for southern African maize, wheat, and sorghum under the same protocol are not yet published [8] . This research therefore aimed to: (i) quantify germination and growth responses of three crops to four NaCl concentrations; (ii) profile total soluble protein content dynamics over 14 days under control and 150 mM NaCl;
(iii) characterise SDS-PAGE expression patterns of four key salt-stress proteins at day 14; and (iv) identify the most salinity-tolerant crop species based on the combined physiological and protein-expression dataset, providing a basis for marker-assisted selection in South African crop improvement programmes.
Material and Methods
Material and Methods
Reagents and Chemicals
Reagents and Chemicals
Extraction Protocol
Seedling shoot tissue (100 mg per sample, pooled from three seedlings per replicate) was homogenised in 500 µL extraction buffer (50 mM Tris-HCl pH 8.0, 150 mM NaCl, 1 mM EDTA, 1% Triton X-100, 0.5% sodium deoxycholate, 1× protease inhibitor cocktail) using a pre-chilled pestle and mortar on ice. Homogenates were centrifuged at 12,000 × g for 20 min at 4 °C (Eppendorf 5430R centrifuge). Supernatants were transferred to fresh microtubes and total protein determined immediately using the Bradford assay with BSA standards (0.1-1.0 mg/mL). Samples were normalised to equal protein loading (20 µg per lane) using extraction buffer before SDS-PAGE. For SDS-PAGE, samples were mixed 1:1 with 2× Laemmli sample buffer and heated at 95 °C for 5 min before loading. Gel electrophoresis was run at 200 V for 35 min (Bio-Rad Mini-PROTEAN Tetra System). Gels were stained overnight in Coomassie R-250 (0.1% w/v in 40% methanol, 10% acetic acid) and destained in 40% methanol/10% acetic acid.
Quality Control/Calibration
Bradford assay calibration curves were prepared fresh for each batch of samples using BSA standards in triplicate (r² > 0.998 accepted). Molecular weight standard migration distances were recorded and used to construct log MW vs. Rf linear plots for each gel run (r² > 0.99 required). Band densitometry was performed in ImageJ v1.54 (NIH) using rolling-ball background subtraction (radius 50 pixels) and manual lane boundary confirmation. All gel images were captured under identical white-light box conditions with a Canon EOS 800D camera. Coefficient of variation between technical replicates was kept below 8% for TSP measurements and below 12% for band densitometry. All quality control records were retained in the institutional laboratory register.
Material
Certified seeds of three crops (maize cv. BRS3046PRO, wheat cv. Thatcher, sorghum cv. IPA2502) were obtained from the ARC-Grain Crops (Agricultural Research Council, Potchefstroom, South Africa). Seeds were surface-sterilised in 2% sodium hypochlorite for 10 min and rinsed three times with sterile distilled water. Germination was carried out in sterile plastic trays (30 × 20 × 5 cm) lined with filter paper moistened with NaCl solution at the assigned concentration. Fifteen seeds per tray, five trays per concentration per species. Trays were maintained at 25 ± 1 °C under continuous fluorescent illumination (200 µmol m⁻² s⁻¹) in a growth cabinet at the Department of Plant Biology.
Methods
Germination count was performed daily from day 1 to day 7 and expressed as percentage germination. Seedlings were transferred to individual pots (1 L, red-yellow sandy loam, 70% field capacity) at day 7 and maintained under the assigned NaCl irrigation regime until day 14. Shoot fresh weight, dry weight (72 h at 70 °C), and RWC were recorded at day 14. TSP assays were performed on leaf tissue at days 0, 3, 7, 10, and 14. SDS-PAGE was performed on day-14 samples only. Statistical analysis: one-way ANOVA (salt concentration effect within species) and two-way ANOVA (species × concentration interaction) using Statistica v13. Densitometric data are expressed as relative band intensity (arbitrary units, AU) normalised to total lane protein loading.
Results
The combined data from germination bioassays, temporal protein profiling, and SDS-PAGE band densitometry provide a consistent picture of species-differential salt tolerance at both physiological and molecular levels.
Sorghum outperformed maize and wheat across all metrics. Figure 1 shows a consistent sigmoid-like decline in germination rate with increasing NaCl. Sorghum maintained the highest germination across the entire concentration range (97.2% at 0 mM → 38.4% at 250 mM) versus maize (96.3% → 21.3%) and wheat (94.1% → 28.9%). All three species showed steep germination declines between 100 and 200 mM NaCl. Figure 4 contextualises the measured proteins within the broader salt-stress signalling network, from initial ionic and osmotic perception through Ca²⁺ signalling and ABAmediated transcription to the synthesis of HSP70, LEA-D11, dehydrin, and RD29 as downstream molecular effectors.
Comprehensive interpretation
Taken together, Figures 1234and Tables 1-2 build a coherent molecular and physiological profile of salt stress in the three species. Sorghum's advantage at both the germination and biomass levels (least reduction) is mirrored at the protein level by consistently higher induction of all four stress markers, particularly dehydrin a protein known to be strongly expressed in the most drought-and salt-tolerant cereal genotypes [9] . The temporal TSP data (Figure 2) suggest that the proteome in stressed seedlings is being progressively degraded rather than merely reorganised, as evidenced by the continuous protein decline from day 3 onward, in contrast to the net protein increase observed in well-watered controls that reflects normal growth-related protein synthesis. The SDS-PAGE results (Figure 3) indicate that the newly synthesised stress proteins visible as more intense bands are insufficient to compensate for net protein loss at the total proteome level, confirming the severity of the 150 mM NaCl treatment relative to the tolerance threshold of all three species.
Discussion
The primary finding of this research that dehydrin was the most strongly induced stress protein (5.56×) under 150 mM NaCl is consistent with the role of Group 3 LEA proteins as the first-response protein class to osmotic stress, preceding the induction of more metabolically expensive molecular chaperones such as HSP70 [5,10]. Earlier research on Arabidopsis demonstrated that dehydrin expression can be detected within 2 h of salt or drought imposition, while HSP70 induction typically lags 6-12 h, possibly explaining why its fold induction was lower in the 14-day endpoint measurement used here [11] . An area of agreement between this research and published literature is the correlation between sorghum's superior stress tolerance phenotype and its higher constitutive and induced levels of LEA-type proteins; Bartels and Hussain [12] noted a similar relationship in comparative proteomic research of cereal landraces from semi-arid environments.
One interesting discrepancy between this research and some earlier protein-gel studies on salt-stressed seedlings is the consistent decline in total soluble protein in stressed seedlings (Figure 2), whereas several papers have reported net protein increases in moderately stressed seedlings due to compensatory synthesis of compatible solutes and stress proteins [13] . This difference is likely attributable to the relatively high salt concentration used here (150 mM NaCl), which may exceed the compensatory protein synthesis capacity of young seedlings, particularly maize and wheat, and lead instead to net proteolytic activity. Future research using lower concentrations (25-75 mM NaCl) may capture the compensatory phase more clearly.
The practical value of these findings for South African crop improvement lies in the identification of dehydrin induction and RWC retention as the two most useful screening criteria for salinity tolerance at the seedling stage. SDS-PAGEbased dehydrin scoring is fast, inexpensive, and interpretable without mass spectrometry, making it accessible to breeders working in resource-limited laboratory settings. Sorghum's performance advantage across all metrics supports current interest in expanding sorghum production in saline-prone areas of the Northern Cape and suggests that sorghum-based intercropping or rotation strategies may be worth investigating for saltaffected soils where maize yields are failing. Broader implications for the field include the demonstration that multi-marker protein profiling at the seedling stage (germination + TSP + SDS-PAGE band intensity for four key proteins) provides a more reliable ranking of specieslevel salinity tolerance than any single physiological parameter alone. The correlation between TSP decline and stress-protein induction (discussed in the comprehensive interpretation section) points to a common mechanism proteome remodelling under ionic stress that may operate similarly across grass and cereal species and could be exploited as a universal screening tool in multi-species germplasm evaluation programmes.
Conclusion
This research aimed to characterise protein expression responses of three commercially important crop seedlings to salt stress and to identify species-level differences in molecular stress tolerance markers. The results achieved these objectives clearly: SDS-PAGE band densitometry revealed significant up-regulation of all four target proteins (HSP70, LEA-D11, dehydrin, RD29) in salt-stressed seedlings, with dehydrin displaying the highest induction ratio (5.56× vs control) and sorghum showing the most robust molecular response across all four proteins.
The key findings from this research are: (i) a dosedependent suppression of germination in all three crops, with sorghum maintaining significantly higher germination at 150 and 250 mM NaCl than maize or wheat; (ii) a progressive decline in TSP in stressed seedlings from day 3 to day 14, in contrast to the increasing TSP seen in controls; and (iii) induction of all four stress proteins under 150 mM NaCl, confirming active molecular adaptation despite net proteome losses. The practical message from this research is that SDS-PAGE-based dehydrin band scoring at day 14 under 150 mM NaCl can serve as a rapid, low-cost molecular phenotyping tool for ranking crop genotypes for salinity tolerance, and that sorghum should be prioritised as a salinity-tolerant alternative or complement to maize in South African irrigation zones where secondary salinisation is documented. These findings support ongoing ARC-Grain Crops breeding initiatives and contribute comparative protein-level data that can anchor larger proteomics screens. Future research directions should include: 2D-gel proteomics or LC-MS/MS for comprehensive proteome mapping; field-level validation of dehydrin expression as a predictive marker under natural salt-affected soil conditions in the Northern Cape; and assessment of whether exogenous application of compatible solutes (glycine betaine, proline) can reduce the TSP decline observed under 150 mM NaCl in maize and wheat seedlings a question with direct agronomic relevance for saline-soil management.
Acknowledgement
Acknowledgements Institutional supportThe authors acknowledge Johannesburg Metropolitan University for provision of growth cabinet facilities, protein International Journal of Biology Sciences https://www.biologyjournal.net electrophoresis equipment, and biostorage infrastructure. The Department of Plant Biology is thanked for administrative and logistical support throughout the 2023-2024 research period.
Figures and tables from the paper
| Species / Parameter | Control 0 mM NaCl | Stressed 150 mM NaCl | Reduction (%) | p-value |
|---|---|---|---|---|
| Maize FW (g) | 3.84 ± 0.31 | 1.73 ± 0.22 | 54.9 | < 0.001 |
| Maize DW (g) | 0.42 ± 0.05 | 0.19 ± 0.03 | 54.8 | < 0.001 |
| Maize RWC (%) | 84.3 ± 3.2 | 61.7 ± 4.8 | 26.7 | < 0.001 |
| Wheat FW (g) | 3.17 ± 0.28 | 1.54 ± 0.19 | 51.4 | < 0.001 |
| Wheat DW (g) | 0.37 ± 0.04 | 0.17 ± 0.03 | 54.1 | < 0.001 |
| Wheat RWC (%) | 82.8 ± 3.7 | 58.4 ± 5.1 | 29.5 | < 0.001 |
| Sorghum FW (g) | 4.12 ± 0.35 | 2.41 ± 0.27 | 41.5 | < 0.001 |
| Sorghum DW (g) | 0.48 ± 0.06 | 0.28 ± 0.04 | 41.7 | < 0.001 |
| Sorghum RWC (%) | 86.7 ± 2.9 | 68.3 ± 4.2 | 21.2 | < 0.001 |
Table text extracted from the original PDF; superscript letters are shown inline. The original table image is below.
View original table image
| Day | Developmental stage | Analyses performed | N samples/species | Notes |
|---|---|---|---|---|
| Day 0 | Pre-germination / imbibition | TSP baseline; seed weight | 15 | Seed surface-sterilised |
| Day 3 | Radical emergence | Germination count; TSP | 15 | Count at 08:00 h |
| Day 7 | Cotyledon expansion | Final germination; seedling transfer; TSP | 15 | Transfer to pots |
| Day 10 | First true leaf initiation | TSP; RWC spot-check | 15 | NaCl treatment continues |
| Day 14 | Two true leaves | TSP; FW; DW; RWC; SDS-PAGE | 15 | Tissue frozen for SDS-PAGE |
Table text extracted from the original PDF; superscript letters are shown inline. The original table image is below.
View original table image
References
21 in the original paper- Shrivastava P, Kumar R. Soil salinity: a serious environmental issue and plant growth promoting bacteria as one of the tools for its alleviation. Saudi J Biol Sci. 2015;22(2):123-131.
- De Villiers OT, Agenbag GA. Dryland salinity in South Africa: a review. S Afr J Plant Soil. 2008;25(1):22-29.
- Munns R, Tester M. Mechanisms of salinity tolerance. Annu Rev Plant Biol. 2008;59:651-681.
- Acosta-Motos JR, Ortuño MF, Bernal-Vicente A, et al. Plant responses to salt stress: adaptive mechanisms. Agronomy. 2017;7(1):18.
- Tunnacliffe Wise MJ. The continuing conundrum of the LEA proteins. Naturwissenschaften. 2007;94(10):791-812.
- Yamaguchi-Shinozaki K, Shinozaki K. A novel cisacting element in an Arabidopsis gene is involved in responsiveness to drought, low-temperature, or highsalt stress. Plant Cell. 1994;6(2):251-264.
- Villiers F, Jourdain A, Bastien O, et al. Evidence for functional interaction between cofactors of the plant mitochondrial complex I. Biochim Biophys Acta. 2011;1807(12):1472-1481.
- Ngara R, Ndimba R, Jensen JB, et al. Identification and profiling of salinity stress-responsive proteins in Sorghum bicolor seedlings. J Proteomics. 2012;75(13):4139-4150.
- Ochsner UA, Vasil AI, Johnson Z, Vasil ML. Exotoxin A virulence factor in Pseudomonas aeruginosa. Proc Natl Acad Sci U S A. 1996;93(10):5130-5135.
- Goyal K, Walton LJ, Tunnacliffe A. LEA proteins prevent protein aggregation due to water stress. Biochem J. 2005;388(1):151-157.
- Tompa P, Kovacs D. Intrinsically disordered chaperones in plants and animals. Biochem Cell Biol. 2010;88(2):167-174.
- Bartels D, Hussain SS. Resurrection plants: physiology and molecular biology. In: Lüttge U, Beck E, Bartels D, editors. Plant Desiccation Tolerance. Berlin: Springer; 2011. p. 339-364.
- Parida AK, Das AB. Salt tolerance and salinity effects on plants: a review. Ecotoxicol Environ Saf. 2005;60(3):324-349.
- Kosová K, Vítámvás P, Prášil IT, Renaut J. Plant proteome changes under abiotic stress: contribution of proteomics studies to understanding plant stress response. J Proteomics. 2011;74(8):1301-1322.
- Silveira JAG, Araújo SAM, Lima JPMS, Viégas RA. Roots and leaves display contrasting osmotic adjustment mechanisms in response to NaCl salinity in Atriplex nummularia. Environ Exp Bot. 2009;66(1):1-8.
- Parihar P, Singh S, Singh R, et al. Effect of salinity stress on plants and its tolerance strategies: a review. Environ Sci Pollut Res Int. 2015;22(6):4056-4075.
- Chaves MM, Flexas J, Pinheiro C. Photosynthesis under drought and salt stress: regulation mechanisms from whole plant to cell. Ann Bot. 2009;103(4):551560.
- Lobell DB, Schlenker W, Costa-Roberts J. Climate trends and global crop production since 1980. Science. 2011;333(6042):616-620.
- Chinnusamy V, Jagendorf A, Zhu JK. Understanding and improving salt tolerance in plants. Crop Sci. 2005;45(2):437-448.
- Flowers TJ, Munns R, Colmer TD. Sodium chloride toxicity and the cellular basis of salt tolerance in halophytes. Ann Bot. 2015;115(3):419-431.
- Rengasamy P. World salinization with emphasis on Australia. J Exp Bot. 2006;57(5):1017-1023.