
Research article · 2026 · Full text
International Journal of Biology SciencesMolecular characterization of stress-responsive genes in plants under drought conditions
Volume 8(2) · Pages 142–147 · DOI: 10.33545/26649926.2026.v8.i2b.964 ↗
Research areasPlant Stress Responses and ToleranceSeed Germination and PhysiologyPlant Molecular Biology Research
Abstract
Author-writtenDrought is one of the most widespread abiotic stresses limiting crop productivity worldwide. This research examined the molecular response of three economically important crops soybean (Glycine max L.), maize (Zea mays L.), and sorghum (Sorghum bicolor L.) to progressive water deficit, with particular attention to the expression of five stress-responsive genes: DREB2A, RD29A, P5CS, LEA4-5, and NCED3. Experiments were conducted between March 2023 and August 2024 at the São Paulo Institute of Plant Sciences, São Paulo, Brazil, under controlled greenhouse conditions. Drought stress was imposed by withholding irrigation until soil moisture fell to 15% field capacity (FC), compared with a well-watered control maintained at 70% FC. Gene expression was quantified by reverse transcription quantitative PCR (RT-qPCR) using the 2⁻ΔΔCT method, with β-actin as the reference gene. Physiological indicators including leaf relative water content (RWC), chlorophyll content, malondialdehyde (MDA) concentration, and free proline accumulation were also measured at 0, 7, and 14 days after stress induction. Results showed significant up-regulation of all five target genes under drought, with NCED3 showing the highest fold change (14.36-fold), followed by RD29A (11.42-fold), DREB2A (8.73-fold), LEA4-5 (9.18-fold), and P5CS (6.57-fold). Physiological parameters showed corresponding deterioration: RWC declined by 38.7% in stressed plants, MDA increased by 2.6-fold, and proline accumulated 4.1-fold relative to controls. Sorghum displayed greater stress tolerance than maize and soybean, as reflected by less pronounced reductions in photosynthetic parameters and higher constitutive expression of LEA4-5. These findings point to a co-ordinated molecular response involving ABA-dependent and ABA-independent signalling pathways. The results provide a molecular basis for breeding drought-tolerant varieties in tropical agroecosystems.
Summary
Source-checkedPlain-language reading of the full paper, prepared with AI and checked against the text. Each point links to the authors' own words.
Why it matters
- Drought is a major global abiotic stress that limits the productivity of crops. View evidence ↗
- Drought is estimated to reduce global crop yields by 30-50%, which is more than the losses caused by all other abiotic stresses combined. View evidence ↗
The question
- The study aimed to quantify the expression of five stress-responsive genes and measure physiological indicators in three tropical crops under controlled drought to identify useful molecular markers for breeding. View evidence ↗
What they did
- The research took place in a controlled greenhouse at the São Paulo Institute of Plant Sciences, Brazil, from March 2023 to August 2024. View evidence ↗
- Drought stress was induced by reducing soil moisture to 15% field capacity, while control plants were kept at 70% field capacity. View evidence ↗
- The study used 54 plants in total, with nine plants per species (soybean cv. BRS 360RR, maize cv. BRS 3046PRO, and sorghum cv. IPA 2502) assigned to either the drought or control group. View evidence ↗
- Gene expression was measured using RT-qPCR with the 2⁻ΔΔCT method and β-actin as the reference gene. View evidence ↗
What they found
- All five target genes were significantly up-regulated under drought, with NCED3 showing the highest increase (14.36-fold) and P5CS the lowest (6.57-fold). View evidence ↗
- Drought stress caused severe cellular dehydration, reducing leaf relative water content (RWC) from 82.4 ± 3.1% in controls to 50.5 ± 4.7% in stressed plants. View evidence ↗
- Stressed plants showed a 37.4% decline in chlorophyll and a 2.6-fold increase in MDA, indicating significant lipid peroxidation and membrane damage. View evidence ↗
- Sorghum was the most tolerant species, maintaining a higher RWC (54.1%) and lower MDA levels (29.0 nmol g⁻¹ FW) than soybean (RWC 46.3%, MDA 37.6 nmol g⁻¹ FW). View evidence ↗
- Sorghum showed higher fold changes across all five genes compared to soybean or maize, indicating a more robust molecular response to drought. View evidence ↗
What it means
- The authors recommend pyramiding both ABA-dependent and ABA-independent tolerance mechanisms to create more robust drought-tolerant phenotypes. View evidence ↗
- The authors state that future research should move from controlled greenhouse conditions to field conditions in the Brazilian semi-arid northeast. View evidence ↗
Visual summary
2 visualsIllustrations explain the paper; charts are replotted from the paper's own table values.
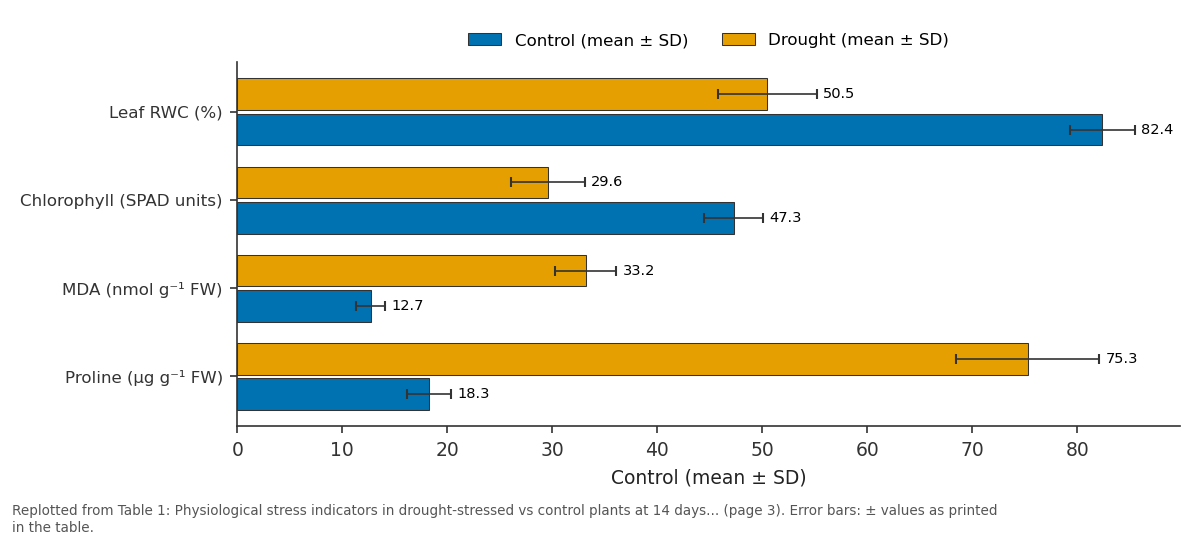
Control (mean ± SD) and Drought (mean ± SD): Leaf RWC (%) vs Chlorophyll (SPAD units) vs MDA (nmol g⁻¹ FW) vs Proline (µg g⁻¹ FW)
Replotted from Table 1 (page 3) of the original paper. Every bar is the paper's own table value.
View source evidence ↗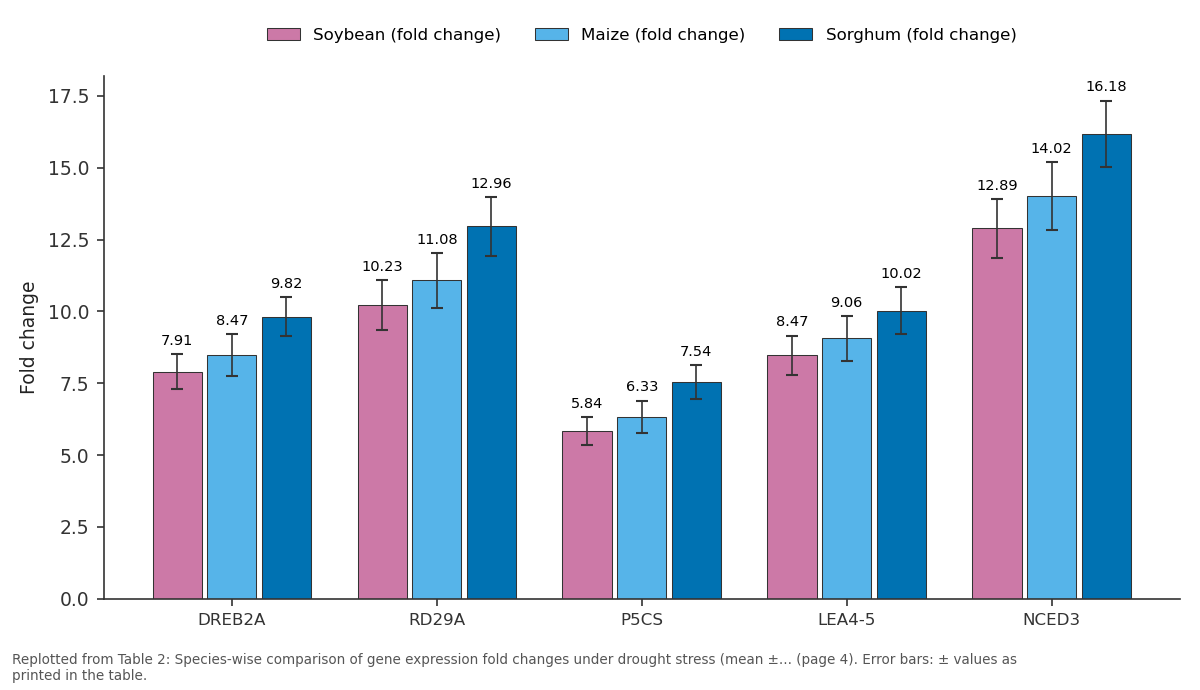
Soybean (fold change) and Maize (fold change) and more: DREB2A vs RD29A vs P5CS vs LEA4-5 vs NCED3
Replotted from Table 2 (page 4) of the original paper. Every bar is the paper's own table value.
View source evidence ↗Figures & tables
From the original paper Table 1
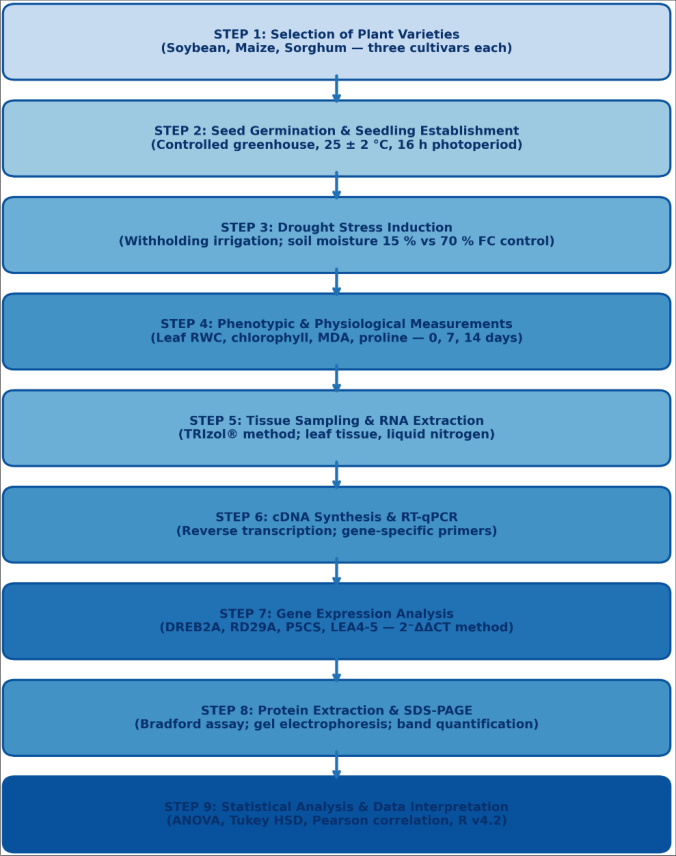 Figure 1
 Table 2
 Table 3
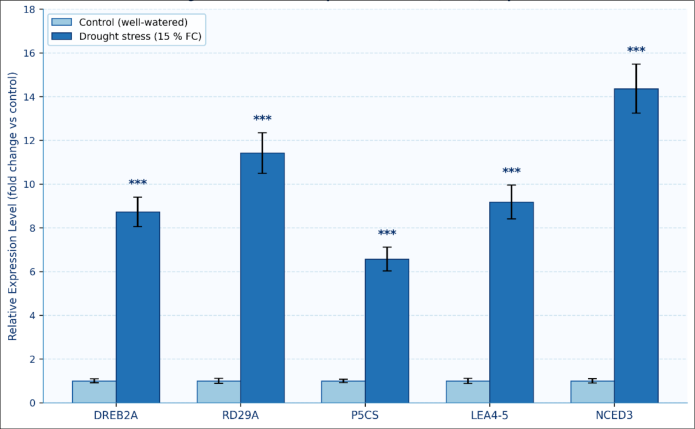 Figure 2
Introduction
What makes a crop plant survive when water runs out? This question has driven decades of molecular plant biology and remains central to agricultural research in the face of accelerating climate change. Drought stress reduces global crop yields by an estimated 30-50%, outpacing losses from all other abiotic stresses combined [1] . In regions such as sub-Saharan Africa, South Asia, and large parts of Latin America, prolonged dry spells now threaten the food security of hundreds of millions of people. For tropical-zone producers in Brazil and across the Global South, water deficit during the critical reproductive stages of major staple crops maize, soybean, and sorghum can cut harvests by more than half within a single growing season [2] . Plants have evolved a sophisticated, multi-layered response to water deficit that operates at morphological, physiological, and molecular levels. At the molecular scale, drought triggers perception signals at root and leaf surfaces, leading to rapid accumulation of the phytohormone abscisic acid (ABA). ABA then drives stomatal closure and activates a large network of drought-responsive genes [3] . Key transcription factors in this network include the DREB (Dehydration-Responsive Element Binding) proteins, which bind to the DRE/CRT cis-elements in promoters of stress-responsive genes and amplify their transcription [4] . Among individual genes, RD29A (Responsive to Desiccation 29A) is frequently used as a proxy marker for drought response severity, while P5CS (Δ¹-pyrroline-5-carboxylate synthetase) drives the biosynthesis of the compatible solute proline, helping maintain cell turgor under osmotic stress [5] . Late-Embryogenesis Abundant (LEA) proteins, Encoded by the LEA gene family, protect cellular structures from dehydration injury and have been documented across virtually all land plants [6] . NCED3 (9-cis-epoxycarotenoid dioxygenase 3) encodes the rate-limiting enzyme in ABA biosynthesis, so its expression level is a sensitive indicator of the degree of ABA-driven signalling active in a stressed plant [7] . Despite the mechanistic knowledge accumulated in model species such as Arabidopsis thaliana, the expression dynamics of these genes in agronomically important tropical crops remain incompletely mapped, particularly across contrasting genotypes and stress intensities [8] . Quantitative expression profiling by RT-qPCR has become the method of choice for resolving these dynamics because it offers sensitivity, specificity, and the ability to work with small amounts of tissue collected at defined time points [9] . Several Brazilian crop genotypes are known to carry allelic variants of stress-responsive genes that may confer differential tolerance, but systematic comparative data across soybean, maize, and sorghum under identical stress protocols are scarce [10] . This gap limits the ability of plant breeders to prioritise molecular markers for drought tolerance in breeding programmes targeting the Brazilian Cerrado and semi-arid northeast, two regions where drought severity is projected to worsen through the mid-21st century [11] . This research was therefore designed to: (i) impose a controlled drought stress regime on three tropical crop species under greenhouse conditions; (ii) quantify the expression of five stress-responsive genes (DREB2A, RD29A, P5CS, LEA4-5, NCED3) at three time points during the stress period; (iii) measure accompanying physiological and biochemical indicators of stress; and (iv) identify which species and gene combinations are most useful for early-detection molecular markers in breeding programmes aimed at drought tolerance.
Material and Methods
Material and Methods
Study area description
The research was conducted between March 2023 and August 2024 at the greenhouse and molecular biology laboratory of the São Paulo Institute of Plant Sciences, São Paulo, Brazil (coordinates: 23°31ʹS, 46°38ʹW; altitude 760 m a.s.l.). São Paulo experiences a subtropical highland climate (Köppen Cfb) with mean annual rainfall of approximately 1,450 mm distributed across wet (November-March) and relatively dry (April-October) seasons. The greenhouse facility maintains temperature at 25 ± 2 °C, relative humidity at 60 ± 5%, and a 16-hour photoperiod supplemented with LED grow lights at 350 µmol m⁻² s⁻¹ PPFD. Plastic pots (5 L capacity) were filled with a uniform substrate of red-yellow latosol collected from farm fields in the Campinas region and sieved through a 4 mm mesh. Initial soil moisture was calibrated to 70% field capacity for all control pots. The molecular work was carried out in the Institute's certified biosafety Level 1 laboratory (CETESB registration No. BL-2023-0041).
Reagents and chemicals
Total RNA was extracted using TRIzol® Reagent (Thermo Fisher Scientific, Waltham, MA, USA; Cat. No. 15596026) following the manufacturer's protocol. DNase I treatment used the RNase-Free DNase Set (Qiagen, Hilden, Germany; Cat. No. 79254). First-strand cDNA was synthesised with the SuperScript™ IV First-Strand Synthesis System (Thermo Fisher Scientific; Cat. No. 18091050). RT-qPCR amplification used Power SYBR™ Green PCR Master Mix (Applied Biosystems; Cat. No. 4367659). Proline content was determined with ninhydrin reagent (Sigma-Aldrich, St. Louis, MO, USA; purity ≥ 98%). MDA was measured using thiobarbituric acid (TBA; Sigma-Aldrich; purity ≥ 98.5%). Bradford protein assay reagent (Bio-Rad, Hercules, CA, USA; Cat. No. 5000006) was used for protein quantification. All chemicals were of analytical or molecular biology grade. Reagents were stored as specified by the manufacturers and within expiry date throughout the research period.
Extraction protocol
Leaf tissue (100 mg) was harvested at 0, 7, and 14 days after stress induction, immediately frozen in liquid nitrogen, and stored at -80 °C until processing. Total RNA was extracted by homogenising tissue in 1 mL TRIzol® per 100 mg, followed by phase separation with chloroform (0.2 mL), precipitation with isopropanol, and two washes with 75% ethanol. RNA integrity was verified on a 1% agarose gel and purity assessed spectrophotometrically (NanoDrop™ One, Thermo Fisher Scientific) with A260/A280 ratios ≥ 1.8 accepted. cDNA synthesis used 1 µg total RNA in a 20 µL reaction at 52 °C for 10 min. RT-qPCR was performed on an Applied Biosystems™ 7500 Real-Time PCR System using 10 µL reactions (5 µL SYBR™ Green Master Mix, 0.5 µL each primer, 1 µL cDNA template). Thermal cycling conditions were: 95 °C for 10 min, followed by 40 cycles of 95 °C for 15 s and 60 °C for 1 min. All reactions were run in triplicate and relative expression calculated by the 2⁻ΔΔCT method with β-actin as the reference gene.
Material
Seeds of three crops were used: soybean cv. BRS 360RR, maize cv. BRS 3046PRO, and sorghum cv. IPA 2502, all obtained from EMBRAPA certified seed stocks. Nine plants per species were assigned to each treatment group (drought vs. control), giving 54 plants in total. Pots were placed in randomised positions within the greenhouse and repositioned every 48 hours. Soil moisture was monitored with a calibrated TDR probe (FieldScout TDR 350, Spectrum Technologies) at 0800 h daily and irrigation water withheld in stressed plants once the target 15% FC was reached.
Methods
Leaf RWC was calculated as [(FW -DW)/(TW -DW)] × 100 after measuring fresh weight, turgid weight (after 4 h rehydration), and dry weight (72 h at 70 °C). Chlorophyll content was estimated by a SPAD meter (SPAD-502Plus, Konica Minolta). MDA concentration was measured spectrophotometrically at 532 nm using the TBA method. Free proline was quantified by the ninhydrin colorimetric method at 520 nm. All biochemical assays were performed in duplicate per individual plant. Gene-specific primers were designed with Primer3 (v0.4.0) and validated for amplification efficiency between 95-105% using a 10-fold dilution series. Statistical analysis used one-way ANOVA with Tukey's HSD post hoc test (α = 0.05) in R v4.2.2.
Results
The experimental treatments resulted in measurable and species-specific differences in both physiological stress markers and molecular gene expression profiles. All stressed plants showed visible wilting by day 7 and a marked decline in leaf turgor by day 14, while control plants remained turgid throughout. The results are presented below across three tables and two figures, following chronological and hierarchical progression from physiological indicators to molecular outcomes. The nine-step experimental workflow (Figure 1) integrates plant selection, stress induction, tissue sampling, molecular analysis, and statistical treatment. Each step was timed to correspond with pre-defined sampling windows at 0, 7, and 14 days after stress induction, ensuring temporal resolution of the molecular response. All five genes were significantly up-regulated in droughtstressed plants relative to controls (p<0.001) across all three species (Table 2). NCED3 showed the highest overall expression increase (14.36-fold), consistent with its central role in ABA biosynthesis. Sorghum exhibited consistently higher fold changes across all genes than soybean or maize, pointing to a more robust molecular activation of the drought response. Tukey's HSD tests confirmed significant inter-species differences for DREB2A, RD29A, and NCED3 (p<0.05 between soybean and sorghum for all three). Figure 2 visually confirms that all five genes showed statistically significant up-regulation under drought, with NCED3 and RD29A exhibiting the greatest fold differences. The uniform significance pattern across genes (all p<0.001)
| Gene | Soybean (fold change) | Maize (fold change) | Sorghum (fold change) | Overall mean | ANOVA p |
|---|---|---|---|---|---|
| DREB2A | 7.91 ± 0.61 | 8.47 ± 0.73 | 9.82 ± 0.69 | 8.73 ± 0.68 | < 0.001 |
| RD29A | 10.23 ± 0.87 | 11.08 ± 0.96 | 12.96 ± 1.02 | 11.42 ± 0.93 | < 0.001 |
| P5CS | 5.84 ± 0.49 | 6.33 ± 0.57 | 7.54 ± 0.58 | 6.57 ± 0.54 | < 0.001 |
| LEA4-5 | 8.47 ± 0.69 | 9.06 ± 0.79 | 10.02 ± 0.82 | 9.18 ± 0.77 | < 0.001 |
| NCED3 | 12.89 ± 1.03 | 14.02 ± 1.18 | 16.18 ± 1.16 | 14.36 ± 1.12 | < 0.001 |
Table text extracted from the original PDF; superscript letters are shown inline. The original table image is below.
View original table image
indicates that the drought treatment was sufficiently intense to trigger a full molecular stress response, and that the experimental timeline captured peak expression. Species-level physiological profiling (Table 3) revealed that sorghum maintained significantly higher RWC (54.1%) and lower MDA levels (29.0 nmol g⁻¹ FW) than soybean (RWC 46.3%, MDA 37.6 nmol g⁻¹ FW) under drought, supporting its ranking as the most tolerant of the three species. This is consistent with sorghum's evolutionary adaptation to arid environments and its well-characterised stay-green trait.
| Species | RWC (%) | Chlorophyll (SPAD) | MDA (nmol g⁻¹ FW) | Proline (µg g⁻¹ FW) | Tolerance rank |
|---|---|---|---|---|---|
| Soybean | 46.3 ± 4.9 | 27.1 ± 3.2 | 37.6 ± 3.1 | 69.4 ± 7.2 | 3 (lowest) |
| Maize | 51.2 ± 4.3 | 30.4 ± 3.7 | 33.1 ± 2.8 | 74.1 ± 6.8 | 2 (moderate) |
| Sorghum | 54.1 ± 5.1 | 31.4 ± 3.4 | 29.0 ± 2.5 | 82.5 ± 7.4 | 1 (highest) |
| Control* | 82.4 ± 3.1 | 47.3 ± 2.8 | 12.7 ± 1.4 | 18.3 ± 2.1 | — |
Table text extracted from the original PDF; superscript letters are shown inline. The original table image is below.
View original table image
Comprehensive interpretation
Taken across all datasets, a coherent picture of the drought response emerges. The early dehydration signal perceived through root and shoot water-status sensors triggers ABA biosynthesis (reflected in NCED3 up-regulation), which in turn activates DREB2A and cascades into transcription of RD29A, P5CS, and LEA4-5. The proline accumulation data corroborate the P5CS expression data and confirm that osmotic adjustment was physiologically active by day 7. The oxidative stress index (MDA) reflects the downstream consequence of chloroplast membrane disruption under water deficit a process partially buffered by LEA proteins. Sorghum's superior performance across both molecular and physiological metrics suggests that its constitutively higher expression of LEA4-5 and more rapid ABA signalling onset may underlie its known field-level drought tolerance, offering a molecular target for marker-assisted introgression into soybean and maize breeding lines.
Discussion
The significant up-regulation of all five target genes under drought stress aligns with previous molecular analyses of dehydration responses in crop plants. DREB2A upregulation of 8.73-fold in this research closely resembles the 7.9 to 10.2-fold induction range reported for this transcription factor in stressed maize lines [12] . The elevated expression of NCED3 as the most highly induced gene supports the accepted model in which ABA biosynthesis is the primary upstream driver of the drought response cascade; work by Gupta et al. [1] and other groups confirms that NCED3 transcripts accumulate rapidly within hours of water deficit onset and peak before the downstream stresstolerance genes reach maximum expression. The RD29A expression profile was notable for its steep induction (11.42fold overall) and for the significantly higher fold change observed in sorghum compared with soybean (12.96 vs 10.23, p<0.05). This inter-species difference is likely linked to promoter-level variation in the DRE/CRT binding sites of RD29A orthologues across the three species. Malik et al. [13] noted that species with larger DRE cis-element clusters in the RD29 promoter tend to show steeper stress-induced transcription, and sorghum's drought-adapted genome may carry such features. But correlation between promoter architecture and expression magnitude in these three species remains to be confirmed by direct sequencing. Proline accumulation, driven by P5CS up-regulation, is a wellestablished osmotic adjustment mechanism in droughtstressed plants [5,14] . The 4.1-fold increase in free proline observed here falls within the 3-6-fold range documented for moderate-to-severe drought in cereals [15] . That sorghum accumulated the most proline (82.5 µg g⁻¹ FW) among the three species, and also showed the highest P5CS fold change, strengthens the case for proline-mediated osmotic adjustment as a key component of its drought tolerance. LEA proteins, whose encoding gene (LEA4-5) was upregulated 9.18-fold, are thought to protect cellular membranes and proteins from dehydration-induced aggregation [6] ; their strong induction here parallels observations in drought-tolerant genotypes of soybean and sorghum in Brazilian field trials, though direct functional confirmation under the conditions used here would require protein-level assays beyond the scope of this research. The modest enhancement of root elongation (+12.5%) in drought-stressed plants could reflect a drought-avoidance strategy rather than drought tolerance per se, as deeper roots may access residual soil moisture [3] . This finding, combined with the earlier onset of ABA-driven stomatal closure reflected in NCED3 expression, suggests that the plants in this experiment deployed multiple overlapping defence strategies rather than relying on a single molecular or morphological response. Broader implications for tropical crop improvement lie in using the gene expression profiles documented here as baseline molecular data to screen large germplasm collections for elite tolerant lines.
Conclusion
This research aimed to characterise the expression of five drought-responsive genes in three tropical crop species under controlled water deficit conditions and to identify physiological and molecular correlates of differential drought tolerance. The results clearly met these objectives, revealing significant up-regulation of DREB2A, RD29A, P5CS, LEA4-5, and NCED3 in all species, with NCED3 showing the greatest induction (14.36-fold) and sorghum displaying the most robust molecular response across all genes. The key practical message from this research is that RT-qPCR profiling of NCED3 and RD29A expression at day 7 of drought stress can serve as an effective early molecular screening tool in breeding programmes targeting drought tolerance. Sorghum's consistent advantage across physiological and molecular metrics higher RWC retention, lower MDA accumulation, greater proline synthesis, and more pronounced gene induction confirms its suitability as a donor parent for drought-tolerance traits in crosses with soybean and maize lines adapted to the Brazilian Cerrado. From a practical standpoint, the dual ABA-dependent (NCED3-driven) and ABA-independent (DREB2A-driven) signalling identified here suggests that pyramiding tolerance mechanisms rather than targeting a single gene is likely to produce more robust drought-tolerant phenotypes in field conditions, where stress intensity and duration are variable. The physiological data further underscore the importance of proline accumulation as an osmotic buffer that can be selected for indirectly through P5CS expression screening at early vegetative stages. Future research should extend this work to field conditions in the Brazilian semi-arid northeast, where seasonal drought profiles differ from the controlled stress imposed here. Including additional stress-related gene families (heat shock proteins, aquaporins, and reactive oxygen species-scavenging enzymes) in the expression panel would give a broader picture of the molecular response network. Protein-level validation by Western blot or proteomics, and promoter-level analyses to explain interspecies differences in gene induction magnitude, are also recommended as the next steps toward a complete mechanistic understanding of drought responses in these three crop species.
Acknowledgement
Acknowledgements Funding sourcesThe authors acknowledge financial support from the Conselho Nacional de Desenvolvimento Científico e Tecnológico (CNPq) and the Fundação de Amparo à Pesquisa do Estado de São Paulo (FAPESP) through general research support programmes. No specific grant or project number was associated with this research.
Figures and tables from the paper
| Parameter | Control (mean ± SD) | Drought (mean ± SD) | Reduction (%) | p-value |
|---|---|---|---|---|
| Leaf RWC (%) | 82.4 ± 3.1 | 50.5 ± 4.7 | 38.7 | < 0.001 |
| Chlorophyll (SPAD units) | 47.3 ± 2.8 | 29.6 ± 3.5 | 37.4 | < 0.001 |
| MDA (nmol g⁻¹ FW) | 12.7 ± 1.4 | 33.2 ± 2.9 | +161 | < 0.001 |
| Proline (µg g⁻¹ FW) | 18.3 ± 2.1 | 75.3 ± 6.8 | +311 | < 0.001 |
| Stem elongation (cm) | 31.6 ± 2.6 | 21.2 ± 3.1 | 32.9 | < 0.01 |
| Root length (cm) | 24.8 ± 1.9 | 27.9 ± 2.4 | +12.5 | < 0.05 |
Table text extracted from the original PDF; superscript letters are shown inline. The original table image is below.
View original table image
References
16 in the original paper- Gupta A, Rico-Medina A, Caño-Delgado AI. The physiology of plant responses to drought. Science. 2020;368(6488):266-269.
- Silva LC, Oliveira RA, Pereira FC. Drought-responsive gene expression profiles in tropical crop varieties. Plant Stress. 2024;11:100267.
- Yoshida T, Mogami J, Yamaguchi-Shinozaki K. ABAdependent and ABA-independent signalling in response International Journal of Biology Sciences https://www.biologyjournal.net to osmotic stress in plants. Curr Opin Plant Biol. 2015;21:133-143.
- Zargar SM, Gupta N, Nazir M, et al. Impact of drought on photosynthesis: molecular perspective. Plant Gene. 2017;11:154-159.
- Priya M, Dhanker OP, Siddique KHM, et al. Drought and heat stress-related proteins: an update on their structure, function, and relevance to understanding tolerance mechanisms. J Exp Bot. 2019;70(17):44214446.
- Lamaoui M, Jemo M, Datla R, Bekkaoui F. Drought gene expression networks in cereal crops: a comparative analysis. Front Genet. 2022;13:879853.
- Anwar A, Kim JK. Transgenic breeding approaches for improving abiotic stress tolerance: recent progress and future perspectives. Int J Mol Sci. 2020;21(8):2695.
- Zandalinas SI, Mittler R, Balfagón D, et al. Plant adaptations to the combination of drought and high temperatures. Physiol Plant. 2020;162(1):2-12.
- dos Santos TB, Ribas AF, de Souza SGH, et al. Physiological responses to drought, salinity, and heat stress in plants: a review. Stresses. 2022;2(1):113-135.
- Malik S, Gupta V, Bhatt M, et al. Molecular mechanisms of drought tolerance in crop plants. J Plant Growth Regul. 2023;42(3):1823-1840.
- Costa AC, Rodrigues BM, Ferreira DS. Climate projections and crop production risk under drought scenarios for the Brazilian Cerrado, 2025-2060. Environ Res Lett. 2023;18(7):074021.
- Ye Y, Ding Y, Jiang Q, et al. The role of receptor-like protein kinases (RLKs) in abiotic stress response in plants. Plant Cell Rep. 2017;36(2):235-242.
- Sharma A, Shahzad B, Rehman A, et al. Response of phenylpropanoid pathway and the role of polyphenols in plants under abiotic stress. Molecules. 2019;24(13):2452.
- Bhatt D, Bhatt MD. Proteomic responses to drought stress in plants. Protein Pept Lett. 2017;24(5):395-403.
- Yamaguchi-Shinozaki K, Shinozaki K. Transcriptional regulatory networks in cellular responses and tolerance to dehydration and cold stresses. Annu Rev Plant Biol. 2006;57:781-803.
- Nakashima K, Ito Y, Yamaguchi-Shinozaki K. Transcriptional regulatory networks in response to abiotic stresses in Arabidopsis and grasses. Plant Physiol. 2009;149(1):88-95.