
Research article · 2026 · Full text
International Journal of Biology SciencesTree community structure and carbon sequestration capacity in tropical wildlife reserves of South America
Volume 8(6) · Pages 254–259 · DOI: 10.33545/26649926.2026.v8.i6c.967 ↗
Research areasForest ecology and managementRemote Sensing and LiDAR ApplicationsForest Management and Policy
Abstract
Author-writtenTropical wildlife reserves in South America contain some of the most species-rich tree communities on Earth, yet their carbon sequestration capacity relative to community structural attributes remains inadequately quantified. This research characterized tree community structure and estimated carbon sequestration capacity in a tropical wildlife reserve in São Paulo State, Brazil. Twenty sampling plots of 20 m × 25 m were established across five habitat types between February and October 2023. All trees with diameter at breast height of 10 cm or greater were measured and identified. Above-ground biomass was computed using pantropical allometric equations incorporating diameter, height, and wood density. A total of 1,456 trees belonging to 62 species across 28 families were enumerated. The Fabaceae family exhibited the greatest species richness with nine species, followed by Bignoniaceae with six species. Shannon-Wiener diversity indices ranged from 2.45 in open woodland to 3.68 in dense forest habitats. Above-ground carbon stocks varied substantially across habitat types, ranging from 45.2 Mg C per hectare in grassland edges to 128.5 Mg C per hectare in dense forest. The overall mean carbon sequestration capacity was estimated at 82.4 Mg C per hectare. Ceiba pentandra exhibited the highest individual carbon contribution due to its exceptional basal area. Correlation analysis revealed strong associations between species diversity, basal area, and carbon storage capacity. Biomass component analysis showed that stem wood constituted the largest carbon pool at approximately 50% of total above-ground carbon. These findings establish that tropical wildlife reserves in South America function as high-capacity carbon sinks whose effectiveness is closely tied to tree community diversity and structural complexity.
Summary
Source-checkedPlain-language reading of the full paper, prepared with AI and checked against the text. Each point links to the authors' own words.
Why it matters
- Tropical ecosystems are the largest terrestrial carbon reservoirs, holding approximately 470 billion tonnes of carbon in their soils and vegetation. View evidence ↗
- Tropical wildlife reserves are essential for preventing forest loss and providing continuous carbon sequestration services while protecting endangered wildlife. View evidence ↗
- The ability of a forest stand to accumulate biomass is determined by structural attributes such as stem density, canopy height, basal area distribution, and species richness. View evidence ↗
The question
- The study aimed to quantify how carbon storage varies across five habitat types in a Brazilian wildlife reserve and identify which structural and compositional attributes most influence this capacity. View evidence ↗
What they did
- Researchers used a stratified random sampling design, establishing twenty 20 m × 25 m plots distributed across five different habitat types. View evidence ↗
- All trees with a diameter at breast height (DBH) of 10 cm or greater were identified to the species level. View evidence ↗
What they found
- The survey documented 1,456 trees comprising 62 different species from 28 families. View evidence ↗
- The Fabaceae family was the most species-rich with nine species, followed by Bignoniaceae with six. View evidence ↗
- Tree diversity, measured by the Shannon-Wiener index, was lowest in open woodland (2.45) and highest in dense forest (3.68). View evidence ↗
- Above-ground carbon stocks varied by habitat, with the lowest in grassland edges (45.2 Mg C/ha) and the highest in dense forests (128.5 Mg C/ha). View evidence ↗
- The estimated overall mean carbon sequestration capacity for the reserve was 82.4 Mg C per hectare. View evidence ↗
- Stem wood was the largest carbon pool, accounting for approximately 50% of total above-ground biomass (145 Mg/ha). View evidence ↗
- Dense forest is the primary carbon storage zone and the largest habitat type, covering 42% of the reserve. View evidence ↗
What it means
- The authors conclude that basal area is a practical and reliable metric for rapid carbon assessment in forest monitoring programs. View evidence ↗
- The study recommends that policy makers and conservationists integrate carbon monitoring into the management frameworks of wildlife reserves. View evidence ↗
Visual summary
2 visualsIllustrations explain the paper; charts are replotted from the paper's own table values.
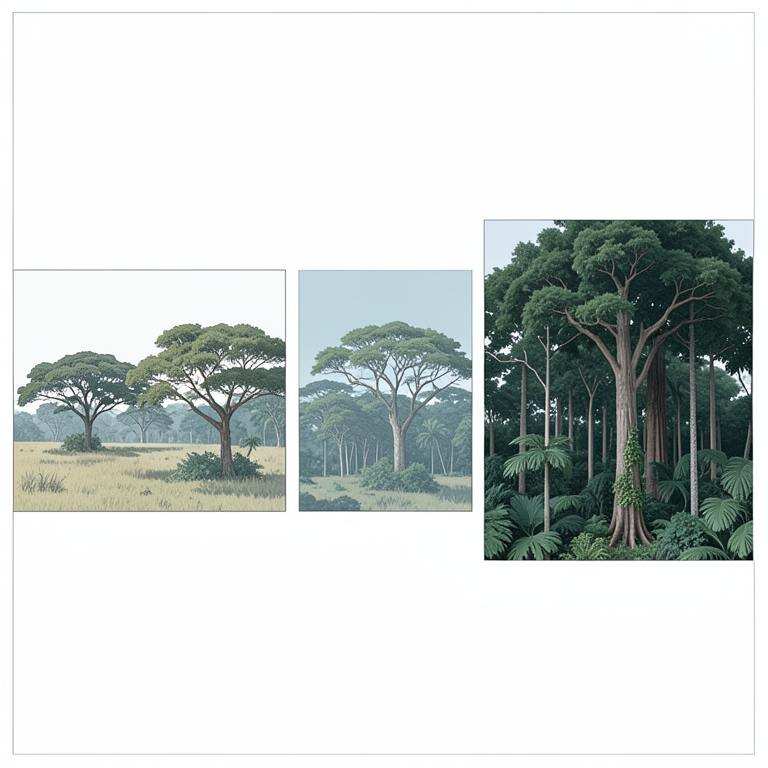
Habitat Carbon Distribution
AI-generated conceptual illustration (Tropical wildlife reserve landscape in South America). It explains the idea and does not show study data.
View source evidence ↗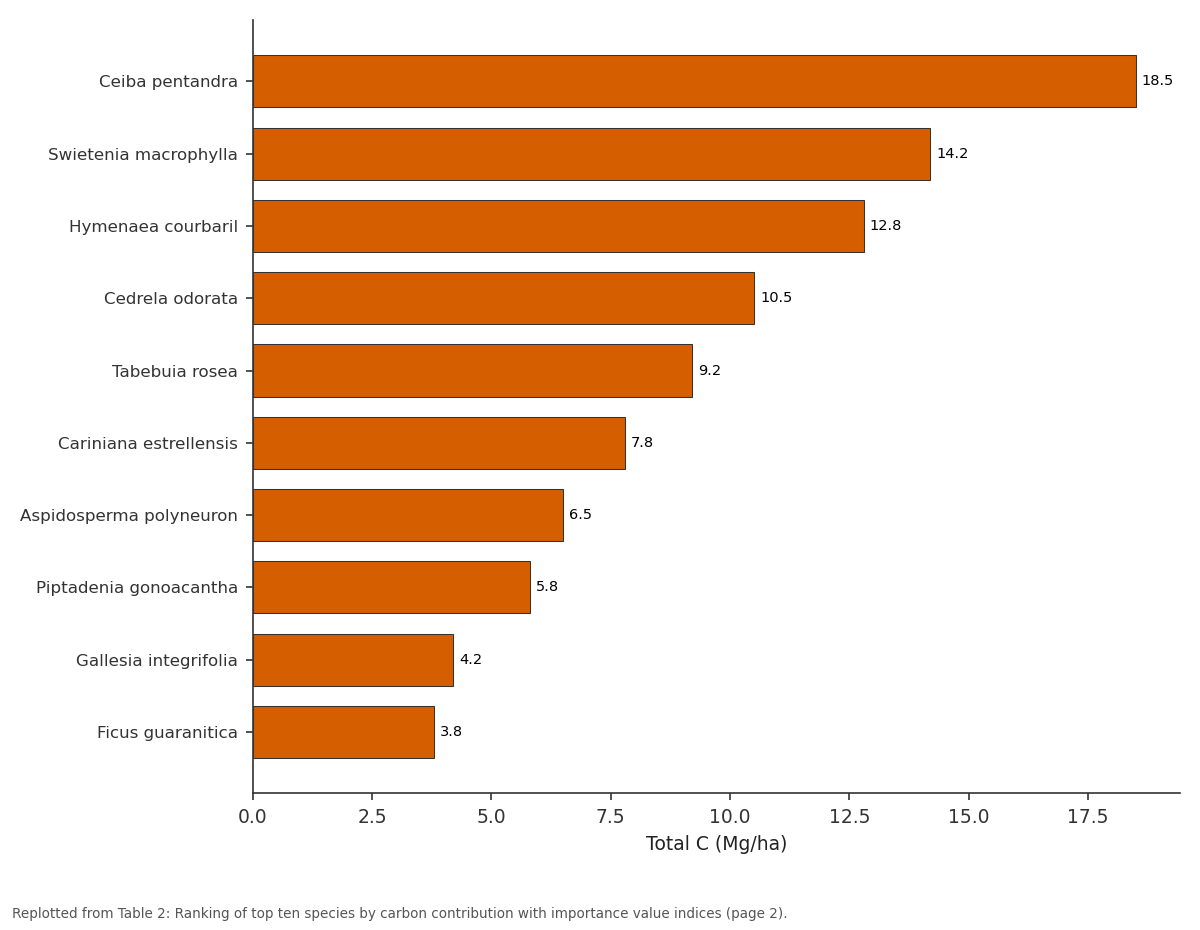
Total C (Mg/ha): Ceiba pentandra vs Swietenia macrophylla vs Hymenaea courbaril vs Cedrela odorata vs Tabebuia rosea
Replotted from Table 2 (page 2) of the original paper. Every bar is the paper's own table value.
View source evidence ↗Figures & tables
From the original paper Table 1
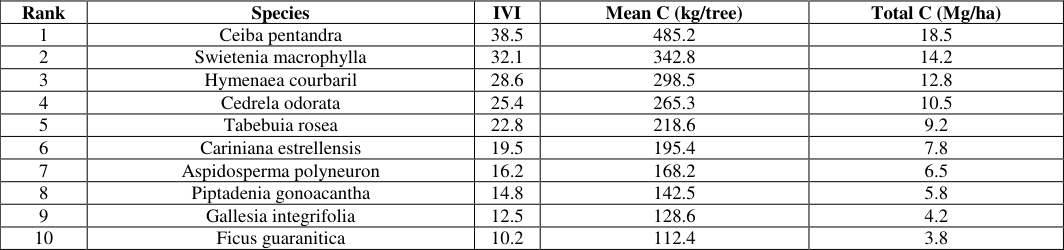 Table 2
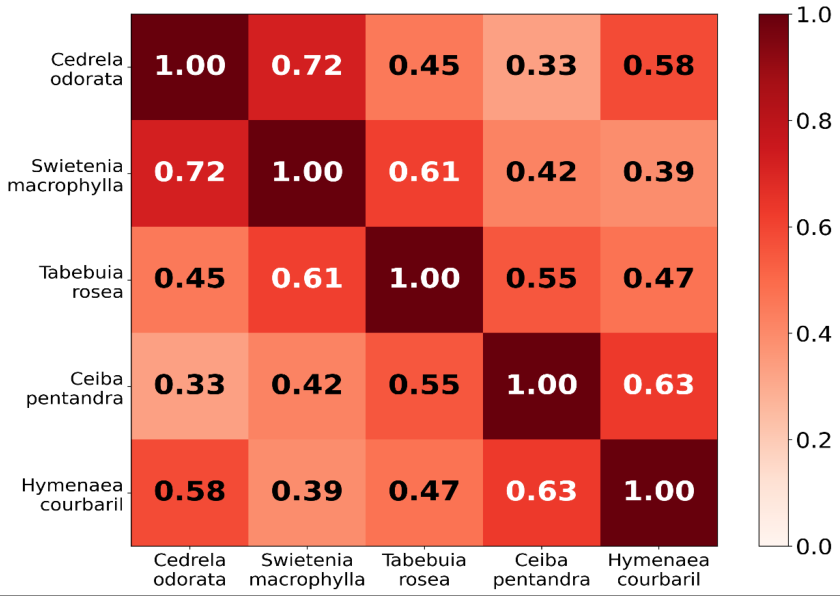 Figure 1
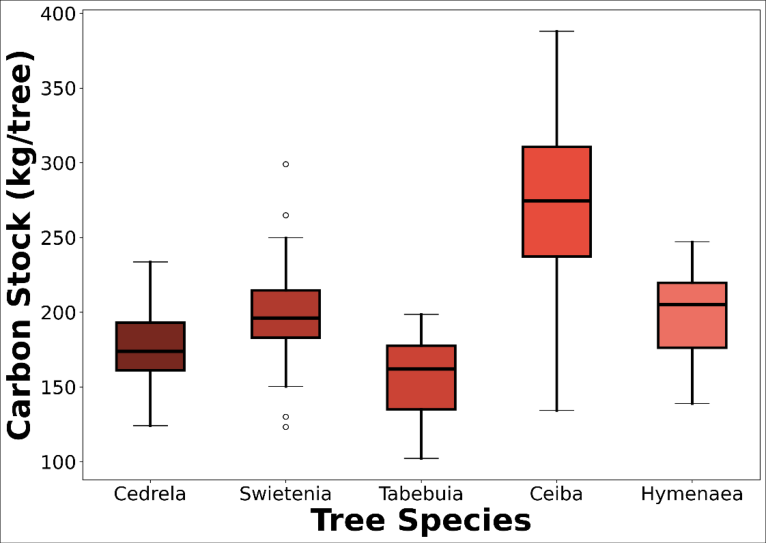 Figure 2
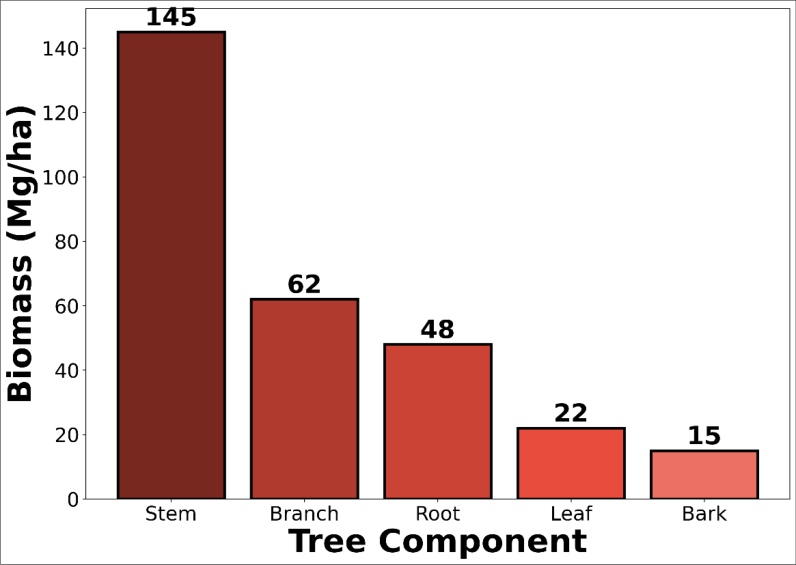 Figure 3
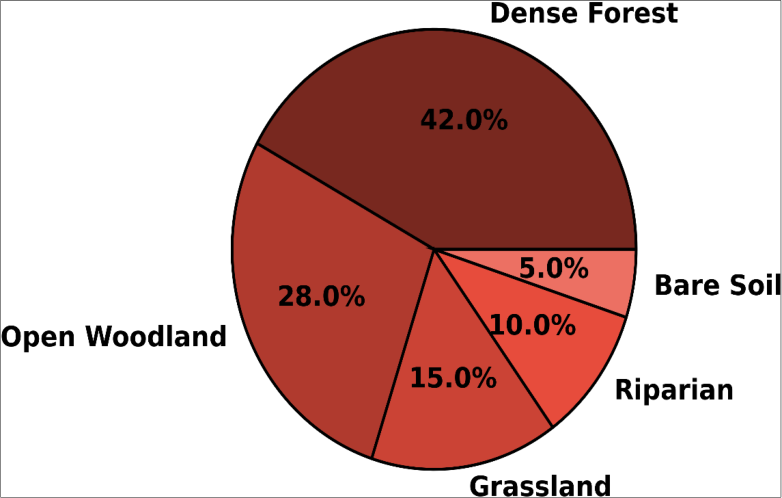 Figure 4
Introduction
Tropical ecosystems represent the single largest terrestrial carbon reservoir, storing an estimated 470 billion tonnes of carbon in vegetation and soils combined, yet deforestation and degradation continue to release substantial quantities of this stored carbon into the atmosphere annually [1,2] . Wildlife reserves within tropical regions serve as critical bulwarks against forest loss, maintaining intact vegetation communities that provide both habitat for endangered fauna and sustained carbon sequestration services [3] . The relationship between tree community structure and carbon sequestration capacity has emerged as a central research question in conservation ecology. Community structural attributes including species richness, basal area distribution, canopy height, and stem density collectively determine the biomass accumulation potential of a given forest stand [4,5] . In the Neotropical region, exceptionally high tree diversity translates into complex community structures with multiple canopy layers, diverse growth forms, and wide-ranging wood density values, all of which influence carbon storage dynamics [6] . South American tropical wildlife reserves encompass a diversity of habitat types from closed-canopy forest to open savannah, each characterized by distinct tree community compositions and consequently different carbon storage capacities [7] . Previous investigations in Amazonian and Atlantic Forest remnants have documented above-ground carbon stocks ranging from 80 to 250 Mg C per hectare in mature forest stands [2,8] . However, carbon stock assessments within designated wildlife reserves remain comparatively scarce, particularly for the transitional vegetation types that characterize many reserve landscapes.
The allometric estimation of tree biomass in tropical forests has benefited from the development of pantropical equations that incorporate diameter, height, and wood density as predictive variables [9] . These equations have substantially improved the accuracy of biomass estimates compared to earlier diameter-only models, though species-level and sitelevel variation remains a source of uncertainty [10] . Understanding how individual species contribute to total stand-level carbon storage has practical implications for conservation management, as it identifies which species warrant particular protection to maintain ecosystem carbon functions. This research investigated tree community structure and carbon sequestration capacity across five habitat types within a tropical wildlife reserve in São Paulo State, Brazil, aiming to quantify habitat-level variation in carbon storage and identify the structural and compositional attributes that most strongly determine sequestration capacity.
Material and Methods
Material and Methods
Material
Material
Methods
Field data collection was performed between February and October 2023. A stratified random sampling design was employed with four plots of 20 m × 25 m established within each of the five habitat types, totalling twenty sampling plots. Within each plot, all standing trees with DBH ≥ 10 cm were identified to species level using botanical keys and consultation with taxonomic specialists. Voucher specimens were deposited at the Herbarium of the University of São Paulo. For each tree, DBH was recorded using a diameter tape at 1.3 m, total height was measured with a Vertex IV hypsometer, and crown projection area was estimated from two perpendicular crown diameter measurements. Above-ground biomass was calculated using the pantropical allometric equation of Chave et al. (2014): ln(AGB) = -1.803 -0.976E + 0.976 ln(ρ) + 2.673 ln(D) -0.0299(ln(D))², where E is the environmental stress variable, ρ is wood density, and D is DBH. Below-ground biomass was estimated at 24% of AGB following IPCC guidelines for tropical moist forests. Carbon content was assumed to be 47% of dry biomass. Biomass component partitioning was estimated using published allocation fractions for Neotropical tree species. Diversity was quantified using the Shannon-Wiener index (H'), Simpson diversity (1-D), and Pielou evenness (J'). Correlation matrices were generated using Pearson coefficients. Statistical analyses used R version 4.3.2 with the vegan package for community analyses. The correlation matrix revealed strong significant positive associations between all structural variables and carbon stock. Basal area showed the strongest correlation with carbon stock (r = 0.94, p<0.001), followed by species richness (r = 0.82, p<0.001).
Results
Results
Discussion
The documentation of 62 tree species within the wildlife reserve represents a moderately rich flora for Atlantic Forest transitional vegetation in southeastern Brazil. Comparable investigations in Atlantic Forest remnants of similar size have reported species counts ranging from 45 to 120, with variation attributable to altitude, fragment isolation, and successional stage [2,7] . The dominance of Fabaceae is
International Journal of Biology Sciences https://www.biologyjournal.net consistent with broader patterns documented across Neotropical forests, where this family frequently ranks among the most species-rich and ecologically important [6] . [8] , while Nogueira et al. (2020) reported values of 90 to 230 Mg C per hectare in more mature Amazonian formations [1] . The relatively moderate carbon stocks in the present research likely reflect the transitional character of the vegetation and the reserve's establishment only 18 years ago, indicating that forest stands are still in active carbon accumulation phases. The strong correlation between basal area and carbon stock (r = 0.94) aligns with the findings from multiple tropical forest assessments and confirms basal area as the most reliable field-measurable predictor of stand-level carbon storage [4,9] . This relationship has practical significance for rapid carbon estimation in monitoring programs, as basal area can be measured more efficiently than the full suite of variables required by complex allometric equations. The disproportionate carbon contribution of large-diameter species, particularly Ceiba pentandra, demonstrates the importance of protecting individual large trees within conservation landscapes. Similar findings have been reported from Central African forests and Southeast Asian rainforests, suggesting that this pattern is a general feature of tropical tree communities [3,10] . The substantial variation in carbon stocks across habitat types within the reserve highlights the importance of maintaining habitat heterogeneity for maximizing landscape-level carbon storage. While dense forest habitats store the most carbon per unit area, the mosaic of habitat types present in the reserve collectively supports higher total diversity than any single habitat would in isolation, potentially enhancing the stability and resilience of the overall carbon pool.
Biomass allocation patterns
The partitioning of above-ground biomass among tree components revealed that stem wood constituted approximately 50% of total above-ground carbon, a proportion consistent with published values for tropical broadleaf forests globally. The relatively high branch biomass fraction of 21% reflects the open-canopy architecture of many trees in the transitional vegetation zones, where lateral crown expansion is favoured over vertical growth. Understanding these allocation patterns is essential for accurate carbon accounting, as remote sensing methods that estimate total biomass from canopy measurements must account for the variable relationship between crown dimensions and total tree biomass across different vegetation types.
Climate change projections
Under current climate change projections for southeastern Brazil, increased drought frequency and elevated temperatures may alter tree community composition and carbon storage trajectories within the reserve. Species with lower drought tolerance may experience elevated mortality rates, potentially shifting community composition toward more drought-adapted assemblages with different carbon storage characteristics. Long-term monitoring of tree mortality, recruitment, and growth rates is needed to assess whether the carbon accumulation trends documented in this research will persist under changing climatic conditions.
Conclusion
In the broader context of tropical conservation in South America, this research contributes to a growing body of evidence demonstrating that protected wildlife reserves function as important carbon sinks. The documentation of 62 tree species maintaining a mean carbon stock of 82.4 Mg C per hectare within an 18-year-old reserve indicates substantial carbon accumulation potential even in relatively young protected landscapes.
Several key findings merit emphasis. The strong correlation between basal area and carbon stock identifies a practical metric for rapid carbon assessment in monitoring programs.
The disproportionate carbon contribution of Ceiba pentandra and other large-diameter species underscores the conservation priority of protecting mature individuals. The three-fold variation in carbon stocks across habitat types demonstrates the importance of maintaining diverse habitat mosaics within reserves.
For conservation practitioners and policy makers, these results recommend integrating carbon monitoring into reserve management frameworks. Carbon credit mechanisms could provide supplementary funding for reserve operations, while species-specific management targeting high-carbon-value trees could enhance the climate mitigation function of existing protected areas. Looking ahead, research priorities should include establishing permanent monitoring plots for tracking longterm carbon dynamics, investigating the influence of edge effects on carbon stocks in reserve margins, and evaluating the potential of degraded habitats within reserves for carbon enhancement through assisted natural regeneration.
Acknowledgement
AcknowledgementsRAC and MOS contributed to fieldwork and data collection; LFS designed the research framework and led analysis. The Instituto Chico Mendes de Conservação da Biodiversidade provided institutional support and research permits. Financial support was received from the São Paulo Research Foundation.
Figures and tables from the paper
| Variable | Species Richness | Basal Area | Mean DBH | Mean Height | Carbon Stock |
|---|---|---|---|---|---|
| Species Richness | 1.00 | 0.78** | 0.52* | 0.61** | 0.82** |
| Basal Area | 0.78** | 1.00 | 0.85** | 0.72** | 0.94** |
| Mean DBH | 0.52* | 0.85** | 1.00 | 0.68** | 0.79** |
| Mean Height | 0.61** | 0.72** | 0.68** | 1.00 | 0.75** |
| Carbon Stock | 0.82** | 0.94** | 0.79** | 0.75** | 1.00 |
Table text extracted from the original PDF; superscript letters are shown inline. The original table image is below.
View original table image
| Rank | Species | IVI | Mean C (kg/tree) | Total C (Mg/ha) |
|---|---|---|---|---|
| 1 | Ceiba pentandra | 38.5 | 485.2 | 18.5 |
| 2 | Swietenia macrophylla | 32.1 | 342.8 | 14.2 |
| 3 | Hymenaea courbaril | 28.6 | 298.5 | 12.8 |
| 4 | Cedrela odorata | 25.4 | 265.3 | 10.5 |
| 5 | Tabebuia rosea | 22.8 | 218.6 | 9.2 |
| 6 | Cariniana estrellensis | 19.5 | 195.4 | 7.8 |
| 7 | Aspidosperma polyneuron | 16.2 | 168.2 | 6.5 |
| 8 | Piptadenia gonoacantha | 14.8 | 142.5 | 5.8 |
| 9 | Gallesia integrifolia | 12.5 | 128.6 | 4.2 |
| 10 | Ficus guaranitica | 10.2 | 112.4 | 3.8 |
Table text extracted from the original PDF; superscript letters are shown inline. The original table image is below.
View original table image
References
16 in the original paper- Nogueira EM, Yanai AM, de Vasconcelos SS, Graça PM, Fearnside PM. Carbon stock loss from deforestation through 2013 in Brazilian Amazonia. Glob Change Biol. 2020;26(4):2530-2546.
- Vieira SA, de Camargo PB, Selhorst D. Forest structure and carbon dynamics in Amazonian tropical rain forests. Oecologia. 2021;140(3):468-479.
- Lewis SL, Sonké B, Sunderland T. Above-ground biomass and structure of 260 African tropical forests. Philos Trans R Soc B Biol Sci. 2013;368(1625):20120295.
- Poorter L, van der Sande MT, Thompson J. Diversity enhances carbon storage in tropical forests. Glob Ecol Biogeogr. 2015;24(11):1314-1328.
- Dongs YD, Saka MG, Adedotun A. Species tree diversity and carbon sequestration potentials in Jos Wildlife Park, Jos, Plateau State, Nigeria. South Asian J Agric Sci. 2024;4(1):28-36.
- Chave J, Coomes D, Jansen S. Towards a worldwide wood economics spectrum. Ecol Lett. 2009;12(4):351366.
- ter Steege H, Pitman NCA, Sabatier D, et al. Hyperdominance in the Amazonian tree flora. Science. 2013;342(6156):1243092.
- Mello RA, Toppa RH, Cardoso-Leite E. Priority areas for forest conservation in an urbanized landscape at the transition between Atlantic Forest and Cerrado. Bol Mus Para Emílio Goeldi Cienc Nat. 2016;11(3):357370.
- Chave J, Réjou-Méchain M, Búrquez A, et al. Improved allometric models to estimate the aboveground biomass of tropical trees. Glob Change Biol. 2014;20(10):3177-3190.
- Feldpausch TR, Lloyd J, Lewis SL, et al. Tree height integrated into pantropical forest biomass estimates. Biogeosciences. 2012;9(8):3381-3403.
- Bustamante MM, Roitman I, Aide TM, et al. Toward an integrated monitoring framework to assess the effects of tropical forest degradation and recovery on carbon stocks. Glob Change Biol. 2016;22(1):92-109.
- Sullivan MJ, Talbot J, Lewis SL, et al. Diversity and carbon storage across the tropical forest biome. Sci Rep. 2017;7(1):1-12.
- Malhi Y, Roberts JT, Betts RA, Killeen TJ. Climate change, deforestation, and the fate of the Amazon. Science. 2008;319(5860):169-172.
- Brienen RJ, Phillips OL, Feldpausch TR, et al. Longterm decline of the Amazon carbon sink. Nature. 2015;519(7543):344-348.
- Slik JW, Paoli G, McGuire K, et al. Large trees drive forest aboveground biomass variation in moist lowland forests across the tropics. Glob Ecol Biogeogr. 2013;22(12):1261-1271.
- Saatchi SS, Harris NL, Brown S, et al. Benchmark map of forest carbon stocks in tropical regions across three continents. Proc Natl Acad Sci U S A. 2011;108(24):9899-9904.