
Research article · 2026 · Full text
International Journal of Geography Geology and EnvironmentTrend analysis of temperature and rainfall variability in Ukhrul district, Manipur (1990-2024)
Volume 8(7) · Pages 234–242 · DOI: 10.22271/27067483.2026.v8.i7c.835 ↗
Research areasClimate variability and modelsClimate change impacts on agricultureHydrology and Drought Analysis
Abstract
Author-writtenClimate variability poses a range of problems for agriculture, water resources, and rural livelihoods. It is Mainly challenging for regions that are sensitive to climate change like Northeast India. To understand the trends in temperature and rainfall in Ukhrul District, Manipur from 1990 to 2024, this paper employed long-term climate data mainly from NASA POWER, which was then cross-checked with the records of the Indian Meteorological Department (IMD). The Mann-Kendall trend test and Sen's slope estimator were used for seasonal and annual trend analyses, whereas the impact of rainfall anomalies on changes was assessed through the Climate Variability Index (CVI). Results showed a notable rise in minimum temperature (Sen's slope = 0.019C per year, p = 0.002), implying gradual night-time warming, though mean annual temperature remained unchanged while maximum temperature was slightly decreasing but not Quite a bit. Four seasons and annual rainfall all showed significant increasing trends except for pre-monsoon rainfall, which declined Much - Monsoon season contributed 59.5% of total annual rainfall So strengthening the dependency of the district's agriculture, mainly rain-fed, on it.CV I severity ranking identified late 1990s and early 2000s drought episodes, Mostly 2000 and 2001, whereas quite a few years post 2010 witnessed very wet or extremely wet scenarios reflecting increasing hydro-climatic variability. Through a survey of 542 farmers, accounts of irregular rainfall, late coming of monsoon, decreased crop yields, and more frequent extreme weather events were recorded. Among the adaptation methods taken by farmers were changing planting dates, rainwater harvesting, and mixed cropping. The authors came to a decision that the climate of Ukhrul district is becoming more variable at nighttime with the temperature rising and changing rainfall patterns, Because of this the district should be prepared for climate change through introduction of agricultural practices that can withstand droughts, conserving water and planning with a view to adapting to help communities become more resilient locally.
Summary
Source-checkedPlain-language reading of the full paper, prepared with AI and checked against the text. Each point links to the authors' own words.
Why it matters
- Climate variability creates significant challenges for water resources, rural livelihoods, and agriculture, particularly in climate-sensitive regions like Northeast India. View evidence ↗
- Ukhrul District in Manipur is highly vulnerable to environmental stress and climate change because its economy is primarily based on rain-fed agriculture. View evidence ↗
- While regional climate change in Northeast India is discussed, there is a lack of detailed, long-term studies focused specifically at the district level. View evidence ↗
The question
- The study aims to analyze annual and seasonal temperature and rainfall changes, identify weather extremes, and evaluate the resulting effects on rural livelihoods and agriculture in Ukhrul District. View evidence ↗
What they did
- The researchers used long-term climate data from 1990 to 2024 sourced from the NASA POWER database and cross-checked with Indian Meteorological Department (IMD) records. View evidence ↗
- Long-term trends in precipitation and temperature were analyzed using the non-parametric Mann-Kendall trend test and Sen's slope estimator. View evidence ↗
- The Climate Variability Index (CVI) was used to identify and compare dry and wet periods across different seasons and years. View evidence ↗
- A survey of 542 farmers was conducted to record perceptions of crop yields, monsoon timing, rainfall regularity, and extreme weather events. View evidence ↗
What they found
- Minimum temperatures showed a statistically significant increase of approximately 0.019°C per year. View evidence ↗
- There was no statistically significant trend in the mean annual temperature over the study period. View evidence ↗
- Annual rainfall increased significantly by an average of 23.84 mm per year between 1990 and 2024. View evidence ↗
- While monsoon, winter, and post-monsoon rainfall increased, pre-monsoon rainfall decreased significantly by 4.44 mm per year. View evidence ↗
- The years 2013 and 2018 were identified as extremely wet, with 2018 recording the highest rainfall (1894.10 mm), which was 57% above the long-term average. View evidence ↗
- The years 2000 and 2001 were classified as extreme drought years, with 2001 being the driest year recorded (534.24 mm). View evidence ↗
- Farmer perceptions align with data, with 83.5% reporting irregular rainfall patterns and 80.3% noting delayed or altered monsoon onset. View evidence ↗
- The most common adaptation strategy used by farmers to cope with climate variability was changing sowing dates, adopted by 84.1% of respondents. View evidence ↗
What it means
- The authors conclude that to increase resilience, the district must implement climate-resilient agricultural practices, improve water conservation, and integrate adaptation into local development planning. View evidence ↗
Visual summary
3 visualsIllustrations explain the paper; charts are replotted from the paper's own table values.
Climate Shift Summary
AI-generated conceptual illustration (The mountainous landscape of Ukhrul district, Manipur). It explains the idea and does not show study data.
View source evidence ↗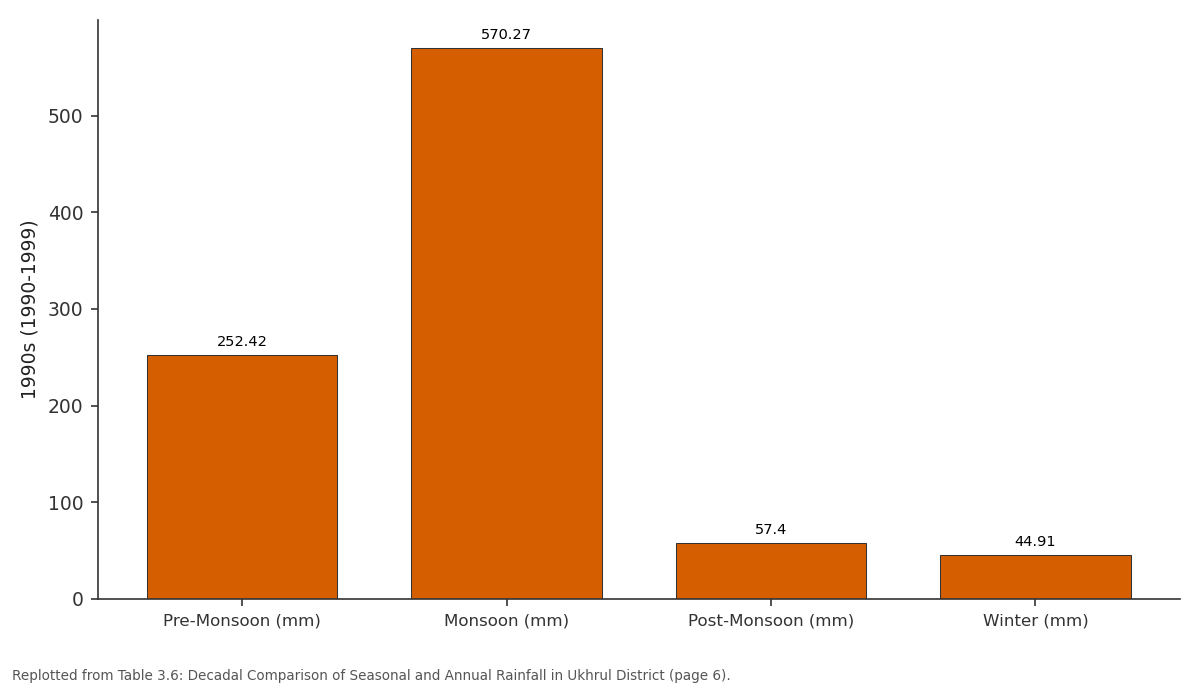
1990s (1990-1999): Pre-Monsoon (mm) vs Monsoon (mm) vs Post-Monsoon (mm) vs Winter (mm)
Replotted from Table 3 (page 6) of the original paper. Every bar is the paper's own table value.
View source evidence ↗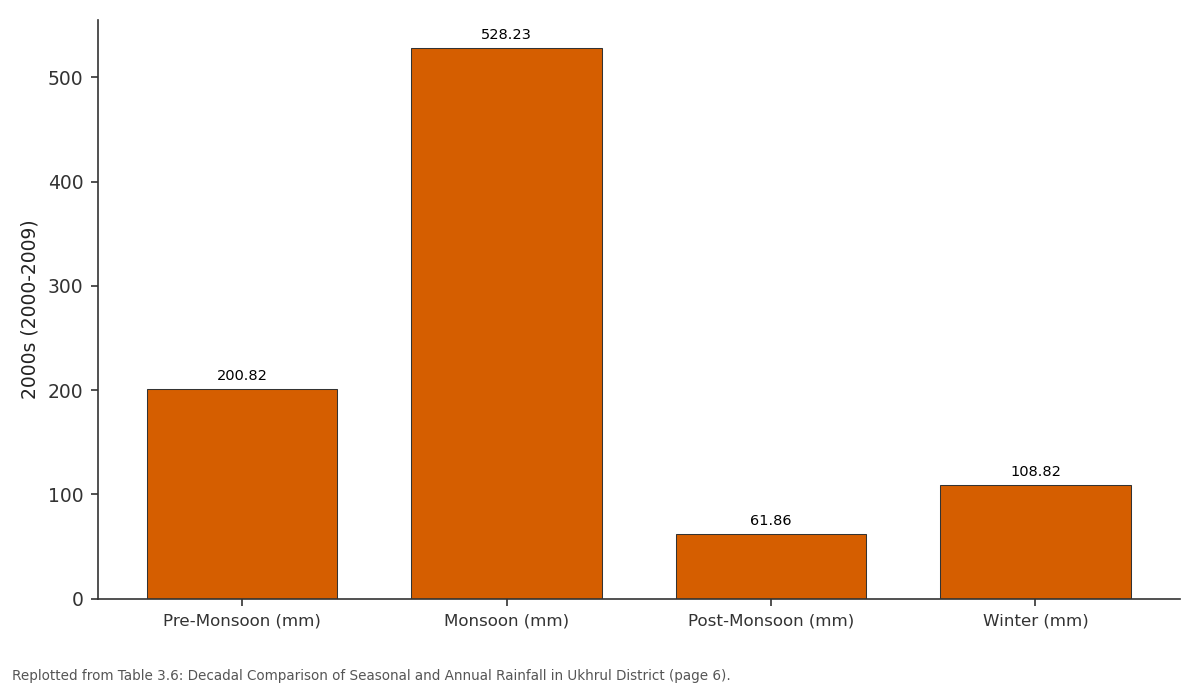
2000s (2000-2009): Pre-Monsoon (mm) vs Monsoon (mm) vs Post-Monsoon (mm) vs Winter (mm)
Replotted from Table 3 (page 6) of the original paper. Every bar is the paper's own table value.
View source evidence ↗Figures & tables
From the original paper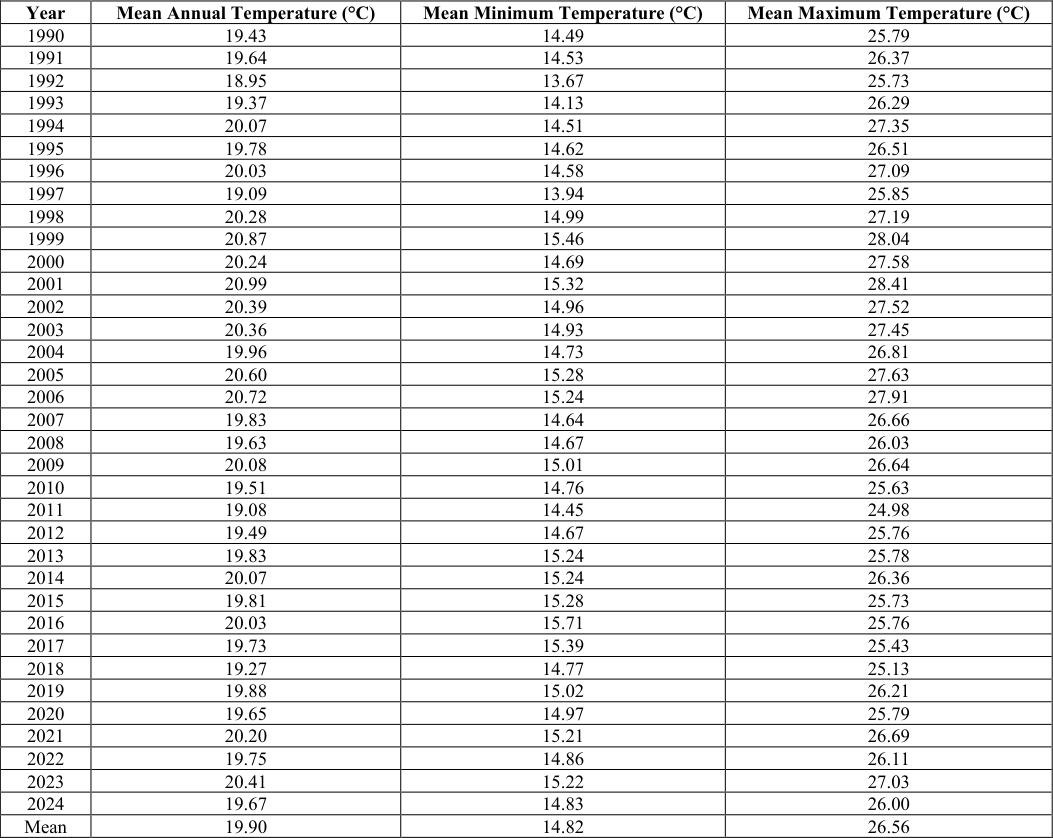 Table 3
 Table 3
 Table 3
 Table 3
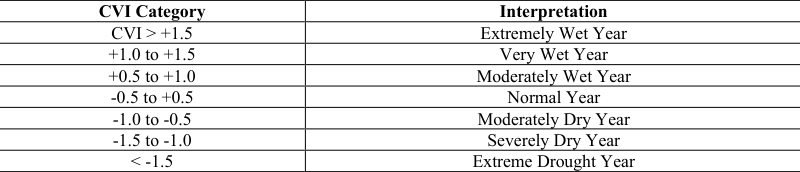 Table 3
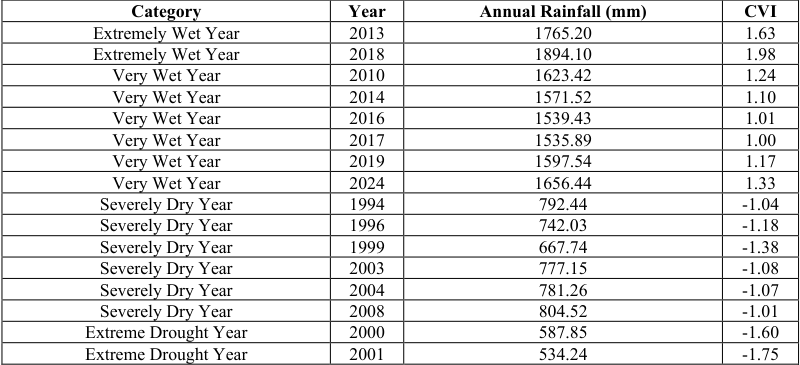 Table 3
 Table 3
 Table 4
 Table 3
 Table 3
Introduction
Climate variability and climate change are considered by experts as the major environmental threats of this century. They are causing changes in the natural environment, depletion of water resources, reducing the yield of crops, and impacting the lives of people all over the world (IPCC, 2023). Changing temperature and rainfall patterns impact the water cycle, soil moisture, plant growth, and the variety of living organisms, Because of this changing the operation of socio-ecological systems (Field et al. 2014;Trenberth et al. 2015). Also, extreme weather events such as droughts floods heat waves, and erratic rainfall patterns are increasing in frequency and intensity, and this is causing more concern about food security and the goal of sustainable development (Alexander et al. 2006;Dore, 2005; FAO, 2021). India's climate has been changing Really over the last few decades, as evidenced by increasing temperatures, alteration in monsoon patterns and more frequent climate extremes (Krishnan et al. 2020). The Indian summer monsoon is the single source of 7580% of the country's total annual rainfall and is a lifeline for agriculture, water resources and rural livelihoods (Goswami et al. 2006). Many researchers have found that monsoon rainfall has varied Quite a bit in space and time, creating a situation of unpredictability for agricultural production and resource management (Roxy et al. 2015;Guhathakurta et al. 2020). Not only that, but higher temperatures and the changing rain patterns are increasing risks of insufficient water and lower crop yields throughout India (Kumar et al. 2004;Lal, 2001) [1, 2, 3, 13, 14, 4, 5, 6, 7, 8, 15] .
Due to its varied geographical features, rich ecosystems, and high dependence on monsoon rainfall, Northeast India is among the most climate sensitive areas of the country (Das et al. 2009). It is located in the Eastern Himalayan and Indo-Myanmar biodiversity hotspots and the temperature and rainfall change a lot with elevation and among landscapes (Sharma et al. 2016). Temperature increase, rainfall pattern changes, and more extreme weather events have all been confirmed by several studies in this region (Jain et al. 2013; Krishnan et al. 2020). The effects of these climatic variations on agriculture, water resources, conservation of biodiversity, and food security are profound (Das et al. 2009; Sharma et al. 2016). Manipur, among the northeastern states of India, has been identified as one of the most vulnerable states to climate change with its mountainous terrain, fragile ecosystem and agriculture as the main source of livelihood (Government of Manipur, 2013). Rainfall changes, late monsoons, prolonged droughts and rising temperatures, among other climate factors, have affected crop yields and water availability in the entire Northeast India region (Jain et al. 2013;Guhathakurta et al. 2020; Krishnan et al. 2020). Ukhrul District situated in the east of Manipur is famous for its difficult hilly terrain, diversity of flora and fauna and economy based mostly on agriculture. Being highly agriculture dependent on rainfall, the people in this area are very vulnerable to climate change and environmental stress (Government of Manipur, 2013). Though climate change impacts on Northeast India are being increasingly discussed, there are few detailed studies at the district level about the long-term temperature and rainfall changes. Most research work has been done on a larger regional level, So ignoring local climate factors which directly affect agriculture and livelihoods of different communities (Jain et al. 2013;Guhathakurta et al. 2020). Besides that, a thorough knowledge of past patterns of temperature and rainfall is crucial to come up with suitable measures to tackle climate change and enhance resilience of the farming communities. Because of this, the objectives of this paper are to: (i) analyze yearly and seasonal temperature changes, (ii) check rainfall fluctuations and weather extremes and (iii) discuss climate variability effects on agriculture and rural livelihoods of Ukhrul District [16, 9, 10, 11, 5, 9, 10, 11, 12, 8] .
Materials and Methods
Study Area: Manipur's Ukhrul District, an area at the India-Myanmar border in the northeast of India, was where the investigation was carried out. The district is framed by 2430'N and 2541'N latitude and 9403'E and 9447'E longitude. Covering about 4,544 km, Ukhrul is mainly a mountainous area characterized by steep slopes and a range of heights from roughly 900 m to more than 3000 m above sea level. The district is also a part of the Indo-Myanmar biological hotspot and is home to diverse flora and fauna (Government of Manipur, 2013) [12] . The district's climate is a humid subtropical type with four distinct seasons: winter, pre-monsoon, monsoon, and post-monsoon. During June to September, most of the annual precipitation is from the southwest monsoon and since farming is mainly by irrigation from rain, it is very much dependent on the climate. The major products of the district are rice maize pulses, and vegetables. Because of the reliance of the people on agriculture, the district is very prone to changes and irregularities in the weather.
Climate Data Sources
Long-term climatic data for the period 1990-2024 were obtained from the National Aeronautics and Space Administration (NASA) POWER database, which provides meteorological and climatological variables derived from satellite observations, assimilation systems, and global climate datasets (Sparks, 2018). Because of its data quality and extensive spatial coverage, NASA's POWER dataset became the main one for climate variability and agricultural studies in areas that are lacking in climatic data. Temperature and rainfall data from India Meteorological Department (IMD) have been used to improve data robustness and facilitate cross-checking. To trend analysis, monthly temperature and rainfall data have been aggregated at annual and seasonal level. Seasonal divisions were following Indian Meteorological Department's standard: winter (December to February), pre-monsoon (March to May), southwest monsoon (June to September), and postmonsoon (October to November). Trend Analysis
Trend Analysis
Non-parametric MannKendall (MK) trend test and Sen's slope estimator were employed to investigate the long-term trends of temperature and precipitation. Since the distribution of hydro-climatic data is not always normal and these data may contain outliers, the chosen methods are popular because of the first one being the least affected with outliers and the second one being robust against the normality assumption (Mann, 1945;Kendall, 1975;Sen, 1968). MannKendall test is used to figure out whether there is a rising or falling trend in a climate variable that is significant statistically. The test statistic (S) is the result of a series of comparisons between each data point and the points that follow it. An increasing trend is indicated by a positive value of the standardized Z, while a negative value points to a decreasing trend. Statistical significance was determined using the 95% confidence level (p<0.05). To determine the strength of the trends detected, Sen's slope estimator was brought into play. All of pairwise slopes between observations are considered by Sen's method and it is the median of these slopes that is taken as the definitive result and this is how the rate of change over time, is robustly estimated (Sen, 1968). If trend values are positive, it means the trend is increasing, a negative value means it is the other way around. Beside the study of trend, we calculated the summary statistics like average, minimum and maximum values for characterizing climate variations. To recognize the wet and dry periods and for comparing climatic variability of different years and seasons, the use of Climate Variability Index (CVI) was also extended in this case to evaluate seasonal and annual rainfall variability. Microsoft Excel and SPSS were used in carrying out all the statistical work. The main outputs obtained after the statistical exercise were further subjected to assessment in relation with the agricultural production, water resource availability, and livelihood sustainability in the Ukhrul District. The results agree with both regional and worldwide reports that emphasize temperature rise as a very prominent sign of climate change in the mountains (IPCC, 2023; Krishnan et al. 2020) [1, 5] . The observed climate changes necessitate the introduction of climate-resilient agricultural practices and adaptive management strategies to reduce the vulnerability of the local population and natural systems to the potential impacts of climate change.
Results and Discussion
Results and Discussion
Trends in Temperature
Trends in Temperature
Trends in Rainfall
Annual and seasonal rainfall variability [9] also mentioned a similar point by emphasizing the role of pre-monsoon rainfall for the good establishment of crops in Northeast India.
Post-monsoon season had the least rainfall (6.6%) with a mean of 79.02 mm indicating drier atmospheric conditions after the monsoon. Rainfall differences throughout the year were present in all seasons but mainly during the winter and monsoon seasons.
Yearly rainfall ranged wildly from 534.24 mm at the low to 1894.10 mm at the high, which not only indicate a high rainfall variability but also the occurrence of dry and wet years. Drops/ increases of this magnitude are probably similar to those recorded in regional climate studies which have also revealed enhanced rainfall variability and other climate uncertainties in Northeast India following the changed climatic conditions (Krishnan et al. 2020; IPCC, 2023) [1, 5] . Other major impacts of these changes at the district level are on agriculture, water resources, and livelihood security. Extremely Wet Year +1.0 to +1. 5 Very Wet Year +0.5 to +1.0 Moderately Wet Year -0.5 to +0. 5 Normal Year -1.0 to -0.5
Extreme rainfall and drought years
Moderately Dry Year -1.5 to -1.0 Severely Dry Year < -1.5
Extreme Drought Year (2020) [1] also recorded similar cases whereby changing rainfall patterns in India due to climate change are leading to one or more extreme precipitation events and localized droughts.
Both extremes of wet and dry conditions cause significant challenges for Ukhrul District where agriculture is mostly rain-fed. Too much rain can cause flooding landslides soil erosion, and crop damage while drought can cause reduced soil moisture, decreased crop yields, and increased water scarcity. The IPCC (2023) [1] also pointed out that climate change is causing an increase in the frequency and intensity of hydrological extremes worldwide with mountain and monsoon-dependent regions being most affected. This changes have brought up several challenges of climate uncertainty in the district. It also calls for the adoption of climate-resilient agricultural practices, water conservation measures, and effective disaster risk management strategies. [5] for Northeast India. Seasonal monsoon rainfall maintained its status as the main source of annual precipitation. [1] . The Mann-Kendall trend test revealed a statistically significant rise in the annual rainfall over 1990-2024 (Z=3.820, p< 0.001), whereas Sen's slope showed an average rise of 23.84 mm/year. The seasonal breakdown showed that the pre-monsoon rainfall has gone down quite drastically (-4.44 mm/year) But monsoon, post-monsoon and winter rainfall have all shown significant uptrends.
Decadal comparison
Winter rainfall saw the biggest rise (11.75 mm/year) which could mean that the seasons of precipitation might be changing. This is not the first time such changes have been noticed as Goswami et al. and Krishnan et al. reported the growing rainfall variability and the intensification of extreme precipitation events across Northeast India due to climate change [5] .
Implications for Agriculture and Livelihoods
Perceived Impact of Climate Variability on Agriculture [1, 5] . The findings This way have crucial impacts on the issues related with agriculture, water resource, flood events and ecological implications in the district. The most popular adaptation strategy out of all those listed was changing the sowing dates, which was adopted by as many as 84.1% of the farmers who participated in the survey. That change of approach makes sense if one considers that farmers need to alter their cropping rhythms so that they correspond with the rainfalls and weather changes of the new season. Planting date changes as an adaptation measure were supported by Below et al. (2012), who stated that smallholder farmers in regions sensitive to climate changes most commonly adapt by altering the dates at which they plant crops.
Impact on Livelihoods and Adaptation
Rainwater harvesting was taken up by 65.3% of farmers, which shows the realization of the necessity to keep water saved up as a reaction to irregular rainfall and droughts. The strengthening of water conservation activities points to the farmers' attempts at ensuring the availability of water even during the periods when the crops really need it. This was in line with the research findings of Nhemachena and Hassan (2007) [19] , who discovered that water management is one of the top adaptation strategies for rain-fed agricultural systems.
Mixed cropping was practiced by 51.5% of the respondents, which contributes to the reduction of production risks through crop diversification and increase resiliency of the farm towards climate shocks. [18, 19] .
Conclusion:
The main goal of this project was to investigate the temperature and rainfall changes and fluctuations in Ukhrul District, Manipur over the time period 19902024 and to evaluate their effects on agriculture and rural livelihoods. The study signifies major climate changes like temperature rise and highly variable rainfall.
The temperature analysis revealed a near steady state of mean annual temperature but minimum temperature showed a A lot positive trend (Sen's slope = 0.019C year; p<0.05) pointing to Truth is night-time warming is increasing slowly. Maximum temperature Though showed a downward trend which was not significant leading to the idea that it is the increasing minimum temperatures that are mainly causing the warming in the district. These results corroborate with the overall climate change scenarios of Northeast India as well as other mountainous regions.
The rainfall study showed a great deal of seasonal changes and year-to-year variations in rainfall. Monsoon was the season with the highest rainfall giving about 60% of the total annual rainfall. This signifies the importance of monsoon in supporting agriculture and water resources. MannKendall test popularized the statistically rising trends in monsoon, post-monsoon, winter, and annual rainfalls, whereas pre-monsoon rainfall proved to be decreasing Quite a bit. The decade-wise result showed a shift from relative dryness in the 1990s and 2000s to much wetness in 2010s and early 2020s. The Climate Variability Index aside from that marked severe drought years during late 1990s and early 2000s and a greater number of wet and extremely wet years post 2010, which is a clear indication of growing hydro-climatic extremes. The research shows that the local rain-fed farming system is at risk because of climate variations. Based on the farmers, changes in rainfall patterns, a delay in the start of monsoon, increased incidence of extreme weather events, a fall in crop production, and higher pest infestation are the major problems. From this, farmers have been implementing a number of adaptation strategies. Mostly, they have altered their planting dates, harvested rainwater, and planted different species together. What farmers have done so far, shows that they have taken the climate-related risks seriously to continue producing agricultural products under ever-changing environmental conditions. Overall, changes in climate are becoming quite visible in Ukhrul District and the main features are, that minimum temperatures have risen, rainfall patterns have shifted, rainfall variability has grown. These changes are not only affecting agriculture, water resources and ecosystem stability but also the rural people's way of life. It will be necessary to build up agricultural practices which can stand the changing climate, to develop ways of conserving water more effectively, and to bring in climate adaptation at the level of local development planning if we want to raise the resilience of farming communities and achieve sustainable development in the district.
Figures and tables from the paper
| Year | Mean Annual Temperature (°C) | Mean Minimum Temperature (°C) | Mean Maximum Temperature (°C) |
|---|---|---|---|
| 1990 | 19.43 | 14.49 | 25.79 |
| 1991 | 19.64 | 14.53 | 26.37 |
| 1992 | 18.95 | 13.67 | 25.73 |
| 1993 | 19.37 | 14.13 | 26.29 |
| 1994 | 20.07 | 14.51 | 27.35 |
| 1995 | 19.78 | 14.62 | 26.51 |
| 1996 | 20.03 | 14.58 | 27.09 |
| 1997 | 19.09 | 13.94 | 25.85 |
| 1998 | 20.28 | 14.99 | 27.19 |
| 1999 | 20.87 | 15.46 | 28.04 |
| 2000 | 20.24 | 14.69 | 27.58 |
| 2001 | 20.99 | 15.32 | 28.41 |
| 2002 | 20.39 | 14.96 | 27.52 |
| 2003 | 20.36 | 14.93 | 27.45 |
| 2004 | 19.96 | 14.73 | 26.81 |
| 2005 | 20.60 | 15.28 | 27.63 |
| 2006 | 20.72 | 15.24 | 27.91 |
| 2007 | 19.83 | 14.64 | 26.66 |
| 2008 | 19.63 | 14.67 | 26.03 |
| 2009 | 20.08 | 15.01 | 26.64 |
| 2010 | 19.51 | 14.76 | 25.63 |
| 2011 | 19.08 | 14.45 | 24.98 |
| 2012 | 19.49 | 14.67 | 25.76 |
| 2013 | 19.83 | 15.24 | 25.78 |
| 2014 | 20.07 | 15.24 | 26.36 |
| 2015 | 19.81 | 15.28 | 25.73 |
| 2016 | 20.03 | 15.71 | 25.76 |
| 2017 | 19.73 | 15.39 | 25.43 |
| 2018 | 19.27 | 14.77 | 25.13 |
| 2019 | 19.88 | 15.02 | 26.21 |
| 2020 | 19.65 | 14.97 | 25.79 |
| 2021 | 20.20 | 15.21 | 26.69 |
| 2022 | 19.75 | 14.86 | 26.11 |
| 2023 | 20.41 | 15.22 | 27.03 |
| 2024 | 19.67 | 14.83 | 26.00 |
| Mean | 19.90 | 14.82 | 26.56 |
Table text extracted from the original PDF; superscript letters are shown inline. The original table image is below.
View original table image
| Variable | Kendall's Tau | Z-value | p-value | Sen's Slope (°C year⁻¹) | Trend |
|---|---|---|---|---|---|
| Mean Annual Temperature | 0.000 | 0.000 | 1.000 | 0.000 | No significant trend |
| Mean Minimum Temperature | 0.363 | 3.053 | 0.002 | +0.019 | Significant increasing trend |
| Mean Maximum Temperature | -0.208 | -1.747 | 0.081 | -0.030 | Non-significant decreasing trend |
Table text extracted from the original PDF; superscript letters are shown inline. The original table image is below.
View original table image
| Season | Mean Rainfall (mm) | Contribution (%) | Minimum (mm) | Maximum (mm) |
|---|---|---|---|---|
| Pre-Monsoon | 186.93 | 15.5 | 62.35 | 418.55 |
| Monsoon | 716.11 | 59.5 | 264.41 | 1184.76 |
| Post-Monsoon | 79.02 | 6.6 | 5.72 | 182.13 |
| Winter | 225.52 | 18.7 | 0.00 | 513.61 |
| Annual | 1207.58 | 100.0 | 534.24 | 1894.10 |
Table text extracted from the original PDF; superscript letters are shown inline. The original table image is below.
View original table image
| Rank | Driest Years | Rainfall (mm) | Wettest Years | Rainfall (mm) |
|---|---|---|---|---|
| 1 | 2001 | 534.24 | 2018 | 1894.10 |
| 2 | 2000 | 587.85 | 2013 | 1765.20 |
| 3 | 1999 | 667.74 | 2024 | 1656.44 |
| 4 | 1996 | 742.03 | 2010 | 1623.42 |
| 5 | 2003 | 777.15 | 2019 | 1597.54 |
Table text extracted from the original PDF; superscript letters are shown inline. The original table image is below.
View original table image
| CVI Category | Interpretation |
|---|---|
| CVI > +1.5 | Extremely Wet Year |
| +1.0 to +1.5 | Very Wet Year |
| +0.5 to +1.0 | Moderately Wet Year |
| -0.5 to +0.5 | Normal Year |
| -1.0 to -0.5 | Moderately Dry Year |
| -1.5 to -1.0 | Severely Dry Year |
| < -1.5 | Extreme Drought Year |
Table text extracted from the original PDF; superscript letters are shown inline. The original table image is below.
View original table image
| Category | Year | Annual Rainfall (mm) | CVI |
|---|---|---|---|
| Extremely Wet Year | 2013 | 1765.20 | 1.63 |
| Extremely Wet Year | 2018 | 1894.10 | 1.98 |
| Very Wet Year | 2010 | 1623.42 | 1.24 |
| Very Wet Year | 2014 | 1571.52 | 1.10 |
| Very Wet Year | 2016 | 1539.43 | 1.01 |
| Very Wet Year | 2017 | 1535.89 | 1.00 |
| Very Wet Year | 2019 | 1597.54 | 1.17 |
| Very Wet Year | 2024 | 1656.44 | 1.33 |
| Severely Dry Year | 1994 | 792.44 | -1.04 |
| Severely Dry Year | 1996 | 742.03 | -1.18 |
| Severely Dry Year | 1999 | 667.74 | -1.38 |
| Severely Dry Year | 2003 | 777.15 | -1.08 |
| Severely Dry Year | 2004 | 781.26 | -1.07 |
| Severely Dry Year | 2008 | 804.52 | -1.01 |
| Extreme Drought Year | 2000 | 587.85 | -1.60 |
| Extreme Drought Year | 2001 | 534.24 | -1.75 |
Table text extracted from the original PDF; superscript letters are shown inline. The original table image is below.
View original table image
| Period | Pre-Monsoon (mm) | Monsoon (mm) | Post-Monsoon (mm) | Winter (mm) | Annual Rainfall (mm) |
|---|---|---|---|---|---|
| 1990s (1990-1999) | 252.42 | 570.27 | 57.40 | 44.91 | 924.79 |
| 2000s (2000-2009) | 200.82 | 528.23 | 61.86 | 108.82 | 899.58 |
| 2010s (2010-2019) | 132.70 | 962.18 | 102.51 | 368.43 | 1565.82 |
| 2020-2024 | 148.91 | 810.22 | 141.77 | 300.96 | 1401.86 |
Table text extracted from the original PDF; superscript letters are shown inline. The original table image is below.
View original table image
| Rainfall Variable | Kendall's Tau | Z-value | p-value | Sen's Slope (mm year⁻¹) | Trend |
|---|---|---|---|---|---|
| Pre-Monsoon Rainfall | -0.394 | -3.295 | 0.001 | -4.44 | Significant Decreasing |
| Monsoon Rainfall | 0.435 | 3.664 | <0.001 | 14.73 | Significant Increasing |
| Post-Monsoon Rainfall | 0.396 | 3.309 | 0.001 | 3.08 | Significant Increasing |
| Winter Rainfall | 0.527 | 4.402 | <0.001 | 11.75 | Significant Increasing |
| Annual Rainfall | 0.454 | 3.820 | <0.001 | 23.84 | Significant Increasing |
Table text extracted from the original PDF; superscript letters are shown inline. The original table image is below.
View original table image
| Impact Perceived | Frequency (Agree + Strongly Agree) | Percentage (%) |
|---|---|---|
| Irregular rainfall pattern | 453 | 83.5 |
| Increased frequency of extreme weather events | 433 | 79.9 |
| Delayed/altered monsoon onset and duration | 435 | 80.3 |
| Reduced crop yield due to rising temperature | 422 | 78.6 |
| Increased pest and disease incidence | 364 | 67.2 |
Table text extracted from the original PDF; superscript letters are shown inline. The original table image is below.
View original table image
| Adaptation Strategy | Frequency (Agree + Strongly Agree) | Percentage (%) |
|---|---|---|
| Change in sowing dates | 456 | 84.1 |
| Rainwater harvesting | 354 | 65.3 |
| Mixed cropping | 279 | 51.5 |
| Migration or alternative employment | 258 | 47.6 |
| Taken loans to cope with climate impacts | 121 | 22.3 |
Table text extracted from the original PDF; superscript letters are shown inline. The original table image is below.
View original table image
References
19 in the original paper- IPCC. Climate Change 2023: Synthesis Report. Contribution of Working Groups I, II and III to the Sixth Assessment Report of the Intergovernmental Panel on Climate Change. Geneva: Intergovernmental Panel on Climate Change; 2023.
- Field CB, Barros VR, Dokken DJ, Mach KJ, Mastrandrea MD, Bilir TE, et al. Climate Change 2014: Impacts, Adaptation and Vulnerability. Cambridge: Cambridge University Press; 2014.
- Trenberth KE, Fasullo JT, Shepherd TG. Attribution of climate extreme events. Nature Climate Change. 2015;5(8):725-730.
- Food and Agriculture Organization. The State of Food and Agriculture 2021: Making Agrifood Systems More Resilient to Shocks and Stresses. Rome: FAO; 2021.
- Krishnan R, Sanjay J, Gnanaseelan C, Mujumdar M, Kulkarni A, Chakraborty S, editors. Assessment of Climate Change over the Indian Region. Singapore: Springer; 2020.
- Goswami BN, Venugopal V, Sengupta D, Madhusoodanan MS, Xavier PK. Increasing trend of extreme rain events over India in a warming environment. Science. 2006;314(5804):1442-1445.
- Roxy MK, Ritika K, Terray P, Murtugudde R, Ashok K, Goswami BN. Drying of the Indian subcontinent by rapid Indian Ocean warming and a weakening land-sea thermal gradient. Nature Communications. 2015;6:7423.
- Guhathakurta P, Bandgar AB, Menon PA, Prasad AK, Sangwan N, Advani SC. Observed Rainfall Variability and Changes over Northeast India. Pune: India Meteorological Department; 2020.
- Das PJ, Akhtar F, Basumatary H, Dutta A. Climate Change and Water Resources of Northeast India. Guwahati: Aranyak; 2009.
- Sharma E, Chettri N, Tse-ring K, Shrestha AB, Jing F, Mool P, et al. Climate Change Impacts and Vulnerability in the Eastern Himalayas. Kathmandu: International Centre for Integrated Mountain Development; 2016.
- Jain SK, Kumar V, Saharia M. Analysis of rainfall and temperature trends in Northeast India. International Journal of Climatology. 2013;33(4):968-978.
- Government of Manipur. State Action Plan on Climate Change (SAPCC), Manipur. Imphal: Directorate of Environment, Government of Manipur; 2013.
- Alexander LV, Zhang X, Peterson TC, Caesar J, Gleason B, Klein Tank AMG, et al. Global observed changes in daily climate extremes of temperature and precipitation. Journal of Geophysical Research. 2006;111(D5):D05109.
- Dore MHI. Climate change and changes in global precipitation patterns: What do we know? Environment International. 2005;31(8):1167-1181.
- Kumar KK, Kumar KR, Ashrit RG, Deshpande NR, Hansen JW. Climate impacts on Indian agriculture. International Journal of Climatology. 2004;24(11):1375-1393.
- Lal M. Climatic change implications for India's water resources. Journal of Indian Water Resources Society. 2001;21:101-119.
- Mall RK, Gupta A, Singh R, Singh RS, Rathore LS. Impact of climate change on Indian agriculture: A review. Climatic Change. 2006;78(2-4):445-478.
- Below TB, Mutabazi KD, Kirschke D, Franke C, Sieber S, Siebert R, et al. Can farmers' adaptation to climate change be explained by socio-economic householdlevel variables? Global Environmental Change. 2012;22(1):223-235.
- Nhemachena C, Hassan R. Micro-level analysis of farmers' adaptation to climate change in Southern Africa. IFPRI Discussion Paper 00714. Washington (DC): International Food Policy Research Institute; 2007.