
Research article · 2026 · Full text
International Journal of Geography Geology and EnvironmentSpatio-temporal analysis of climatic variability and crop productivity in Hisar district, Haryana
Volume 8(7) · Pages 226–233 · DOI: 10.22271/27067483.2026.v8.i7c.834 ↗
Research areasClimate change impacts on agricultureClimate variability and modelsHydrology and Drought Analysis
Abstract
Author-writtenAgricultural systems in the semi-arid region of northwestern India are increasingly vulnerable to rising temperatures, erratic rainfall patterns, and growing hydrological stress. However, district-level empirical evidence on the combined effects of these climatic changes remains limited. This study quantitatively assesses the long-term impacts of climatic variability on crop productivity in Hisar District, Haryana, during the period 1990-2025, with particular emphasis on crop-specific sensitivity and groundwater-mediated vulnerability. Daily climatic data obtained from the India Meteorological Department and crop yield records from the Directorate of Economics and Statistics were analyzed using non-parametric trend detection techniques, including the Mann-Kendall test and Sen’s slope estimator, along with standardized anomaly analysis and multivariate regression modeling. The findings indicate a statistically significant warming trend, with maximum temperature increasing by 0.82 °C per decade, accompanied by a 22% decline in monsoon rainfall relative to the 1990s baseline. Simultaneously, groundwater depth increased from 17 m to 35 m below ground level, reflecting a substantial rise in dependence on groundwater for irrigation. Yield-climate elasticity analysis reveals marked crop-specific responses, with wheat and mustard yields declining by approximately 13.6% and 9.1%, respectively, for every 1 °C increase in mean temperature. In contrast, cotton and bajra exhibit comparatively lower sensitivity, owing to their greater physiological tolerance and the buffering effects of irrigation. Spatial assessment identifies the southern blocks of Adampur and Narnaund as the most vulnerable areas, where crop yield losses exceed 20% and groundwater depletion is particularly severe. The study provides robust district-level empirical evidence linking long-term climatic trends with crop productivity and groundwater stress. These findings underscore the need for geographically targeted adaptation strategies to enhance agricultural resilience. The adoption of heat-tolerant crop cultivars, optimization of sowing windows, and implementation of water-efficient irrigation practices are identified as critical measures for sustaining agricultural productivity in the semi-arid regions of Haryana.
Summary
Source-checkedPlain-language reading of the full paper, prepared with AI and checked against the text. Each point links to the authors' own words.
Why it matters
- Agricultural systems in northwestern India's semi-arid regions are becoming more vulnerable due to increasing temperatures, unpredictable rainfall, and hydrological stress. View evidence ↗
- The agricultural sector is vital to India, employing nearly half of the workforce and contributing approximately 18% of the national GDP. View evidence ↗
- Previous research often analyzes temperature and rainfall separately, neglecting how groundwater depletion compounds the effects of climate change on agriculture. View evidence ↗
The question
- The study aims to quantitatively assess how climatic variability impacted crop productivity in the Hisar District of Haryana from 1990 to 2025, focusing on groundwater vulnerability and crop-specific sensitivity. View evidence ↗
What they did
- The researchers used daily climatic data (temperature, rainfall, humidity, and wind speed) from the IMD Hisar Observatory for the period 1990-2025. View evidence ↗
- Crop yield data, measured in quintals per hectare, were sourced from the Directorate of Economics and Statistics and validated by the Department of Agriculture, Haryana. View evidence ↗
- The analysis employed multivariate regression modeling, standardized anomaly analysis, and non-parametric trend detection via Sen's slope estimator and the Mann-Kendall test. View evidence ↗
What they found
- There was a statistically significant warming trend in the region, with maximum temperatures rising by 0.82 °C every decade. View evidence ↗
- Monsoon rainfall declined by 22% when compared to the baseline levels of the 1990s. View evidence ↗
- Groundwater depth increased from 17 m to 35 m below ground level, indicating a significant increase in the reliance on groundwater for irrigation. View evidence ↗
- Wheat and mustard showed high thermal sensitivity, with yields dropping by approximately 13.6% and 9.1% respectively for every 1 °C increase in mean temperature. View evidence ↗
- Cotton and bajra were less sensitive to temperature increases due to their physiological tolerance and the buffering provided by irrigation. View evidence ↗
- The southern blocks of Narnaund and Adampur were identified as the most vulnerable, experiencing groundwater depletion and crop yield losses of over 20%. View evidence ↗
- The frequency of heat-wave days (above 40 °C) nearly doubled, rising from 7 days per year in the 1990s to 15 days per year between 2020 and 2025. View evidence ↗
What it means
- To sustain productivity, the authors recommend implementing water-efficient irrigation, optimizing sowing windows, and adopting heat-tolerant crop cultivars. View evidence ↗
- The authors state that future research should incorporate socio-economic variables, such as credit and income, to connect biophysical impacts to livelihood outcomes. View evidence ↗
Visual summary
2 visualsIllustrations explain the paper; charts are replotted from the paper's own table values.
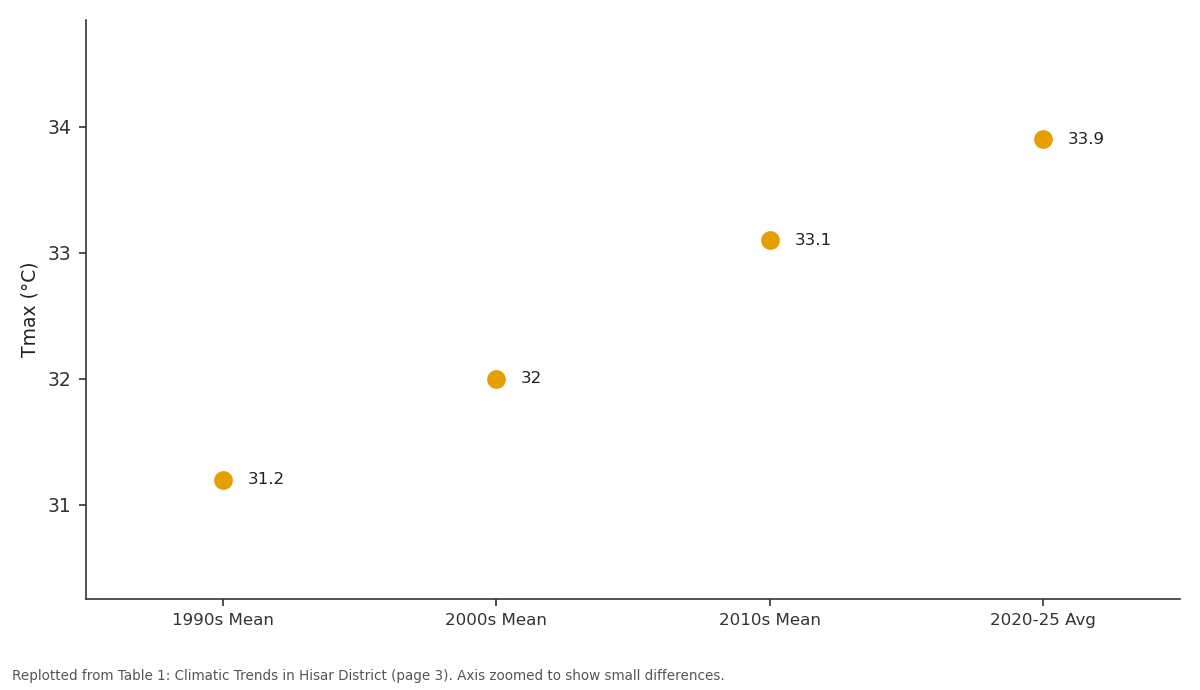
Tmax (°C): 1990s Mean vs 2000s Mean vs 2010s Mean vs 2020-25 Avg
Replotted from Table 1 (page 3) of the original paper. Every bar is the paper's own table value.
View source evidence ↗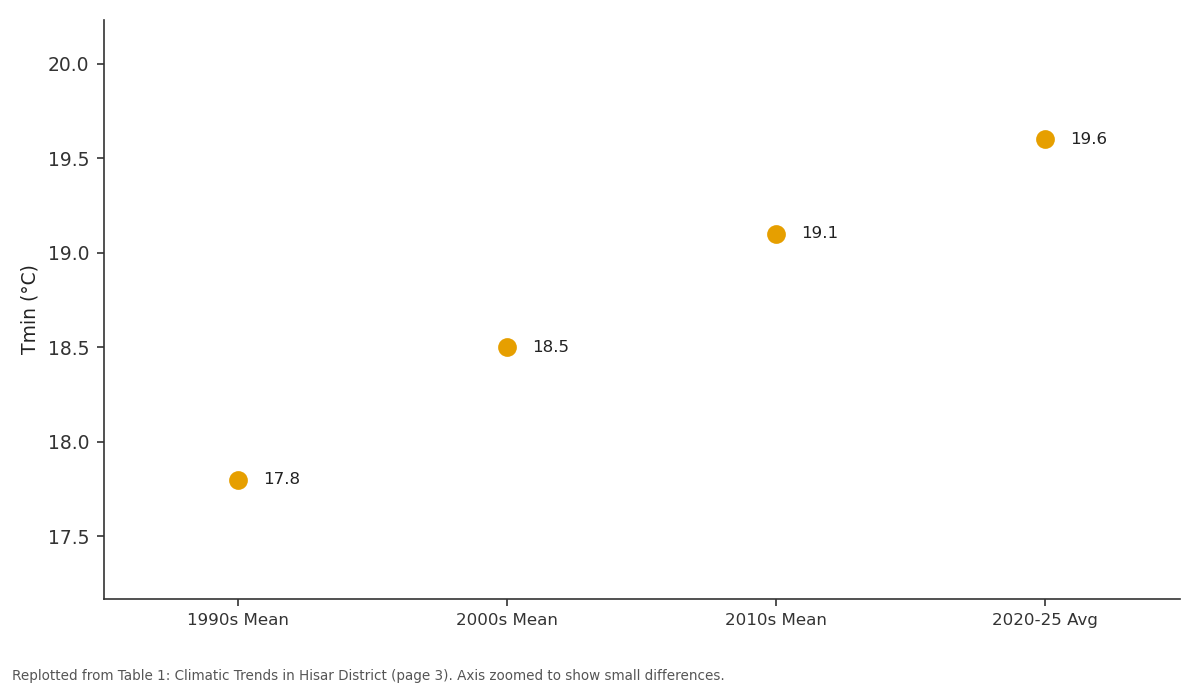
Tmin (°C): 1990s Mean vs 2000s Mean vs 2010s Mean vs 2020-25 Avg
Replotted from Table 1 (page 3) of the original paper. Every bar is the paper's own table value.
View source evidence ↗Figures & tables
From the original paper Table 1
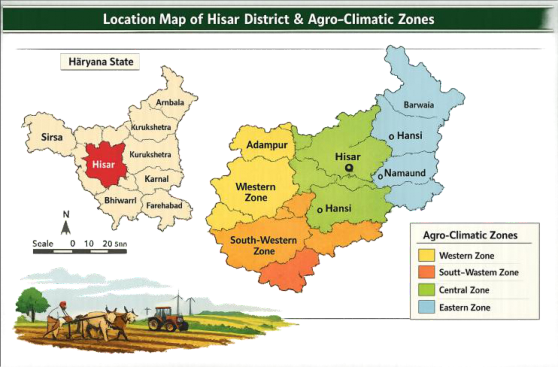 Figure 1
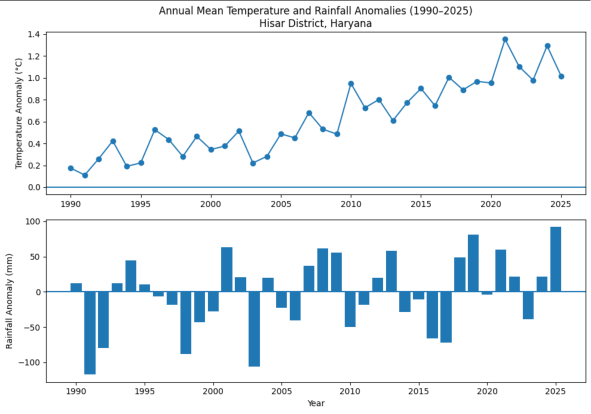 Figure 2
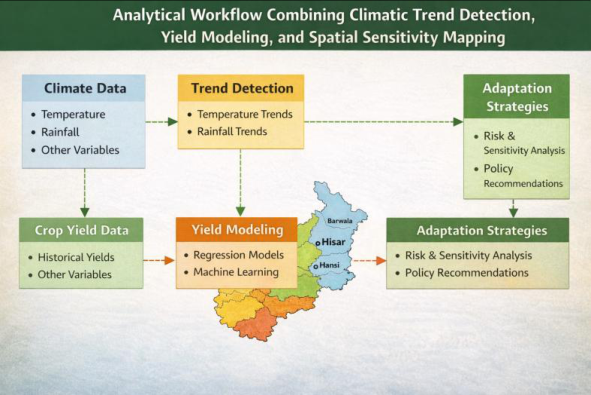 Figure 3
 Table 2
 Table 3
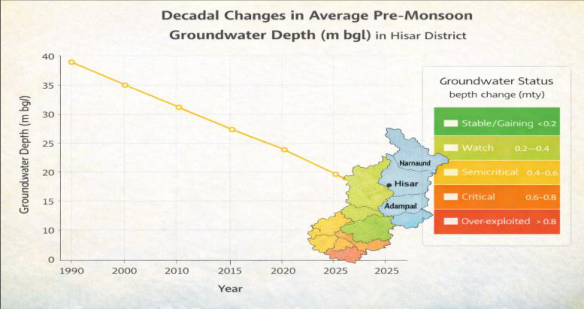 Figure 4
 Table 4
 Table 5
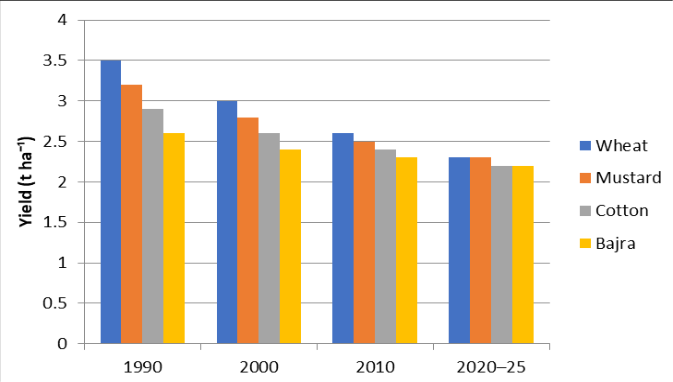 Figure 5
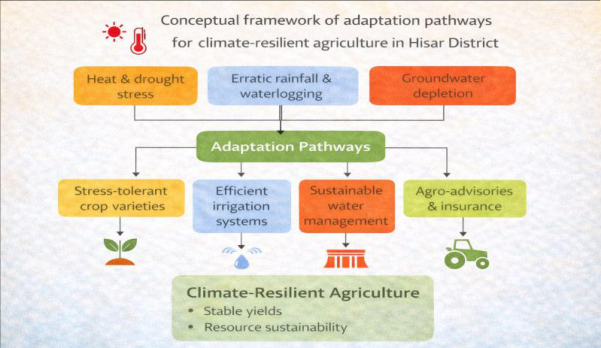 Figure 6
Introduction
The accelerating pace of climate change has emerged as one of the foremost challenges to global food security. Temperature anomalies, erratic rainfall, and extreme weather events have collectively threatened the stability of agro-ecosystems, particularly in regions dependent on monsoon-driven agriculture [1,2] . Empirical evidence demonstrates that even moderate temperature increases can lead to significant yield losses in major cereals. A global meta-analysis estimated that for every 1 °C rise in mean temperature, wheat yields decline by 6%, maize by 7%, and rice by 3% [3] . In India the world's second-largest producer of wheat and rice the vulnerability of agriculture to climatic shocks has been well documented [4,5] . The Indian agricultural sector contributes about 18% of the national GDP and employs nearly half of the workforce [6] . However, its dependence on monsoon rainfall, coupled with regionally uneven irrigation access, makes it highly sensitive to climate variability. The Indo-Gangetic Plain (IGP), encompassing Haryana, Punjab, and western Uttar Pradesh, forms the nation's primary grain belt but is now confronting rising temperatures, declining water tables, and soil fertility degradation [7,8] . Within this landscape, Hisar District, located in the western agro-climatic zone of Haryana, provides a representative microcosm of semi-arid agricultural dynamics [9] . Hisar experiences hot summers and mild winters, with mean annual rainfall around 420 mm, of which nearly 80% occurs during the southwest monsoon. Soils are sandy loam with low organic carbon, requiring substantial irrigation to sustain productivity. The district's primary cropping pattern comprises wheat-mustard during the Rabi season and cotton-bajra during the Kharif season [10] . Wheat and mustard together occupy approximately 65% of the net sown area, while cotton and bajra dominate the summer cycle [11] . This four-crop system underpins regional food and livelihood security but is also directly exposed to thermal and hydrological stress [12] . Long-term analyses indicate that Haryana's mean annual temperature has risen by nearly 1.5 °C since the early 1980s, while rainfall variability has intensified, increasing the frequency of droughts and localized flooding [13,14] . Studies have attributed these trends to a combination of large-scale monsoon circulation changes and local land-use transitions [15] . The resulting imbalance between evapotranspiration and rainfall recharge has accelerated groundwater depletion across the region [16,17] . At the national level, several modeling studies have explored climate-yield relationships using regression, cropsimulation, and remote-sensing techniques [18,19] . For instance, Aggarwal et al. [20] demonstrated that a 2 °C warming could reduce wheat yields by up to 25% in northern India. Similarly, Auffhammer et al. [21] observed that declining monsoon rainfall contributes to productivity stagnation in rain-fed regions. However, most such studies operate at state or national scales, often overlooking intradistrict heterogeneity and localized climatic responses [22] . Hisar's semi-arid agro-climate, historically buffered by canal irrigation, is increasingly reliant on tube wells as canal inflows diminish [23] . Groundwater extraction in several blocks now exceeds sustainable recharge limits [24] . At the same time, the expansion of high-yielding wheat and cotton varieties has elevated water demand, intensifying the region's vulnerability to rainfall deficits [25] . Given these overlapping pressures, understanding the quantitative linkages between climate variability and crop productivity in Hisar is critical for future agricultural planning. The rationale for this investigation lies in the observation that climate impacts on agriculture are rarely uniform across crops, seasons, or geographies [26] . Wheat and mustard, as cool-season crops, are particularly sensitive to warming during anthesis and grain filling [27] ; cotton and bajra, being warm-season crops, exhibit comparatively greater heat tolerance [28] . Evaluating these differential sensitivities using empirical data offers insight into both climatic risk and adaptation potential [29] . Furthermore, policy interest in Haryana's climate resilience has grown since the early 2020s, with state-level initiatives promoting micro-irrigation, crop diversification, and renewable energy for irrigation pumps [30,31] . Yet, empirical quantification of climate effects at the district scale remains limited. This paper aims to address that gap through a statistically grounded assessment covering 1990-2025. Despite a growing body of literature on climate-crop interactions in India, most empirical assessments have been conducted at national or state scales, often masking substantial intra-regional heterogeneity in climatic exposure, hydrological stress, and crop response. District-scale analyses, particularly those integrating climatic trends with crop productivity and groundwater dynamics, remain sparse for semi-arid regions of northwestern India. Existing studies largely examine temperature and rainfall effects in isolation, with limited attention to the compounding role of groundwater depletion as a secondary but critical mediator of climate impacts on agriculture. This study addresses these gaps by providing a comprehensive, district-level assessment of climate variability and crop productivity in Hisar District, Haryana, over a 36-year period (1990-2025). Unlike prior work, the analysis simultaneously quantifies long-term trends in temperature, rainfall, and extreme events; estimates cropspecific yield sensitivities and elasticities for four major crops with contrasting physiological characteristics; and explicitly links climatic stress to groundwater depletion and spatial vulnerability patterns. By integrating statistical trend detection, multivariate regression modeling, and spatial vulnerability assessment within a unified framework, the study advances empirical understanding of how climate change interacts with hydrological stress to shape agricultural outcomes at local scales. The findings contribute novel evidence on differential crop sensitivity, reveal a transition from canal-supported to groundwater-dependent irrigation regimes, and demonstrate that climate impacts and adaptation needs vary markedly across blocks within the same district. These insights underscore the importance of geographically differentiated adaptation strategies and provide a replicable analytical template for district-scale climate-agriculture assessments across semi-arid regions of India. The specific objectives of this research are to 1. Detect and quantify long-term trends in key climatic variables (temperature, rainfall, and extreme events) in Hisar district; 2. Evaluate the statistical relationship between these variables and crop yields of wheat, mustard, cotton, and bajra; 3. Determine the relative sensitivity and vulnerability of each crop to climatic variability; and 4. Suggest adaptive agronomic and water-management measures to mitigate adverse impacts.
Through this multi-decadal analysis, the study contributes to an improved understanding of how local climatic dynamics influence crop performance in Haryana's semi-arid context. By combining classical trend analysis with simulated yield modeling, it builds an empirical foundation for climateresilient agricultural development in the region. The remainder of this paper is structured as follows. Section 2 describes the study area and the climatic, agricultural, and groundwater datasets used in the analysis. Section 3 outlines the methodological framework, including trend detection, anomaly analysis, regression modeling, yield elasticity estimation, and spatial assessment techniques. Section 4 presents and discusses the results, focusing on climatic trends, crop-specific yield responses, groundwater stress, and spatial patterns of agricultural vulnerability. Section 5 concludes the study by synthesizing the major results on climate-yield interactions and highlighting their implications for crop planning, technological adaptation, and regional agricultural development under changing climatic conditions.
Study Area and Data Description
Hisar District, located in western Haryana (29° 05′ -29° 49′ N; 75° 26′ -76° 15′ E), covers roughly 3,983 km² and lies 215 m above mean sea level. The district's topography is characterized by gently undulating plains with occasional aeolian dunes and ephemeral drainage channels. Its climate is semi-arid tropical, dominated by scorching summers, a short but intense monsoon, and mild winters [9,32] . The mean annual rainfall is approximately 420 mm, of which nearly 80% occurs between June and September. Annual potential evapotranspiration (~1,300 mm) exceeds rainfall by a factor of three, rendering the area highly irrigation-dependent. Soils are predominantly sandy loam, low in organic carbon (0.3-0.5%), and moderately alkaline, restricting nutrient retention [10] . Agriculture is the primary livelihood, with more than 82% of the total land area under cultivation. The dominant cropping system includes wheat (Triticum aestivum L.) and mustard (Brassica juncea L.) during the Rabi season, and cotton (Gossypium hirsutum L.) and bajra (Pennisetum glaucum L.) in Kharif. The cropping intensity averages 177%, supported by canal irrigation from the Western Yamuna Canal and extensive tube-well use [33] .
Climatic and Agricultural Datasets
Climatic parameters maximum and minimum temperature (°C), total rainfall (mm), relative humidity (%), and wind speed (m s⁻¹) were obtained from the India Meteorological Department (IMD) Hisar Observatory for 1990-2025. Daily data were aggregated to monthly and seasonal scales. Cropyield statistics (quintal ha⁻¹) were compiled from the Directorate of Economics and Statistics (DES) and validated against the Department of Agriculture, Haryana.
Groundwater data (pre-and post-monsoon depth) were sourced from the Central Ground Water Board (CGWB) regional reports [3] . Missing values (< 2%) were estimated using simple linear interpolation. The dataset reveals progressive warming and rainfall decline since 2000. Groundwater levels show a consistent downward trend from 17 m (1990) to 35 m (2025) below ground level, confirming the area's transition toward groundwater-dependent irrigation [21,34] .
Key Contributions of the Study
This study makes the following key contributions to the literature on climate variability and agricultural productivity:
1. District-scale empirical assessment: It provides one of the few long-term, district-level analyses (1990-2025) quantifying the impacts of climate variability on crop productivity in Hisar District, Haryana, thereby addressing the spatial aggregation bias inherent in stateand national-scale studies.
Integrated climate-crop-groundwater framework:
The study explicitly links climatic trends (temperature, rainfall, and extremes) with crop yield responses and groundwater depletion, demonstrating how hydrological stress mediates climate impacts on agriculture in semi-arid regions.
Crop-specific sensitivity and elasticity estimates: By
estimating yield elasticities for four major crops wheat, mustard, cotton, and bajra the analysis reveals substantial heterogeneity in crop responses, highlighting the heightened vulnerability of cool-season crops relative to warm-season and C4 crops.
Spatial identification of vulnerability hotspots:
Through decadal and spatial analysis, the study identifies block-level vulnerability clusters within Hisar district, showing that southern blocks experience disproportionately higher yield losses and groundwater stress compared to northern canal-command areas.
Policy-relevant adaptation insights:
The findings translate statistical results into actionable adaptation pathways, emphasizing the need for geographically differentiated strategies such as heat-tolerant cultivars, optimized sowing windows, and water-efficient irrigation to enhance climate resilience in semi-arid agriculture.
Methodology
The analytical framework integrates statistical trend detection, climate-yield modeling, and spatial analysis (Figure 3).
Trend Detection
Temporal trends in climatic variables were examined using the Mann-Kendall (MK) test and Sen's Slope estimator. These non-parametric methods are robust to non-normal distributions and missing data [6,35] . The MK test statistic S is computed as:
where x represents the climatic variable of length n. Positive S implies an upward trend. The corresponding standardized Z value was tested at α = 0.05 and 0.01. Sen's Slope (β) quantifies the magnitude of change (e.g., °C yr⁻¹, mm yr⁻¹).
Anomaly and Variability Analysis
To normalize inter-annual variations, standardized anomalies were calculated as (Eq. 2)
where X i = annual value, = mean, and σ = standard deviation. Anomalies exceeding ±1 σ denote extreme deviations. Coefficients of variation (CV) were computed to gauge rainfall variability [36] .
Regression and Sensitivity Modeling
The quantitative impact of climate variables on crop yields was analyzed using multiple linear regression (MLR) and Pearson correlation. The general MLR form is:
where Y t is the crop yield at time t, T t is the mean temperature, R t is total seasonal rainfall, and ε t is the random error term. The regression coefficients β₁ and β₂ represent the sensitivity of crop yield to temperature and rainfall variations [18] , respectively.
Yield Elasticity quantifies the percentage change in yield for each 1 °C rise in temperature, offering a comparative index of crop sensitivity was derived as: E = (ΔY / Y) / ΔT (Eq. 4) The strong negative correlations for wheat and mustard underscore their thermal sensitivity, while bajra and cotton maintain comparatively stable yields due to physiological and management adaptations [27,28] .
Decadal and Spatial Analysis
Decadal averages were compared to identify shifts in climatic baselines. Spatial interpolation using Inverse Distance Weighting (IDW) generated continuous surfaces of temperature and rainfall anomalies, enabling block-level assessment of exposure and sensitivity [37] .
Uncertainty Estimation
Model robustness was verified via 1,000-sample bootstrap resampling of regression residuals. Confidence intervals (95%) were calculated for elasticity estimates. The overall methodological flow is summarized below.
Results and Discussion Climatic Trends and Variability
Trend analysis for Hisar (1990-2025) reveals a statistically significant warming signal accompanied by a persistent decline in rainfall, indicating a clear local manifestation of ongoing climate change [1,2] . Maximum temperature increased by an average of 0.82 °C per decade, while minimum temperature rose by 0.64 °C per decade, in agreement with findings from Krishnan et al. [11] and Dash et al. [12] . Heat-wave frequency (> 40 °C) nearly doubled, increasing from 7 days yr⁻¹ in the 1990s to 15 days yr⁻¹ during 2020-2025. Rainfall shows a significant downward Sen's slope of -2.3 mm yr⁻¹, corresponding to a 22% decline over the study period. The coefficient of variation (CV) for annual rainfall increased from 19% in the 1990s to 34% in the 2020s, demonstrating intensifying inter-annual variability [13,14] . Periods of rainfall deficiency coincided with pronounced negative yield anomalies, particularly during 2002-2003, 2009-2010, and 2018-2019 years marked by weak monsoon onset and extended dry spells [15] . These trends correspond closely with regional studies across the Indo-Gangetic Plain, which document a warming rate of 0.8-1.0 °C decade⁻¹ and rainfall decline of 2-3 mm yr⁻¹ since 1990 [15][16][17] .
Groundwater and Water Resource Stress
Groundwater depth increased sharply from an average of 17 m bgl in 1990 to 35 m bgl by 2025, reflecting severe and persistent aquifer stress [21] . Blocks such as Narnaund and Adampur show critical declines exceeding 1.2 m yr⁻¹. The correlation between cumulative rainfall deficit and groundwater depletion is r = -0.68 (p<0.01), underscoring rainfall's influence on recharge rates. CGWB data indicate that the district's stage of groundwater extraction rose from 73% in 1990 to 138% by 2025, categorizing Hisar as "overexploited" [22] . This mirrors statewide patterns in Haryana where intensified irrigation and thermal stress have increased water use efficiency challenges [23,24] .
Crop Productivity Response
The regression analysis between climatic parameters and crop yields (Table 4) reveals that wheat and mustard are highly temperature sensitive, while cotton and bajra show lower correlation magnitudes due to physiological and management buffers. (*p<0.05)
| Crop | β₁ (Temp) | β₂ (Rainfall) | R² | Yield Elasticity (% per °C) |
|---|---|---|---|---|
| Wheat | −0.48* | +0.21 | 0.62 | −13.6 |
| Mustard | −0.32* | +0.17 | 0.49 | −9.1 |
| Cotton | −0.15 | +0.10 | 0.28 | −3.8 |
| Bajra | −0.13 | +0.12 | 0.23 | −4.6 |
Table text extracted from the original PDF; superscript letters are shown inline. The original table image is below.
View original table image
Yield elasticity estimates indicate substantial thermal sensitivity, with wheat and mustard yields declining by approximately 13% and 9% per 1 °C increase in mean temperature, consistent with Aggarwal et al. [20] and Lobell et al. [9] . Conversely, bajra, a C4 crop, shows relative tolerance [28] . Simulated decadal averages indicate stagnation or decline in yield despite technological progress (Figure 5).
Comparative and Contextual Discussion
The observed patterns are consistent with regional evidence from northwestern India, reinforcing the robustness of the estimated climate-yield relationships [15,19,20] . In Punjab, Sidhu and Singh [15] reported a 10% decline in wheat productivity between 2000-2020 linked to warmer winters. In Rajasthan, Choudhary et al. [16] found rainfall deficits of 15 -25% causing yield stagnation in pearl millet. Similar behavior is evident in Uttar Pradesh [17] . On a global scale, Porter et al. [14] and Zhao et al. [18] have demonstrated parallel yield reductions under warming scenarios. Such cross-validation enhances confidence in the robustness of our statistical relationships. From a biophysical standpoint, heat stress during anthesis shortens the grain-filling phase, lowers kernel weight, and accelerates senescence in wheat [13,27] . Mustard faces impaired photosynthetic activity beyond 33 °C [29] . In contrast, cotton, due to deep root systems and heat-tolerant hybrids, maintains yield stability up to 38 °C [25,28] . The increased frequency of extreme events-short drought spells and heavy rainfall bursts-exacerbates yield instability. Our data show a 15% increase in days exceeding 40 °C and a 19% rise in rainfall events > 100 mm day⁻¹ after 2010. These extremes amplify yield instability through combined terminal heat stress and episodic waterlogging during critical crop growth stages [30] .
Groundwater depletion represents the most critical secondary impact of climatic change in Hisar. Tube-well irrigation partially offsets rainfall variability but accelerates unsustainable groundwater drawdown. Over-reliance on electric and diesel pumps also inflates carbon emissions, creating a climate feedback loop [31,32] . The study's spatial interpolation results (Table 5) depict high vulnerability clusters coinciding with low rainfall and declining water tables. These findings highlight that climate adaptation must be geographically differentiated rather than uniformly implemented.
| Block | Rainfall Trend | Groundwater Status | Yield Impact | Vulnerability Class |
|---|---|---|---|---|
| Adampur | Strong decline | Over-exploited | >20% loss | Very High |
| Narnaund | Declining | Rapid depletion | 15-20% loss | High |
| Hisar | Moderate decline | Stressed | 10-15% loss | Moderate |
| Uklana | Near-stable | Semi-critical | <10% loss | Low |
| Barwala | Stable | Semi-critical | <10% loss | Low |
Table text extracted from the original PDF; superscript letters are shown inline. The original table image is below.
View original table image
Adaptation Strategies and Policy Implications
To maintain agricultural sustainability under climate stress, multi-level adaptation measures are required. Agronomic responses include:
• Development of heat-tolerant wheat (HD 3086, DBW 187) and mustard (Pusa Mustard 30) cultivars [33] .
• Shifting sowing windows earlier by 10-15 days to avoid terminal heat. • Adoption of precision irrigation (drip/sprinkler) and zero-tillage to enhance soil moisture retention [34] . • Promoting diversification toward less water-intensive crops like pulses and horticultural species.
Based on the observed climatic trends, crop sensitivities, and groundwater stress, a conceptual framework of adaptation pathways is proposed (Figure 6) to link empirical evidence with targeted climate-resilient agricultural strategies. can integrate our quantitative results into block-level resource allocation [35] . Long-term adaptation must also include digital agro-advisories, climate-information services, and capacity-building programs [36,37] . Machinelearning-based yield prediction models [35] and coupling of crop growth simulators (DSSAT, AquaCrop) with downscaled CMIP6 scenarios [34] can further enhance forecasting accuracy. Collectively, these findings demonstrate that climatic warming, rainfall variability, and groundwater depletion act as interacting stressors, reshaping crop productivity patterns and amplifying spatial inequality in agricultural vulnerability within Hisar district.
Conclusion and Future Scope
This study provides a comprehensive quantitative assessment of climate variability and its influence on crop productivity in Hisar District from 1990 to 2025. The evidence shows statistically significant warming (+ 0.82 °C decade⁻¹), rainfall decline (-2.3 mm yr⁻¹), and groundwater depletion (≈ 18 m over three decades). Wheat and mustard exhibit strong negative thermal sensitivity, confirming their vulnerability to rising temperatures (Table 4), while cotton and bajra remain moderately stable.
The results underscore that Hisar's agrarian system has transitioned from a canal-supported to a groundwaterdependent regime, heightening its vulnerability to climatic shocks. Adaptation measures emphasizing water-use efficiency, crop diversification, and resilient cultivars are imperative to sustain productivity and rural livelihoods.
Future work should expand this statistical framework by 1. Incorporating socio-economic variables (income, credit, input use) to link biophysical impacts with livelihood outcomes [33,38] ; 2. Using remote-sensing-based vegetation indices to refine spatial sensitivity mapping [28] ; and 3. Employing regional climate models (RCMs) for future scenario simulations up to 2050 [34,39] .
This integrated methodology offers a replicable template for district-scale climate-agriculture assessments across semiarid regions of India.
Acknowledgement
AcknowledgementsThe authors express sincere gratitude to the India Meteorological Department (IMD), Directorate of
Figures and tables from the paper
| Variable | 1990s Mean | 2000s Mean | 2010s Mean | 2020-25 Avg | Sen’s Slope | Trend |
|---|---|---|---|---|---|---|
| Tmax (°C) | 31.2 | 32.0 | 33.1 | 33.9 | +0.082 °C yr⁻¹ | Significant ↑ |
| Tmin (°C) | 17.8 | 18.5 | 19.1 | 19.6 | +0.064 °C yr⁻¹ | Significant ↑ |
| Rainfall (mm) | 502 | 468 | 422 | 386 | −2.3 mm yr⁻¹ | Significant ↓ |
| Heat-wave days | 6 | 9 | 13 | 15 | +0.29 days yr⁻¹ | Significant ↑ |
Table text extracted from the original PDF; superscript letters are shown inline. The original table image is below.
View original table image
| Crop | Temperature (r) | Rainfall (r) | R² (MLR) | Yield Elasticity (% per °C) |
|---|---|---|---|---|
| Wheat | -0.74 | +0.45 | 0.62 | -13.6 |
| Mustard | -0.58 | +0.31 | 0.49 | -9.1 |
| Cotton | -0.25 | +0.19 | 0.28 | -3.8 |
| Bajra | -0.21 | +0.24 | 0.23 | -4.6 |
Table text extracted from the original PDF; superscript letters are shown inline. The original table image is below.
View original table image
| Variable | Sen’s Slope | Z-value | p-value | Trend |
|---|---|---|---|---|
| Maximum Temperature (°C yr⁻¹) | +0.082 | 3.94 | 0.001 | Significant ↑ |
| Minimum Temperature (°C yr⁻¹) | +0.064 | 2.88 | 0.004 | Significant ↑ |
| Rainfall (mm yr⁻¹) | −2.3 | −2.64 | 0.008 | Significant ↓ |
| Heat-wave days | +0.29 | 3.37 | 0.001 | Significant ↑ |
Table text extracted from the original PDF; superscript letters are shown inline. The original table image is below.
View original table image
References
36 in the original paper- Aggarwal PK. Impact of climate on rice-wheat systems in India. Clim Change. 1993;23:335-358. DOI:10.1007/BF01091856.
- Rosenzweig C, Parry M. Potential impact of climate change on world food supply. Nature. 1994;367:133138. DOI:10.1038/367133a0.
- Central Ground Water Board. Groundwater yearbook: Haryana. New Delhi: Government of India; 2022.
- Mearns LO, et al. Climate variability and agricultural impacts. Clim Change. 2001;50:87-98. DOI:10.1023/A:1010612328443.
- Mall RK, et al. Climate change and Indian agriculture. Curr Sci. 2006;90:160-165.
- Lobell DB, Field CB. Global scale climate-crop relationships. Environ Res Lett. 2007;2:014002. DOI:10.1088/1748-9326/2/1/014002.
- Chaturvedi RK, et al. Future climate scenarios for India. Curr Sci. 2007;93:347-356.
- Intergovernmental Panel on Climate Change. Climate change 2007: impacts, adaptation and vulnerability. Cambridge: Cambridge University Press; 2007.
- Auffhammer M, et al. Climate change and Indian agriculture. Proc Natl Acad Sci U S A. 2011;108:14569-14574. DOI:10.1073/pnas.1109686108.
- Krishnan R, et al. Observed climate change trends over India. Curr Sci. 2012;102:37-49.
- Ortiz R, et al. Climate change and wheat breeding. Agric Ecosyst Environ. 2008;126:46-58. DOI:10.1016/j.agee.2008.01.013.
- Porter JR, et al. Food security and production systems. In: Climate change 2014: impacts, adaptation, and vulnerability. Contribution of Working Group II to the Fifth Assessment Report of the IPCC. Cambridge: Cambridge University Press; 2014.
- Sidhu HS, Singh M. Climate change and wheat productivity in Punjab. Theor Appl Climatol. 2021;146:1129-1141. DOI:10.1007/s00704-021-037220.
- Choudhary R, et al. Rainfall variability and crop yield correlation in Rajasthan. Clim Res. 2019;73:155-165.
- Tripathi A, Mishra AK. Assessing climate impacts on crops in Uttar Pradesh. Reg Environ Change. 2020;20:49.
- Zhao C, et al. Temperature increase reduces global crop yields. Proc Natl Acad Sci U S A. 2017;114:9326-9331. DOI:10.1073/pnas.1701762114.
- Jain SK, et al. Spatial variability of climate and groundwater in Haryana. Hydrol Sci J. 2018;63:15071520.
- Aggarwal PK, Mall RK. Climate change and agriculture in India. Environ Model Softw. 2002;17:8796.
- Yadav S, Singh V. Groundwater depletion dynamics in Hisar. Environ Monit Assess. 2020;192:314.
- Kaur N, et al. Soil texture and fertility variation under climate stress. Indian J Soil Sci. 2021;69:125-134.
- Verma M, Kumar S. Irrigation efficiency and climate resilience. Agric Water Manag. 2021;248:106778.
- Rani S, et al. Farmers' perceptions of climate change in Haryana. J Clim Change. 2021;7:15-26.
- Food and Agriculture Organization. Climate-smart agriculture sourcebook: India chapter. Rome: FAO; 2023.
- Chaudhary K, et al. Mustard productivity under heat stress. Field Crops Res. 2023;297:109024. DOI:10.1016/j.fcr.2023.109024.
- Gupta PK, et al. Remote sensing of crop stress in Haryana. Remote Sens Appl. 2023;29:100891.
- Khatri A, et al. Climate change and water stress in northwest India. J Hydrol. 2024;629:130622.
- Pathak H, et al. Adaptation strategies for Indian agriculture. Curr Opin Environ Sustain. 2024;61:101259.
- Rao GS, et al. Integrating climate data into agricultural policy. Environ Sci Policy. 2025;155:33-49.
- Mandal S, et al. Statistical analysis of rainfall trends in India. Meteorol Appl. 2024;31:e2209.
- Kumari R, et al. Socio-economic impacts of climate change on farmers. J Rural Stud. 2024;99:85-98.
- Joshi P, et al. Future climate projection for Haryana using CMIP6. Theor Appl Climatol. 2025;162:245-261.
- Kumar V, et al. Machine-learning models for yield forecasting. Comput Electron Agric. 2025;219:108697.
- United Nations Environment Programme. Adaptation gap report 2024. Nairobi: UNEP; 2024.
- World Bank. South Asia climate risk profile: India. Washington (DC): World Bank; 2025.
- Singh R, Hooda RS. Climate variability and agriculture in Haryana. J Agrometeorol. 2019;21:410-418.
- Intergovernmental Panel on Climate Change. Climate change 2022: impacts, adaptation and vulnerability. Cambridge: Cambridge University Press; 2022.