
Research article · 2026 · Full text
International Journal of Geography Geology and EnvironmentImprints of great boundary fault (GBF) on Vindhyan Supergroup in Motipur-Malikhera area, Bhilwara district, Rajasthan
Volume 8(7) · Pages 243–246 · DOI: 10.22271/27067483.2026.v8.i7c.836 ↗
Research areasGeological and Geophysical Studiesearthquake and tectonic studiesGeological Studies and Exploration
Abstract
Author-writtenGreat Boundary Fault (GBF) demarcates the western and north-western margin of Vindhyan basin. It evolution is complex and has been treated mostly as basinal margin fault for Vindhyans. Structural deformation pattern from Motipur - Malikhera area along the contact of pre-Vindhyan and Vindhyan Supergroup signifies the presence of fault related deformation or damage zone with circulation of fluids through the inter-connected sets of fracture. This has led to ferruginisation or silica venation along the fracture sets. The latest reactivation of the GBF is in form of reverse faulting with the last stage of deformation represented by the displacement along wrench faults.
Summary
Source-checkedPlain-language reading of the full paper, prepared with AI and checked against the text. Each point links to the authors' own words.
Why it matters
- The Great Boundary Fault (GBF) is a major structural feature extending over 400 km in a NE-SW direction, marking the western and north-western margins of the Vindhyan basin. View evidence ↗
- While Vindhyan Supergroup strata are typically undeformed in the Son valley and Chambal sectors, they exhibit variable deformation in the Rajasthan sector caused by the GBF. View evidence ↗
The question
- The study aims to investigate the specific imprints of deformation caused by the GBF on the Vindhyan Supergroup within the Motipur-Malikhera area of the Bhilwara district, Rajasthan. View evidence ↗
What they did
- The research was conducted in the south-eastern part of Rajasthan, focusing on NNE-SSW trending ridges of the Vindhyan Supergroup adjacent to the Hindoli Group. View evidence ↗
- The researchers measured fracture and vein density, defined as the number of fractures per square meter, along an East-West line across the contact between pre-Vindhyan and Vindhyan rocks. View evidence ↗
- X-Ray Fluorescence was used to analyze the geochemical composition of 16 samples from the contact zone and 18 samples from away from the contact, specifically measuring Copper (Cu), Lead (Pb), and Zinc (Zn). View evidence ↗
What they found
- Fracture density was highest at the contact, measuring 8-12 per square meter over a 100m width, and decreased to 3-4 per square meter as distance from the contact increased. View evidence ↗
- Proximal to the contact, 20-40% of fractures were ferruginized and another 20-40% were sealed with silica veins, with these proportions dropping below 20% further away. View evidence ↗
- Samples from the contact zone showed significantly higher average concentrations of Cu (85ppm), Pb (87ppm), and Zn (150ppm) compared to samples away from the contact, which averaged 14ppm, 6ppm, and 34ppm respectively. View evidence ↗
- Bedding was found to be steeper along the contact compared to beds further East or West, a phenomenon most prominent in the Vindhyan Supergroup. View evidence ↗
- Meso-scale gentle to open folds were observed in the Jahazpur Group and Vindhyan Supergroup, but these structures disappeared 1-2 km away from the contact. View evidence ↗
- Wrench faulting along a WNW-ESE trend displaced the contact, resulting in the local abutment of Vindhyans and the juxtaposition of the Hindoli Group in the northeast. View evidence ↗
What it means
- The authors conclude that the deformation observed at the contact of the pre-Vindhyan and Vindhyan rocks represents a fault damage zone associated with the GBF. View evidence ↗
- Based on the presence of drag folds and other meso-scale fault-related folds, the authors conclude that the most recent major reactivation of the GBF occurred as a reverse fault. View evidence ↗
- The authors note that the fault core zone was not observed at the surface and is likely located in the sub-surface. View evidence ↗
Visual summary
1 visualsIllustrations explain the paper; they do not show study data.
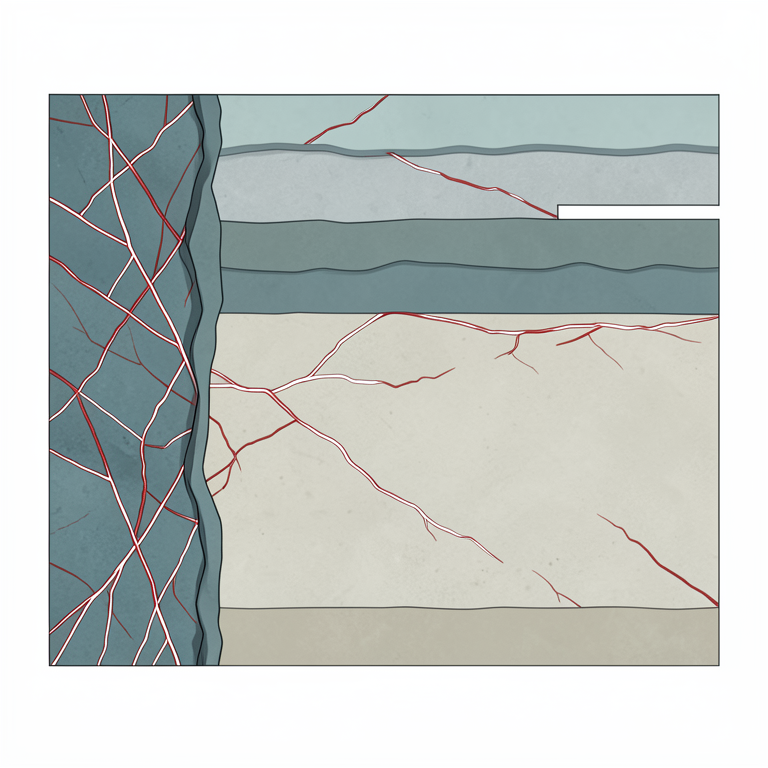
Fault Damage Zone Gradient
AI-generated conceptual illustration (Sedimentary rock layers of the Vindhyan Supergroup in Rajasthan). It explains the idea and does not show study data.
View source evidence ↗Figures & tables
From the original paper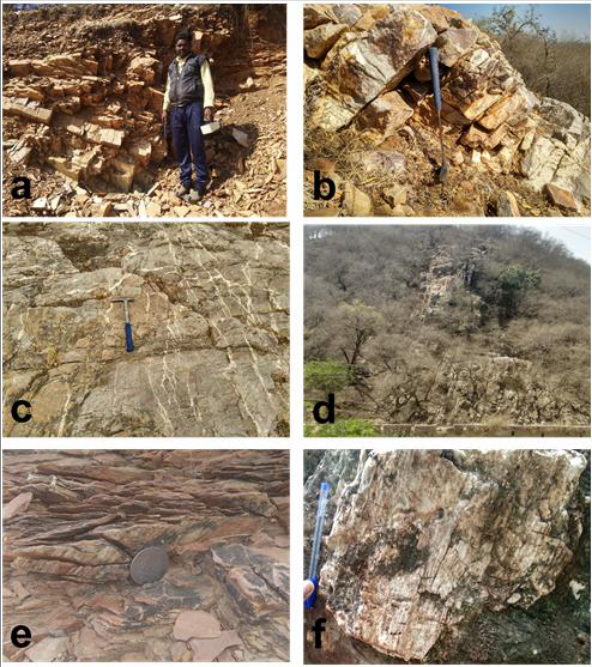 Figure 2
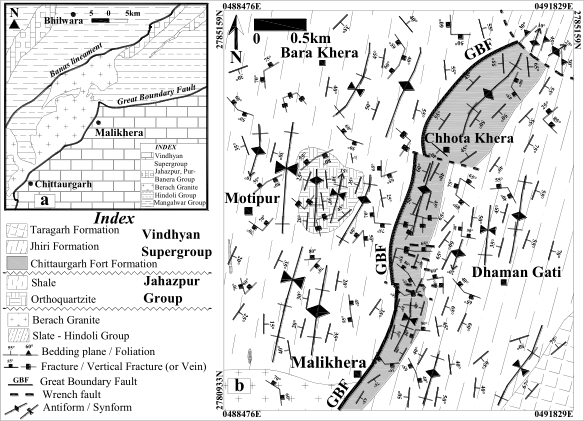 Figure 1
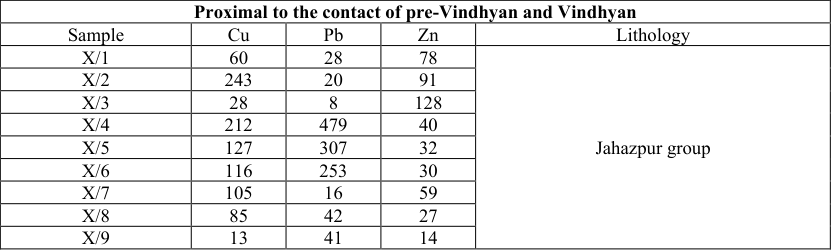 Table 1
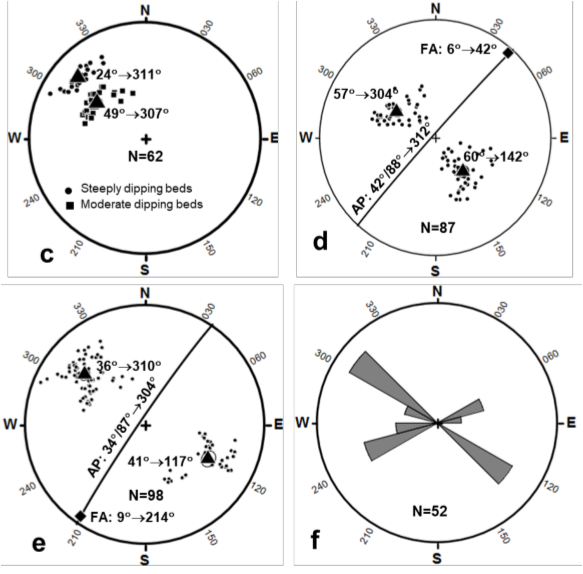 Figure 3
Introduction
Great Boundary Fault (or GBF) demarcates the north-western and western margin of the Vindhyan basin; over 400 km trending in NE-SW direction. It juxtaposes the pre-Vindhyans and Vindhyan Supergroup; wherein the pre-Vindhyans consist of Hindoli Group, Berach Granite and Jahazpur Group [1] . The Vindhyan Supergroup is generally considered to be undeformed strata of siliciclastic -carbonate -argillaceous sequence in the Son valley and Chambal sector but in Rajasthan sector the sedimentary has been variably deformed due to the GBF. Such deformational structures have been elucidated from Chittaurgarh and Sawai Madhopur area [2,3] but other area have not been studied in details so far. The present study focuses on the imprints of the deformation by GBF on the vindhyans from Motipur-Malikhera area, Bhilwara district, Rajasthan which is about 50km NE from Chittaurgarh area.
Geological setting
The study area (Figure 1a-b) falls in the south-eastern part of Rajasthan and comprises NNE-SSW trending long-linear ridges of Vindhyan Supergroup which abates locally in the north against the peneplained Hindoli Group. The Jahazpur Group and Berach Granite are exposed to the west of the ridge in small hillocks and mounds. Hindoli Group is composed of slate with thin quartzite lenses. Berach Granite is coarse grained with abundant quartz, grey feldspar and minor biotite marked by ferruginisation and kaolinisation. Jahazpur Group consists of shale with interbedded orthoquartzite which manifest planar lamination and cross-stratification. Vindhyan Supergroup consists of shale-sandstone sequence of Chittaurgarh Fort, Jhiri and Taragarh Formation. Chittaurgarh Fort Formation is dominantly arenaceous and composed of mostly quartz along with subordinate heavies exhibiting planar to trough cross-stratification. Jhiri Formation is argillaceous dominated by red shale with interbedded thin lenses of siltstone. The Taragarh Formation is arenaceous as Chittaurgarh Fort but is massive lacking sedimentary structure except for presence of thin lamination.
Imprints of GBF in study area
Study area lacks direct evidence of fault zone such as gouge or mylonite but the contact of pre-Vindhyan and Vindhyan has been subjected to fracturing, venation with slickenfibers, change in dip of bedding along with folding and wrench faulting (Figure 2a-f). Geochemical study through X-Ray Fluorescence (Table 1) shows presence of Cu (av., 85ppm), Pb (av., 87ppm) and Zn (av., 150ppm) within the ferruginised and silica veined samples (n=16) along the contact in contrast to samples away from the contact (n=18) with Cu (av., 14ppm), Pb (av., 6ppm) and Zn (av., 34ppm). Bedding has been steepened along the contact in respect to the beds away from it on either E or W direction. Steepening is mostly prominent in Vindhyans rather than in Jahazpur Group with the sandstone attending sub-vertical dip adjacent to the contact (Figure 3c). Numerous meso-scale gentle to open folds are prevalent in Jahazpur Group and Vindhyan Supergroup which are of non-plunging to gently plunging nature with steeply inclined to upright axial plane striking parallel to the contact in NE-SW or NNE-SSW trend (Figure 3d-e). These folds cease to exist after 1-2 km from the contact.
| Proximal to the contact of pre-Vindhyan and Vindhyan | — | — | — | — |
|---|---|---|---|---|
| Sample | Cu | Pb | Zn | Lithology |
| X/1 | 60 | 28 | 78 | Jahazpur group |
| X/2 | 243 | 20 | 91 | |
| X/3 | 28 | 8 | 128 | |
| X/4 | 212 | 479 | 40 | |
| X/5 | 127 | 307 | 32 | |
| X/6 | 116 | 253 | 30 | |
| X/7 | 105 | 16 | 59 | |
| X/8 | 85 | 42 | 27 | |
| X/9 | 13 | 41 | 14 |
Table text extracted from the original PDF; superscript letters are shown inline. The original table image is below.
View original table image
Wrench faulting displaces the contact along WNW-ESE and has leads to local abutment of Vindhyans with juxtaposition of Hindoli Group in the NE portion. The WNW-ESE striking fracture set (Figure 3f) is prominent in proximity of these faults. Additionally, small-scale fault related asymmetric folds have been observed at terminal portions of these faults with horizontal fold axis and inclined axial plane striking along NNE-SSW.
Conclusion
The pre-Vindhyan and Vindhyan contact is marked by a narrow zone of systematic fracture sets associated with ferruginisation and silica veins. This indicates that it has suffered brittle-scale deformation due to shearing advent by movement along GBF and circulation of hydrothermal solution through the inter-connected secondary voids. The hydrotherms fixate Cu, Pb and Zn within the slivered and fracture zone along the contact. Small-scale slickenline and slickenfiber indicate incremental movement along the fault plane associated with block adjustment during the fault propagation. Asymmetric steepening of the beds along the adjoining contact pronounced in Vindhyans coupled with numerous small-scale folds is indicative of dragging and associated fault related fold due to the movement of GBF. Wrench fault have been the product of variable rate of propagation and displacement of the fault which have been re-activated later displacing the contact as well as main fault zone.
A fault zone comprises of two parts; a core with characteristic gouge and cataclasite development and the other part is the damage zone with fracturing and venation. Thus, the deformational signatures along the contact of pre-Vindhyan and Vindhyans from study area are indicative of part of fault related deformation or fault damage zone. This means that the core zone could be possibly present in the sub-surface with transition from brittle regime to a brittleductile regime. Further, as drag folds and other associated meso-scale fault related folds are profound in the study area; it indicates that the latest major re-activation of GBF is in form of a reverse fault as has been reported from Chittaurgarh sector [1] . Low-T hydrothermal solution en-circulate through the fracture system causing the iron oxide bleaching along with fixation of Cu, Pb and Zn. Initial wrenching may be resulting from non-uniform propagation of fault tip line as in case for most large-scale faults [4] . Later, these wrench fault are re-activated causing the displacement of the major fault zone representing the last stage of deformation.
Acknowledgement
Acknowledgement:The authors are grateful to the Director, Atomic Minerals Directorate for Exploration and Research for his guidance and encouragement. The authors wish to immensely acknowledge the support of all the colleagues, directly and indirectly associated with this study.
Figures and tables from the paper
References
4 in the original paper- Sinha-Roy S, Malhotra G, Mohanty M. Geology of Rajasthan. 1st ed. Bangalore: Geological Society of India; 1998. p. 278.
- Sahay A, Srivastava DC. Ductile shearing along the Great Boundary Fault: an example from the Berach River section, Chittaurgarh, Rajasthan. Curr Sci. 2005;88(4):557-560.
- Choudhuri AR, Guha DB. Evolution of the Great Boundary Fault: a re-evaluation. J Geol Soc India. 2004;64(1):21-31.
- Fossen H. Structural geology. 1st ed. Cambridge: Cambridge University Press; 2016. p. 481.