
Research article · 2026 · Full text
International Journal of Geography Geology and EnvironmentThe changing voting trend in assembly election Haryana a geographical analysis (2009-2014)
Volume 8(1) · Pages 77–82 · DOI: 10.22271/27067483.2026.v8.i1a.833 ↗
Research areasElectoral Systems and Political ParticipationSouth Asian Studies and ConflictsIndian Economic and Social Development
Abstract
Author-writtenIn the Indian democracy, the changing pattern of voting trends significantly affects the evolving political scenario in the electoral process. Haryana's political landscape has been profoundly shaped by regionalism and dynastic politics, influencing voting behaviour and contributing to a democratic deficit in the state. The state has witnessed the dominance of political families, which has fostered a culture of leadership continuity within family circles rather than ideological evolution or policy-based governance. This paper analyses the changing voting trend in Haryana assembly elections from 2009 to 2014, a period that marked a watershed transformation in the state's political history. The analysis relies on secondary data sources, including records from the Election Commission of Haryana, related research papers, and newspaper reports, which collectively reveal the modern change scenario of political parties and their electoral performance in Haryana. The statistical data of the changing voting trend is presented with the help of line graphs, bar diagrams, and tables using MS Excel. The study area map and voting seat distribution are shown using QGIS software. This paper mainly focuses on the changing voting trend from 2009 to 2014 due to the changing political scenario and people's shifting perspectives towards political parties. The electoral landscape of Haryana underwent a dramatic transformation between 2009 and 2014, reflecting significant socio-economic and political changes in the state. This period witnessed the meteoric rise of the Bharatiya Janata Party (BJP) and the simultaneous decline of the Indian National Congress (INC), Indian National Lok Dal (INLD), and other regional parties. The changing voting trend is attributed to factors such as religion, caste dynamics, urbanization, and the growing influence of national political narratives over regional identities.
Summary
Source-checkedPlain-language reading of the full paper, prepared with AI and checked against the text. Each point links to the authors' own words.
Why it matters
- Haryana's political environment has been heavily influenced by dynastic politics and regionalism, which the authors suggest has led to a democratic deficit. View evidence ↗
- The dominance of political families in Haryana has prioritized leadership continuity within families over policy-based governance or ideological growth. View evidence ↗
- The period between 2009 and 2014 is identified as a time of dramatic transformation in Haryana's electoral landscape, mirroring broader socio-economic and political shifts. View evidence ↗
The question
- The primary goal of the research is to analyze how voting trends changed during the Haryana Assembly elections between 2009 and 2014. View evidence ↗
What they did
- The study utilized secondary electoral data sourced from the official records of the Election Commission of India and the Election Commission of Haryana. View evidence ↗
- Data was analyzed and visualized using MS Excel for tables and graphs, and QGIS software for mapping the spatial distribution of voting seats. View evidence ↗
- To understand spatial changes, the researchers divided the analysis of Haryana into its various administrative divisions. View evidence ↗
What they found
- The BJP experienced a massive increase in seats, growing from 4 seats in 2009 to 47 seats in 2014, representing a growth of over 1075%. View evidence ↗
- The INLD, which held 31 seats in 2009, lost 12 seats to end up with 19 seats in 2014. View evidence ↗
- The Ambala Division showed the most dramatic change, where the BJP's seat count rose from 1 in 2009 to 13 in 2014. View evidence ↗
- In the Rohtak Division, a traditional Congress stronghold, the BJP increased from 1 to 10 seats, while the INC dropped from 15 to 4 seats. View evidence ↗
- In the Hisar Division, the BJP rose from 1 to 11 seats, while the INLD fell from 10 to 6 and the INC fell from 7 to 2. View evidence ↗
- The BJP's success is attributed in part to a strategy of fielding non-Jat candidates, which consolidated non-Jat votes in a state previously characterized by Jat dominance. View evidence ↗
What it means
- The authors conclude that the electoral shift was driven by a mix of national factors (the Modi wave and anti-corruption sentiment) and state factors (anti-incumbency against the Hooda government and the BJP's non-Jat coalition). View evidence ↗
- The authors conclude that the BJP's 2014 victory was a statewide phenomenon rather than being limited to specific regions. View evidence ↗
Visual summary
3 visualsIllustrations explain the paper; charts are replotted from the paper's own table values.
Electoral Shift Comparison
AI-generated conceptual illustration (A map of Haryana state, India). It explains the idea and does not show study data.
View source evidence ↗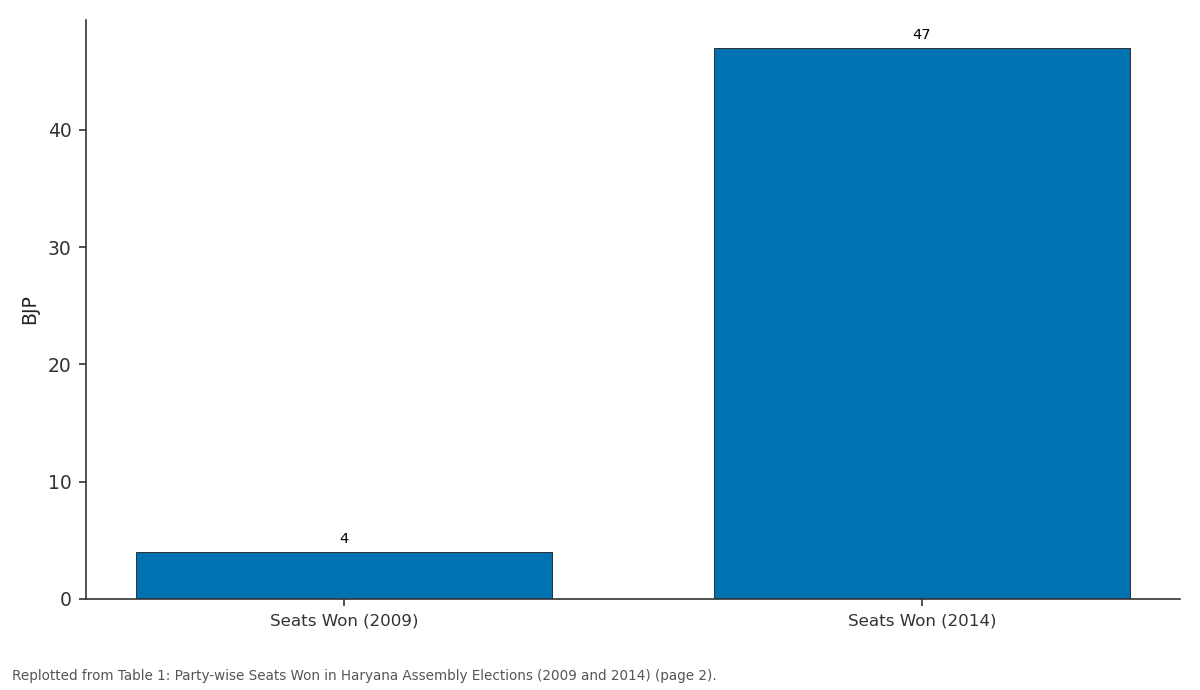
BJP: Seats Won (2009) vs Seats Won (2014)
Replotted from Table 1 (page 2) of the original paper. Every bar is the paper's own table value.
View source evidence ↗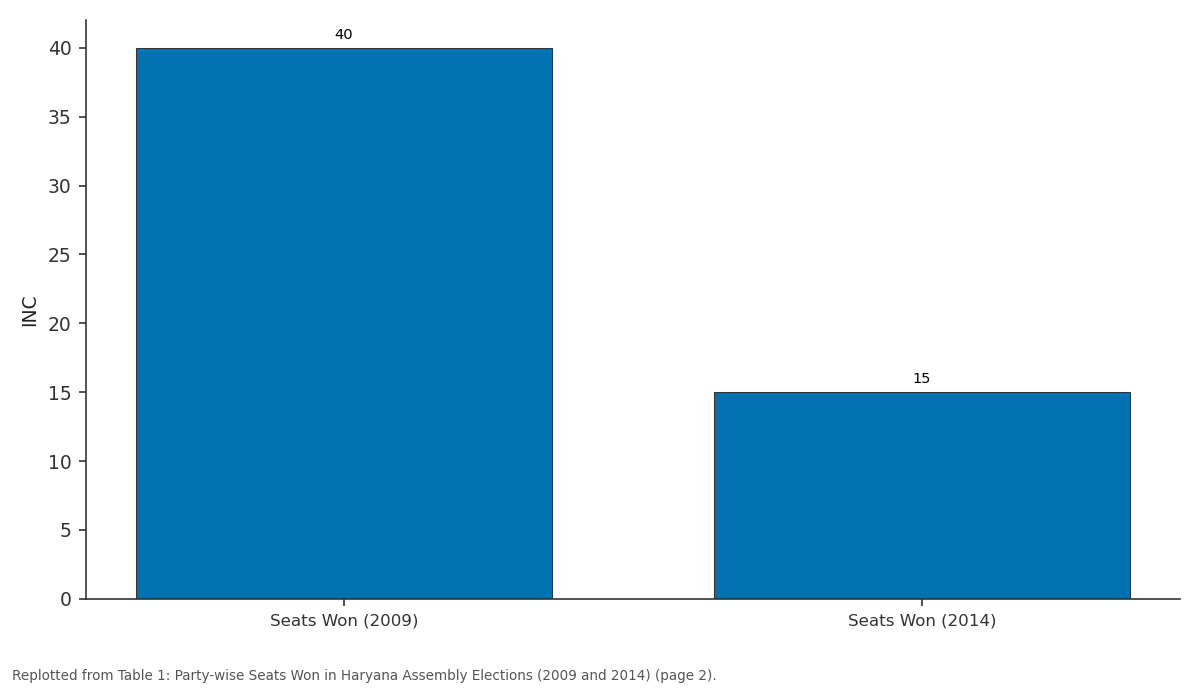
INC: Seats Won (2009) vs Seats Won (2014)
Replotted from Table 1 (page 2) of the original paper. Every bar is the paper's own table value.
View source evidence ↗Figures & tables
From the original paper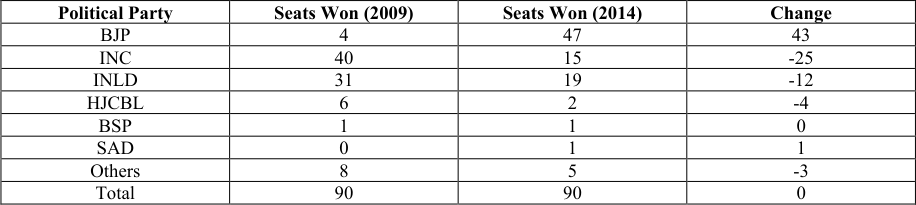 Table 1
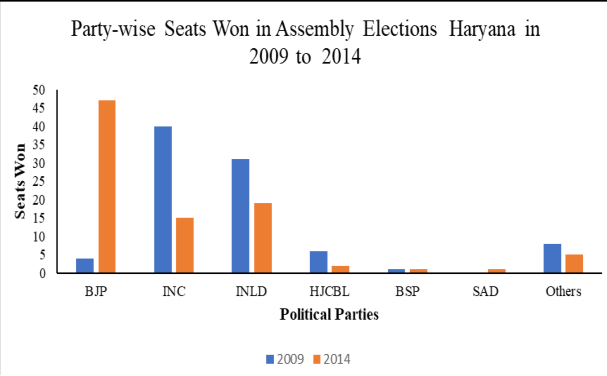 Figure 1
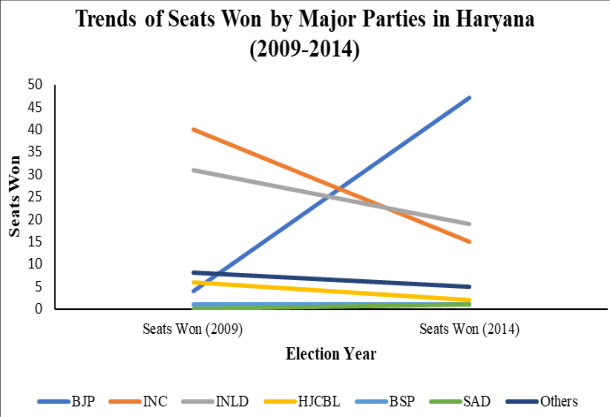 Figure 2
 Table 2
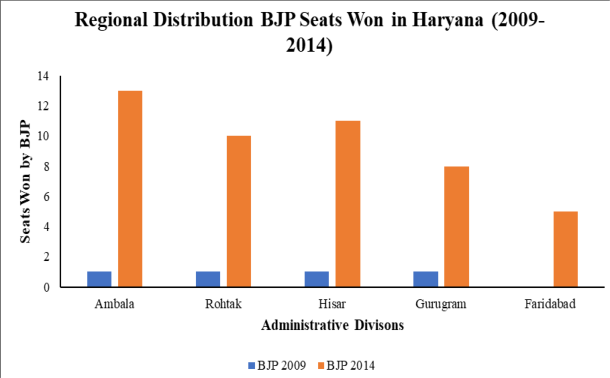 Figure 3
Introduction
Haryana, carved out of the erstwhile state of Punjab on 1st November 1966, has been a crucial battleground in Indian electoral politics. Despite being a relatively small state with 90 assembly constituencies, Haryana has consistently played an outsized role in shaping national political narratives. The state's political culture has been characterized by the dominance of a few powerful political families and caste-based affiliations, which have significantly influenced electoral outcomes over the decades. The Congress party dominated the state's politics for several decades after its creation, with intermittent challenges from regional forces and the Janata Party during the post-Emergency period. The electoral history of Haryana reveals a pattern of anti-incumbency and shifting loyalties among voters. From the era of Bhagwat Dayal Sharma and Bansi Lal in the early years, to the long dominance of Bhajan Lal, and subsequently the rise of Om Prakash Chautala and the INLD, the state has seen power oscillate between different political formations. The entry of the Haryana Janhit Congress (HJC) under Kuldeep Bishnoi in 2007 added another dimension to the already complex political landscape. However, the most dramatic shift in Haryana's political trajectory occurred during the period under study, from 2009 to 2014, when the BJP transformed from a marginal player with just 4 seats in the 2009 assembly elections to the single largest party with 47 seats in 2014. The 2009 assembly elections in Haryana were held in the backdrop of the Congress-led UPA government at the centre, and the party managed to emerge as the single largest party with 40 seats, though falling short of a clear majority. The INC formed the government under the leadership of Bhupinder Singh Hooda with the support of independents and other smaller parties. The INLD, led by Om Prakash Chautala, secured 31 seats to become the principal opposition party. The BJP, despite being a major national party, could manage only 4 seats, reflecting its limited organizational presence and electoral appeal in the state at that time. The HJC won 6 seats, while the BSP managed 1 seat, and independents and others won the remaining 8 seats. The period between 2009 and 2014 was marked by several significant developments that fundamentally altered the political calculus in Haryana. The anti-corruption movement led by Anna Hazare and the subsequent rise of the Aam Aadmi Party created a nationwide wave against the incumbent Congress governments. The Narendra Modi factor, coupled with the BJP's aggressive campaign strategy and the promise of development and good governance, resonated strongly with the electorate in Haryana. Additionally, the BJP's strategy of fielding non-Jat candidates in a state where Jat dominance had been a persistent feature of politics proved to be a masterstroke, as it consolidated non-Jat votes across castes and communities in favour of the party. The 2014 assembly elections thus represented a tectonic shift in Haryana's political landscape. The BJP's tally of 47 seats was more than eleven times its 2009 count, while the INC was reduced from 40 to just 15 seats, and the INLD from 31 to 19 seats. This dramatic reversal warrants a detailed geographical analysis to understand the spatial patterns of voting behaviour change, the regions where the shift was most pronounced, and the factors that contributed to this electoral transformation. The present study attempts such an analysis by examining the trends and patterns of seats won by different political parties across the geographical expanse of Haryana during this critical period. • To understand the factors responsible for the dramatic shift in voting behaviour during this period.
Objectives of the Research
Objectives of the Research
Research Methodology
The present study is primarily based on secondary data sources. The electoral data for the 2009 and 2014 Haryana Assembly elections has been obtained from the official records of the Election Commission of Haryana and the Election Commission of India. Additionally, related research papers, published articles, newspapers, and statistical reports have been consulted to provide a comprehensive analysis of the changing voting trends. The statistical data of the changing voting trend is presented with the help of line graphs, bar diagrams, and tables prepared using MS Excel. The study area map and voting seat distribution are shown using QGIS software, which enables spatial visualization of the electoral patterns across different administrative divisions and districts of Haryana.
The research methodology adopted for this study follows a quantitative approach to analyse the electoral data. The party-wise seat distribution for both election years has been tabulated and compared to identify the magnitude and direction of change. Bar diagrams have been used to provide a visual comparison of seats won by different political parties in the two elections. Line graphs depict the trends of seats won by the major political parties, highlighting the trajectories of growth and decline. The consistency analysis examines how many constituencies were retained, lost, or newly gained by each major party across the two elections.
The regional analysis divides Haryana into its administrative divisions to understand the spatial dimensions of electoral change. The choropleth mapping technique through QGIS has been employed to represent the spatial patterns of voting behaviour across the state, providing a geographical perspective on the electoral transformation.
Trends of Seats Won
The analysis of trends of seats won by different political parties in the Haryana Assembly elections of 2009 and 2014 reveals a dramatic transformation in the state's electoral landscape. The most striking feature of this period is the meteoric rise of the BJP and the corresponding decline of the INC and INLD. The data presented in Table 1 and Figure 1 clearly illustrates the magnitude of this electoral shift. As evident from Table 1 the BJP's seat count witnessed an extraordinary increase from a mere 4 seats in 2009 to 47 seats in 2014, registering a phenomenal growth of over 1075 percent. This is perhaps one of the most dramatic electoral turnarounds in the history of any state assembly election in India. The BJP, which was virtually a non-entity in Haryana's assembly politics in 2009, became the dominant force within a span of just five years. The party not only increased its seat share but also expanded its geographical spread across the state, winning seats in regions where it had traditionally been weak. The Indian National Congress, which had emerged as the single largest party in 2009 with 40 seats, suffered a devastating defeat in 2014, losing 25 seats and being reduced to just 15 seats. This represents a decline of 62.5 percent in the party's seat tally. The Congress's decline can be attributed to multiple factors, including anti-incumbency against the Bhupinder Singh Hooda government, allegations of corruption, failure to address the concerns of various caste groups, and the nationwide Modi wave that swept across northern India. The party's traditional support base among Jat voters was also eroded as the BJP successfully consolidated non-Jat votes against what was perceived as Jat-dominated Congress rule. The Indian National Lok Dal (INLD), the principal opposition party in 2009 with 31 seats, also suffered a significant setback in 2014, losing 12 seats and being reduced to 19 seats. The decline of the INLD can be attributed to the incarceration of its top leadership, including Om Prakash Chautala, in the teachers' recruitment scam, which severely damaged the party's credibility and organizational capacity. The absence of charismatic leadership and the inability to present a viable alternative to both the Congress and the BJP further weakened the party's electoral prospects. The Haryana Janhit Congress (BL), which had won 6 seats in 2009, could manage only 2 seats in 2014. The party's decline was a consequence of its failure to establish a distinct identity separate from the Congress and its inability to capitalize on the anti-incumbency sentiment. The Shiromani Akali Dal (SAD), which had not won any seat in 2009, opened its account with 1 seat in 2014, primarily from the Sikh-dominated areas bordering Punjab. The BSP maintained its single seat in both elections, while the category of 'Others' saw a decline from 8 seats in 2009 to 5 seats in 2014, as the BJP's rise absorbed many independent and smaller party votes.
| Political Party | Seats Won (2009) | Seats Won (2014) | Change |
|---|---|---|---|
| BJP | 4 | 47 | 43 |
| INC | 40 | 15 | -25 |
| INLD | 31 | 19 | -12 |
| HJCBL | 6 | 2 | -4 |
| BSP | 1 | 1 | 0 |
| SAD | 0 | 1 | 1 |
| Others | 8 | 5 | -3 |
| Total | 90 | 90 | 0 |
Table text extracted from the original PDF; superscript letters are shown inline. The original table image is below.
View original table image
Regional Analysis of Seats Won
The regional analysis of seats won in Haryana provides important insights into the geographical dimensions of the electoral transformation. Haryana is administratively divided into six divisions: Ambala, Rohtak, Hisar, Gurugram, Faridabad, and Karnal. Each division has its own distinct socio-economic and caste composition, which influences voting behaviour in significant ways. The regional distribution of BJP seats across these divisions reveals the party's broad-based appeal in 2014, as opposed to its limited presence in 2009. 3 present the regional distribution of seats won by the major political parties across the administrative divisions of Haryana. The Ambala Division, comprising the districts of Ambala, Panchkula, Yamunanagar, Kurukshetra, Kaithal, and Karnal, witnessed the most dramatic transformation with the BJP increasing its tally from just 1 seat in 2009 to 13 seats in 2014. The INC, which had held 8 seats in this division, was reduced to just 1 seat. This division, with its significant non-Jat population including Punjabis, Banias, and other trading communities, responded overwhelmingly to the BJP's developmentThe regional analysis thus reveals that the BJP's victory in 2014 was not confined to any particular region of Haryana but was spread across all divisions of the state. This geographical spread indicates that the factors driving the BJP's success were not limited to local or regional issues but had a statewide and indeed national character. The Modi wave, coupled with the BJP's strategic positioning on issues of governance, development, and caste dynamics, resonated across the diverse regions of Haryana, transcending the traditional fault lines of region, caste, and clan that had previously defined the state's electoral politics.
Conclusion
The period from 2009 to 2014 witnessed a tectonic shift in Haryana's electoral landscape, with the BJP emerging as the dominant political force from a position of virtual irrelevance. The party's seat count increased from 4 in 2009 to 47 in 2014, a growth of over 1075 percent, which is among the most dramatic electoral turnarounds in Indian state politics. This transformation was driven by a combination of national factors, including the Modi wave and the anti-corruption sentiment against the UPA government, as well as state-specific factors such as antiincumbency against the Hooda government and the BJP's strategic non-Jat coalition. The INC suffered the most significant decline, losing 25 of its 40 seats and being reduced to a distant second position with just 15 seats. The party's decline was not limited to any particular region but was spread across all divisions of the state, indicating a comprehensive rejection by the electorate. The failure to address governance issues, the perception of corruption, and the inability to counter the BJP's narrative all contributed to the Congress's downfall. The INLD, despite being the principal opposition party in 2009, also suffered a decline, losing 12 seats to end up with 19 seats in 2014. The party's inability to capitalize on the anti-incumbency against the Congress government was largely due to its own leadership crisis following the conviction of Om Prakash Chautala and Ajay Chautala in the teachers' recruitment scam. In terms of consistency of seats won, the INC retained only 10 out of its 40 constituencies, the INLD retained 12 out of 31, while the BJP retained only 2 out of 4, though the latter figure reflects the party's marginal status in 2009 rather than voter disloyalty. The BJP gained 45 new constituencies in 2014, demonstrating its expanded geographical reach across the state. The regional analysis reveals that the BJP's victory was not confined to any particular region but was spread across all administrative divisions of Haryana. The Ambala Division witnessed the most dramatic transformation, with the BJP increasing its tally from 1 to 13 seats. Even the Rohtak Division, the traditional stronghold of the Congress, saw the BJP winning 10 seats in 2014 compared to just 1 in 2009.
Figures and tables from the paper
| Division | BJP 2009 | BJP 2014 | INC 2009 | INC 2014 | INLD 2009 | INLD 2014 |
|---|---|---|---|---|---|---|
| Ambala | 1 | 13 | 8 | 1 | 4 | 4 |
| Rohtak | 1 | 10 | 15 | 4 | 6 | 5 |
| Hisar | 1 | 11 | 7 | 2 | 10 | 6 |
| Gurugram | 1 | 8 | 6 | 4 | 7 | 3 |
| Faridabad | 0 | 5 | 4 | 4 | 4 | 1 |
Table text extracted from the original PDF; superscript letters are shown inline. The original table image is below.
View original table image
References
26 in the original paper- Arnesen S, Bergh J, Christensen DA, Aardal B. Support for electoral system reform among voters and politicians: studying information effects through survey experiments. Electoral Stud. 2021;71:102313.
- Bala K, Singh S. Trends and patterns of seats won by the BJP in Indian parliamentary elections (1984-2004): a geographical analysis. Trans Inst Indian Geogr. 2014;36(1).
- Biswas F, Khan PN, Ahamed MF. A study of electoral dynamics and voting behavior from 2004 to 2019 in Lok Sabha elections of West Bengal. GeoJournal. 2021;87(5):4363-4389.
- Butler D, Rao P. India decides: Elections 1952-1991. New Delhi: L.M. Books; 1991.
- Butler D, Lahiri Roy P. Elections in India: Who decides (1952 & 1991). New Delhi: L.M. Books; 1991.
- Chhibber PK, Verma R. Ideology and identity: The changing party systems of India. New Delhi: Oxford University Press; 2018.
- Chhibber P, Verma R. The rise of the second dominant party system in India: BJP's new social coalition in 2019. Stud Indian Polit. 2019;7(2):131-148.
- Das Gupta B, Jones M. Patterns and trends in Indian politics: An ecological analysis of aggregate data on society and election. New Delhi: Allied Publishers; 1977.
- Das Gupta B, Jones WHM. Patterns and trends in Indian politics. New Delhi: Allied Publishers; 1975.
- Dikshit RD, Sharma JC. Electoral performances of the Congress Party in Punjab (1952-1977). Trans Inst Indian Geogr. 1982;4:1-15.
- Dikshit SK. Electoral geography of India: With special reference to Sixth and Seventh Lok Sabha elections. Allahabad: Vishwavidyalaya Prakashan; 1993.
- Dikshit RD, Singh S. Friends and neighbours influence in Indian elections: A case of rural voting in the Sonepat parliamentary constituency, 1989. Asian Profile. 1993;21(6):483-493.
- Dikshit RD. Geography of elections: The Indian context. Jaipur: Rawat Publications; 1995.
- Election Commission of India. Statistical report on general election to the Legislative Assembly of Haryana. New Delhi: Election Commission of India; 2009.
- Election Commission of India. Statistical report on general election to the Legislative Assembly of Haryana. New Delhi: Election Commission of India; 2014.
- Goswami S. Changing electoral trends. Econ Polit Wkly. 2001;36(19):1584-1586.
- Hussain MS, Ijaz K, Haq MAU. Electoral politics of District Khushab: A comparative analysis of 2013 and 2018 elections. Orient Res J Soc Sci. 2023;8(1):38-49.
- Jaffrelot C, Kalaiyarasan A. The political economy of the Jat agitation for Other Backward Class status. Econ Polit Wkly. 2019;54(7):29-37.
- Jodhka SS. The Haryana State Assembly Elections 2019. Econ Polit Wkly. 2019;54(50):17-21.
- Kailash KK. Regional parties in the 16th Lok Sabha elections: Who survived and why? Econ Polit Wkly. 2014;49:64-71.
- Kulachai W, Lerdtomornsakul U, Homyamyen P. Factors influencing voting decision: A comprehensive literature review. Soc Sci. 2023;12(9):469.
- Kumar A. Rethinking state politics in India: Regions within regions. Econ Polit Wkly. 2009;44:14-19.
- Kumar A. Assembly elections 2009 in Haryana: Exploring the verdict. Econ Polit Wkly. 2010;45:19-21.
- Kumar S, Kumar A. Voting behaviour in Haryana Lok Sabha Election-2009. Int J Phys Soc Sci. 2013;3(1):370-383.
- Pal K, Mishra J. Continuity and change in Haryana politics: Lok Sabha and Assembly elections, 2019. In: Electoral dynamics in the states of India. New Delhi: Routledge India; 2021. p. 57-74.
- Yadav Y. The BJP's electoral victory in Haryana: A critical analysis. J Indian Polit. 2015;3(1):45-62.