
Research article · 2026 · Full text
International Journal of Geography Geology and EnvironmentIdentification of groundwater potential zone of Handri river basin using geospatial techniques: Kurnool district, Andhra Pradesh
Volume 8(7) · Pages 188–200 · DOI: 10.22271/27067483.2026.v8.i7b.832 ↗
Research areasGroundwater and Watershed AnalysisSoil and Land Suitability AnalysisWater Quality and Pollution Assessment
Abstract
Author-writtenGroundwater is a critical natural resource sustaining agricultural, domestic, and industrial needs, particularly in semi-arid regions where surface water is scarce. The Handri River basin in Kurnool District, Andhra Pradesh, India, faces acute water scarcity challenges, making the identification and management of groundwater potential zones of paramount importance for sustainable development and water security. This study seeks to identify and delineate groundwater potential zones (GWPZs) in the Handri River basin using an integrated geospatial approach. This study used remote sensing (RS), geographic information systems (GIS), and analytical hierarchical processing (AHP) methods. Various thematic maps were produced to assess potential groundwater areas, including land use and cover, geomorphology, lineament density, geology, drainage density, slope, and soil. This map was created using RS and GIS techniques. The AHP approach was used to assign relative weights to the thematic maps and determine the ranking of each sub-criterion based on expert advice. The groundwater potential zone map was created by combining seven thematic layers in ArcGIS. This map provides information on the distribution of groundwater potential areas, including high (26% or 131.60 km2), moderate (12.76% or 452.56 km2), low (63.47% or 2250.75 km2), and the least (15.99% or 567.16 km2). work It is a very poor area (5.32%, or 188.73 km2). The accuracy of the results was verified with 85% accuracy using bore hole observation data. However, yields were reduced in areas with low water potential. In conclusion, the AHP model has proven to be a reliable method for assessing groundwater potential. Groundwater management programs implemented in these favourable areas will be of great benefit to stakeholders.
Summary
Source-checkedPlain-language reading of the full paper, prepared with AI and checked against the text. Each point links to the authors' own words.
Why it matters
- Groundwater is essential for agriculture, industry, and domestic use, especially in semi-arid areas where surface water is limited. View evidence ↗
- The Handri River basin in Andhra Pradesh, India, suffers from severe water scarcity, necessitating the identification of groundwater potential zones for water security. View evidence ↗
The question
- The study aims to map and define groundwater potential zones (GWPZs) in the Handri River basin using geospatial techniques. View evidence ↗
What they did
- The researchers employed an integrated approach combining remote sensing (RS), geographic information systems (GIS), and analytical hierarchical processing (AHP). View evidence ↗
- Seven thematic layers were analyzed: land use and cover, geomorphology, lineament density, geology, drainage density, slope, and soil. View evidence ↗
- The study area encompasses a total of 3,548 km² within the Handri River basin. View evidence ↗
- The resulting map was validated using borehole yield data from 20 observation wells provided by the Central Ground Water Board (CGWB). View evidence ↗
What they found
- The basin's groundwater potential is distributed as high (26% or 131.60 km²), moderate (12.76% or 452.56 km²), low (63.47% or 2250.75 km²), and very poor (5.32% or 188.73 km²). View evidence ↗
- Validation showed that wells in low/very low zones yielded 10-40 LPM, moderate zones yielded 40-80 LPM, and high zones yielded over 80 LPM. View evidence ↗
- The groundwater potential mapping achieved an accuracy of 85%, with 17 out of 20 boreholes agreeing with the results. View evidence ↗
What it means
- The authors conclude that the Analytical Hierarchy Process (AHP) model is a reliable method for assessing groundwater potential. View evidence ↗
- The resulting map is recommended as a tool for policymakers to plan and manage groundwater for urban and agricultural purposes. View evidence ↗
- Study limitations include the 30m resolution of Landsat 8 imagery, the subjectivity of expert-based AHP weights, a small validation set of 20 wells, and the lack of temporal or seasonal data. View evidence ↗
Visual summary
2 visualsIllustrations explain the paper; charts are replotted from the paper's own table values.
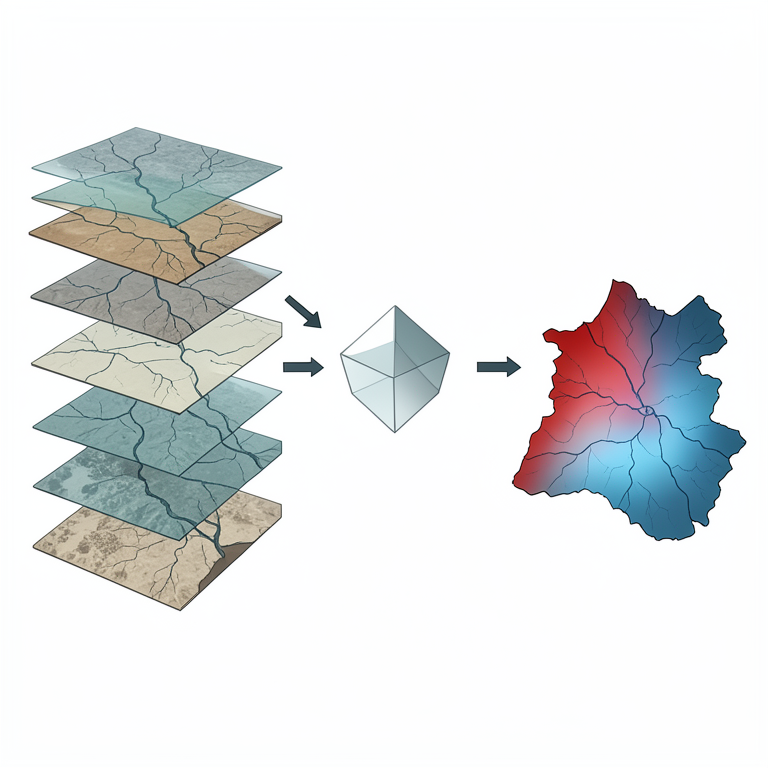
Integrated Geospatial Workflow
AI-generated conceptual illustration (Handri river basin landscape in Kurnool district). It explains the idea and does not show study data.
View source evidence ↗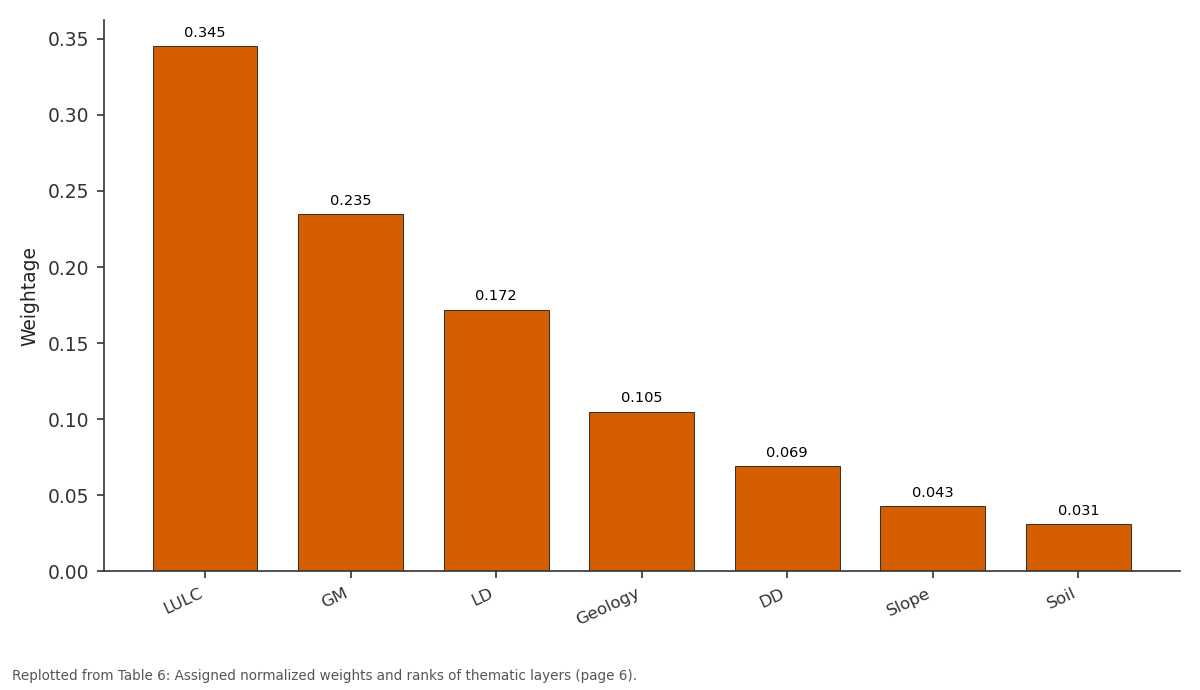
Weightage: LULC vs GM vs LD vs Geology vs DD
Replotted from Table 6 (page 6) of the original paper. Every bar is the paper's own table value.
View source evidence ↗Figures & tables
From the original paper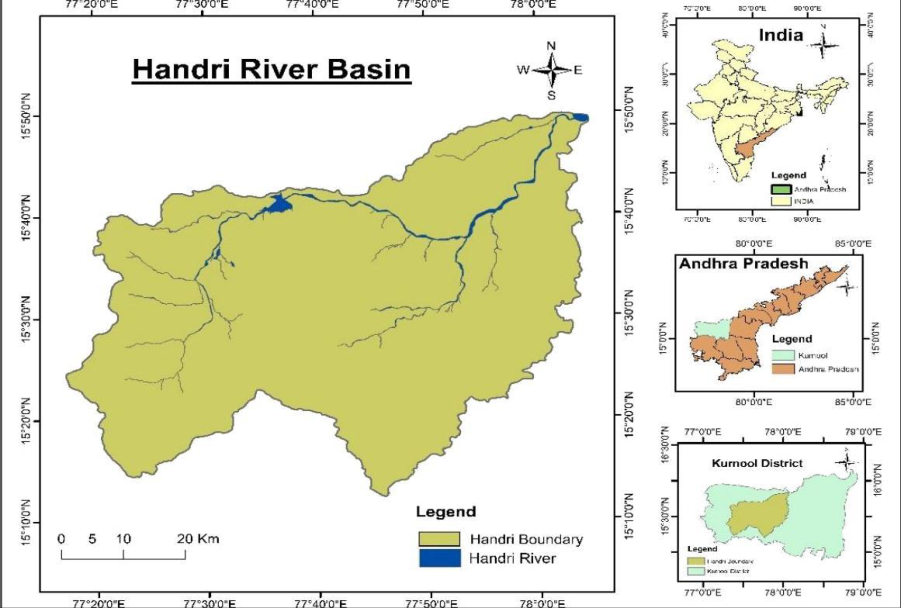 Figure 1
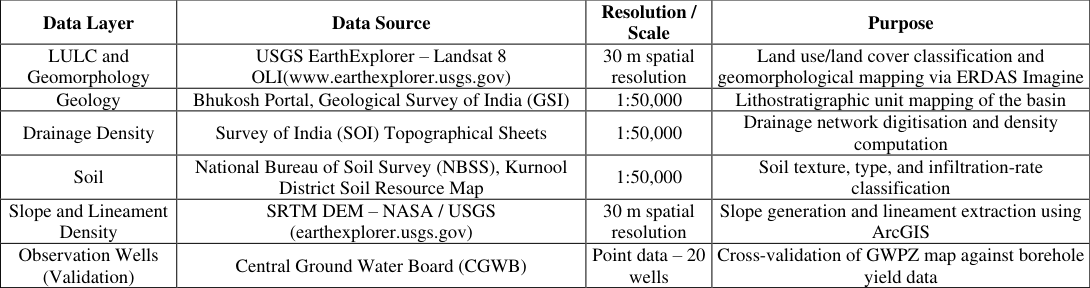 Table 1
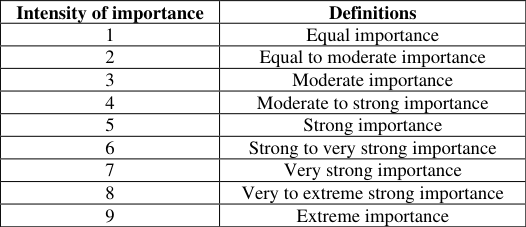 Table 2
 Table 3
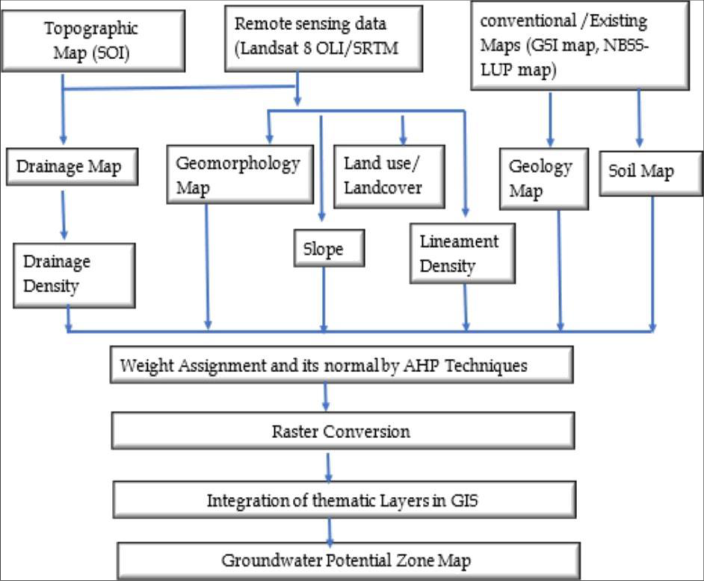 Figure 2
 Table 4
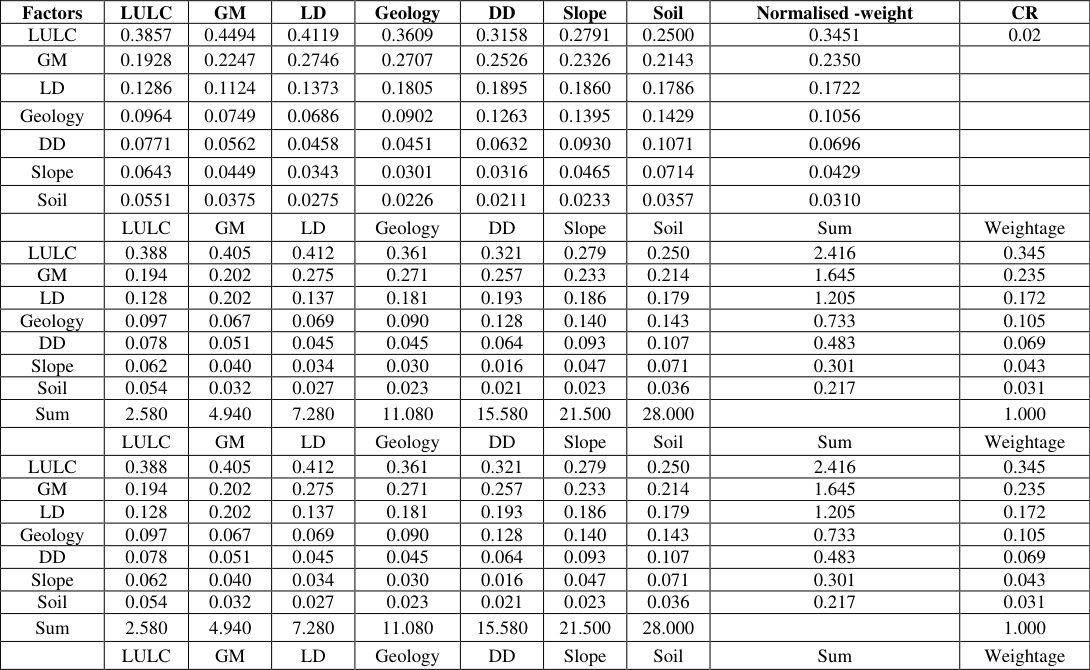 Table 5
 Table 6
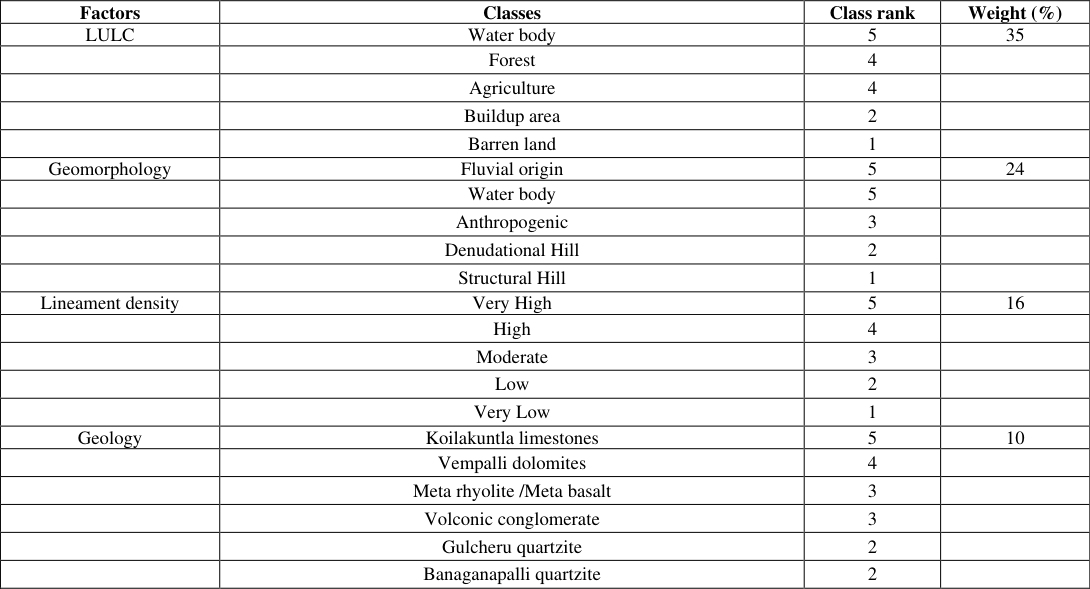 Table 6
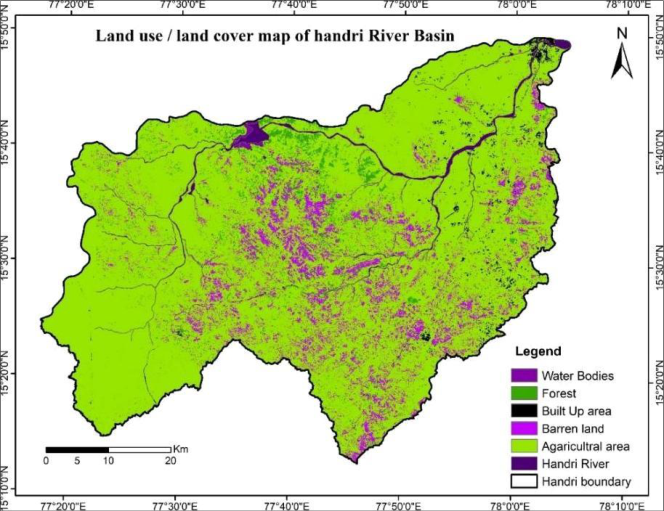 Figure 3
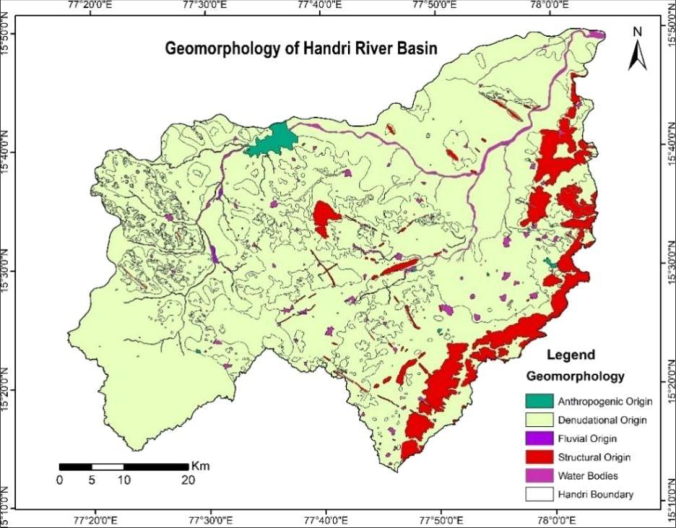 Figure 4
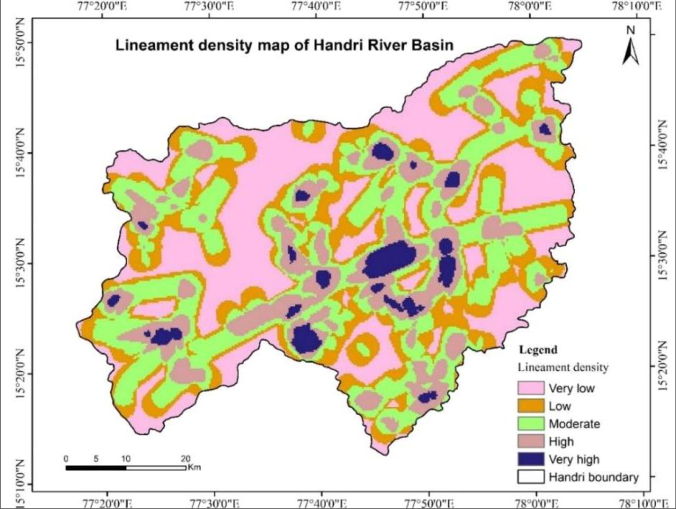 Fig. 5
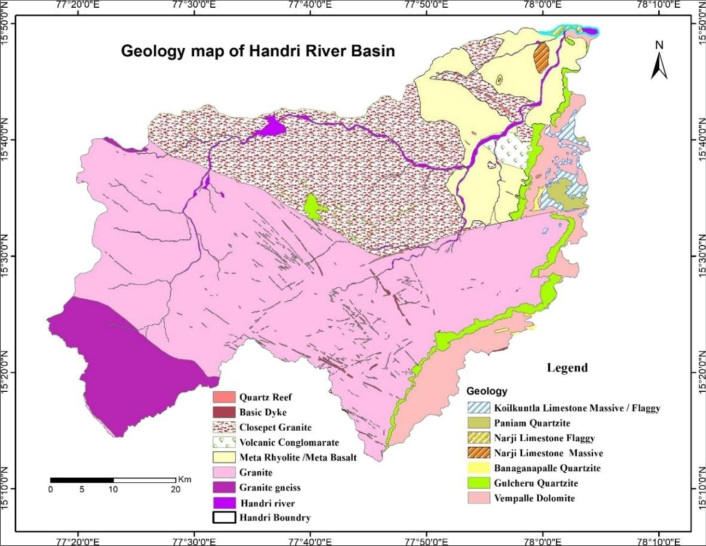 Figure 6
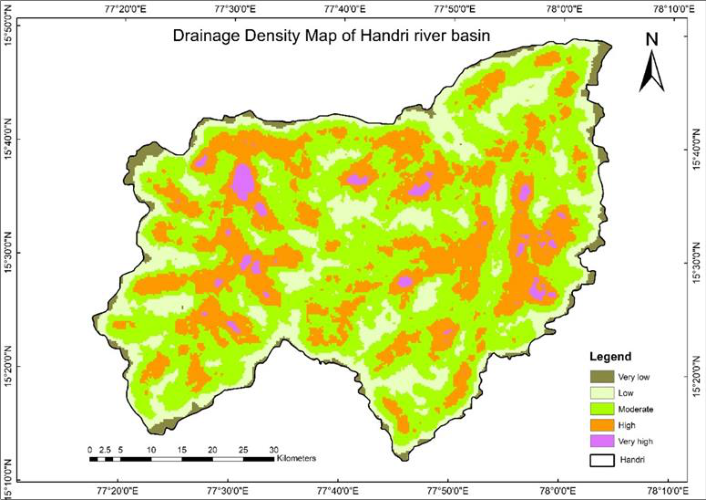 Figure 7
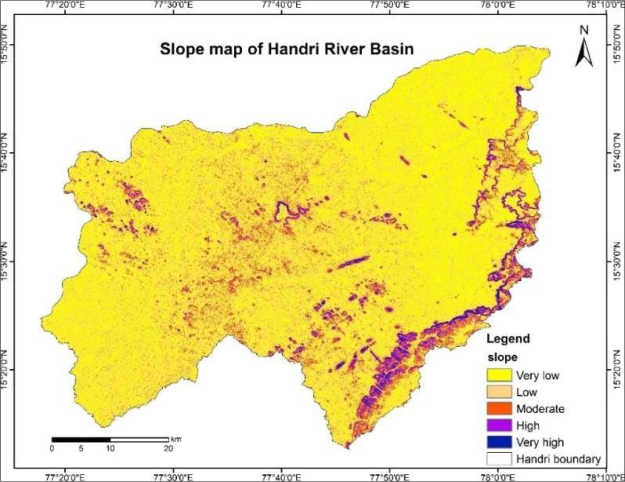 Figure 8
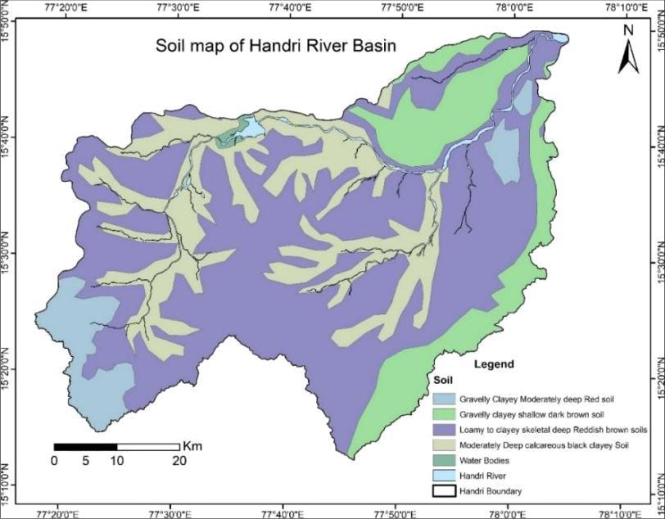 Figure 9
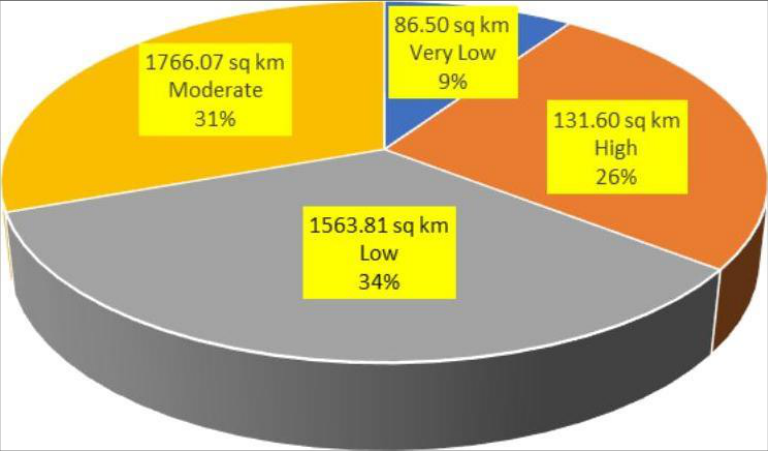 Figure 10
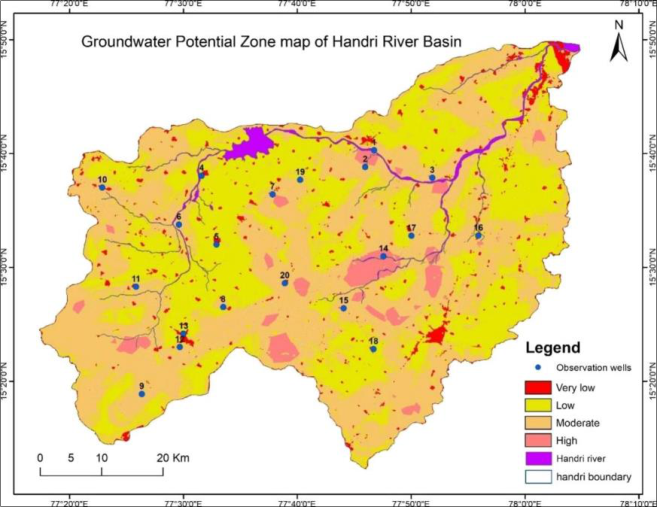 Figure 11
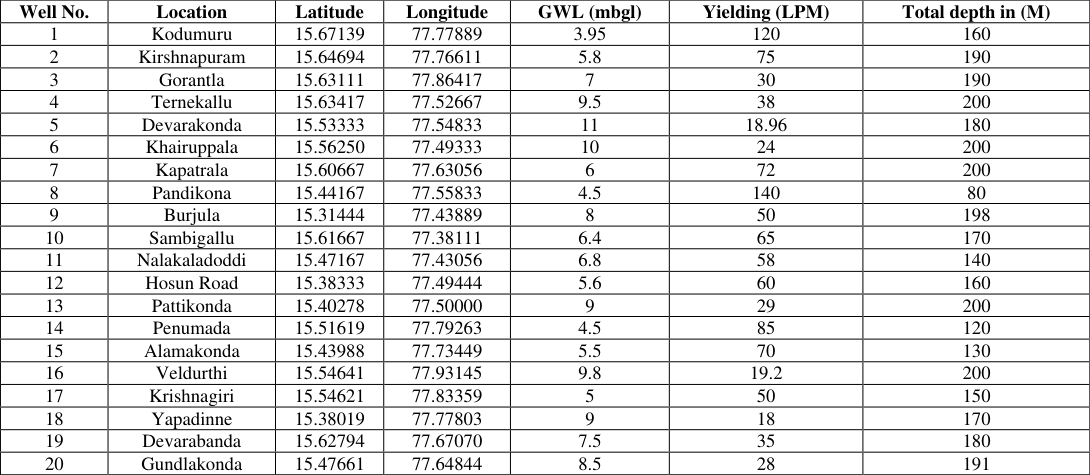 Table 7
Introduction
Groundwater, a crucial natural resource, is stored in subsurface geological formations within the critical zone of the earth's crust. It plays a vital role as a water source for various purposes, such as domestic, industrial, agricultural, and developmental initiatives. Groundwater is stored beneath the ground's surface in small pore spaces between rock, sand, soil, and gravel. It exists in two distinct zones: an upper unsaturated zone, primarily filled with air, and a deeper saturated zone, where all pore spaces are filled with water. The depth of the water table can vary from a few feet to several hundred feet below the ground surface (Harter, 2003; Nampak et al., 2014; Rajasekhar et al., 2022) [1][2][3] . The continuously growing need for water to fulfil human needs and advancements has placed significant stress on this finite freshwater resource. The presence and allocation of groundwater rely on diverse natural and human-induced factors (Saraf and Choudhury, 1998) [4] . According to the United Nations Environment Programme (UNEP, 2021) [5] , over 2 billion individuals are projected to experience significant water stress by 2050. This alarming statistic is expected to obstruct the progress and growth of numerous nations globally (Boretti et al., 2019) [6] . A delineated map of groundwater zones can also serve as a tool for determining suitable locations for domestic and irrigation wells (Arulbalaji et al., 2019) [7] . The identification of groundwater as a subsurface phenomenon can be indirectly determined through the analysis of observable terrain features. Recent technological advancements enable us to delineate with greater effectiveness and efficiency than ever before. Remote sensing and Geographic Information System(GIS) is a powerful tool for effectively managing spatial data. (Manson et al., 2015) [8] MCDM approaches have improved understanding of the links and interactions between many layers of geo-environmental and hydrological inputs in conjunction with the governing system. The analytical hierarchy process(AHP) technique is among the most commonly utilized multi-criteria decision-making (MCDM) approaches. It was invented by Thomas Saaty in 1980. Many investigations have employed various decision-making approaches in combination with remote sensing (RS) and geographical information systems (GIS) to produce more concrete outcomes in the appraisal of groundwater resources. Another famous technique is the Analytical Hierarchy Process (AHP) (Kanak et al., 2023; Rajasekhar et al., 2019; Gnanachandrasamy et al., 2018; Ramachandran et al., 2022) [912] . As a result, this research aims to use GIS and AHP to identify the GWPZs of the Handri River basin. For this reason, seven thematic layers were used land use/land cover, geomorphology, lineament density, geology, drainage density, slope, and soil. This research will be valuable for groundwater resource planners and policymakers in developing sustainable groundwater strategies in this basin area.
Literature review
Geospatial technologies including Remote Sensing (RS) and Geographic Information Systems (GIS) have been widely used for groundwater potential zone (GWPZ) delineation worldwide. Nampak et al. (2014) [2] applied an evidential belief function model using GIS-based data to map groundwater potential zones with satisfactory accuracy. Harter (2003) [1] provided foundational concepts of groundwater hydrology, emphasising the importance of geological formations in controlling groundwater occurrence. Rajasekhar et al. (2022) [3] demonstrated the effectiveness of geospatial and decisionmaking techniques for GWPZ identification in southern India. Arulbalaji et al. (2019) [7] combined GIS and AHP techniques to delineate GWPZs in the southern Western Ghats, achieving high validation accuracy. Saraf and Choudhury (1998) [4] pioneered the integration of RS and GIS for groundwater exploration and artificial recharge site identification. Subsequent studies by Rajasekhar et al. (2019) [10] and Gnanachandrasamy et al. (2018) [11] confirmed that multicriteria decision-making methods, particularly the Analytical Hierarchy Process (AHP), produce reliable and reproducible results in groundwater potential assessment across diverse geoenvironmental settings. Ramachandran et al. (2022) [12] further validated AHP-based GIS approaches for sustainable groundwater management in Tamil Nadu. Collectively, this body of literature establishes the scientific foundation for the methodology adopted in the present study.
Theoretical background
The Analytical Hierarchy Process (AHP), introduced by Thomas L. Saaty (1980) [13] , is a structured multi-criteria decision-making (MCDM) framework that decomposes a complex decision problem into a hierarchy of simpler subproblems. In the context of GWPZ delineation, AHP enables experts to assign relative importance weights to thematic parameters (such as geology, lineament density, drainage density, slope, soil, geomorphology, and LULC) through pairwise comparisons on a 1-9 intensity scale (Saaty, 1980; Table 1) [13] . The pairwise comparison matrix is then normalised to yield priority weights (eigenvectors), and the consistency of the expert judgments is verified using the Consistency Ratio (CR). A CR value below 0.10 confirms that the pairwise comparisons are sufficiently consistent for reliable weight derivation (Saaty, 2008) [14] . Remote sensing data provide multi-spectral imagery for mapping surface features, while GIS platforms facilitate the spatial integration of heterogeneous thematic layers through weighted overlay analysis. The combination of RS, GIS, and AHP thus offers a robust, reproducible, and spatially explicit framework for groundwater resource assessment.
Novelty and limitations of the study
The novelty of the present study lies in its comprehensive geospatial assessment of the Handri River basin a hydrogeologically significant yet understudied watershed in semi-arid Andhra Pradesh using an integrated RS-GIS-AHP framework incorporating seven thematic layers validated against Central Ground Water Board (CGWB) observation well data. Unlike previous studies in the region that focused on broader administrative units, this study provides watershedscale, high-resolution GWPZ mapping that can directly support local-level groundwater governance. The limitations of the study include: (i) reliance on Landsat 8 imagery at 30 m resolution, which may not capture micro-scale hydrogeological variability; (ii) AHP weights are based on expert judgment and may reflect subjectivity; (iii) the validation dataset is limited to 20 CGWB observation wells, which may not fully represent the spatial heterogeneity of the basin; and (iv) temporal variations in groundwater levels and seasonal recharge dynamics are not addressed in the current framework.
Objectives
• Develop a groundwater potential map of Handri River basin using RS, GIS, and AHP.
• Integrate thematic layers to analyse factors influencing groundwater potential.
• Generate zones and insights for sustainable water resource planning in the area.
Study area
The Handri River Basin study area (Fig. 1) is located in the western part of Kurnool District. Administratively, the study area consists of 19 Mandals and covers parts of 13 Survey of India toposheets on a 1:50,000 scale. The study area covers an area of 3548km². It is located between latitudes of 15°12 '37 ''N to 15° 49′ 20′′N and longitudes 77°16 '49 '' E to 78° 04′ 52 " E. The mean altitude of the basin is 469.5 meters with peak and trough values; the weather is warm and arid for a significant portion of the year. The summer period experiences intense heat, with temperatures soaring to +42° Celsius, while the winter months bring agreeable conditions, with nighttime temperatures reaching approximately 13° Celsius. The study region experiences an annual average precipitation of 665 mm. Handri River rises from the western part of the study area in Erramala hills and merges into the Tungabhadra River at Kurnool town, and the drainage pattern was found to be dendritic; the study area is distinguished by a wide range of geological formations from the Archaean period to the recent. Granite and Granite gneisses dominate the western district, while quartzites, shales, and limestones from the Cuddapah and Kurnool groups present in the eastern part. The Handri River basin was selected as the study area based on the following considerations: (i) the basin is located in the semiarid Kurnool district of Andhra Pradesh, a region historically prone to droughts and water scarcity (Rajasekhar et al., 2019) [10] ; (ii) rapid population growth and agricultural expansion have led to overexploitation of groundwater, creating an urgent need for resource mapping; (iii) the basin exhibits diverse geological formations from Archaean granites to Cuddapah and Kurnool Group sedimentaries, making it an ideal test bed for geospatial hydrogeological analysis; and (iv) limited published studies on the basin's groundwater potential offer scope for original scientific contribution. Data sources used for the study include USGS Landsat 8 imagery (30 m resolution), SRTM DEM (30 m), GSI Bhukosh portal for geology, SOI toposheets at 1:50,scale, NBSS soil resource maps, and CGWB observation well records.
Materials and Methods
The current study aims to identify groundwater potential zones (GWPZ) in the Handri River Basin. The process involves the evaluation of various thematic layers, comprising geomorphology (GM), Lineament Density (LD), Drainage Density (DD), geology, land use/land cover (LULC), soils, and slope. The layers are collectively appraised through information-based weighted overlay analysis (WOA) using the AHP method. The resulting GWPZ map is prepared based on the methodology presented in (Fig. 2). The technique used in the study involved collecting and preparing all seven thematic layers using ArcGIS software. Weights were assigned to georeferenced maps using the analytical hierarchy process. The normalized weights for the layers were obtained by ensuring consistency in the pairwise matrix, meeting the consistency index and consistency ratio values. The pairwise matrix is considered consistent if its CR value is below 0.1(Table 4). The layers were assigned the determined weights and underwent weighted overlay analysis. The groundwater potential zone was classified into four classes based on the index value calculated using Eq. 1. The results were verified by comparing them with borehole yield. The methodology adopted for this study is depicted in Figure 2. The following equation represents the groundwater potential zone:
| Factors | LULC | GM | LD | Geology | DD | Slope | Soil |
|---|---|---|---|---|---|---|---|
| LULC | 1 | 2 | 3 | 4 | 5 | 6 | 7 |
| GM | 0.5 | 1 | 2 | 3 | 4 | 5 | 6 |
| LD | 0.33 | 1 | 1 | 2 | 3 | 4 | 5 |
| Geology | 0.25 | 0.33 | 0.5 | 1 | 2 | 3 | 4 |
| DD | 0.2 | 0.25 | 0.33 | 0.5 | 1 | 2 | 3 |
| Slope | 0.16 | 0.2 | 0.25 | 0.33 | 0.25 | 1 | 2 |
| Soil | 0.14 | 0.16 | 0.2 | 0.25 | 0.33 | 0.5 | 1 |
Table text extracted from the original PDF; superscript letters are shown inline. The original table image is below.
View original table image
Determination of rank and weights using AHP
The Analytical Hierarchy Process is a decision-making technique that leverages the expertise of professionals to establish the priority and significance of different criteria by creating an eigenvalue pairwise comparison matrix. This method is particularly advantageous in intricate scenarios with multiple variables influencing the outcome. The process involves developing a pairwise matrix to give weights (Table 3) to each criterion based on the relative importance of all other criteria, utilizing Saaty's 1-9 scale (Table 1) to determine the significance of values. A rating of signifies equal importance, while a score of 9 indicates the highest level of significance. This approach has gained widespread acceptance and proven in decision making across various fields as demonstrated in Saaty's 1980 [13] 𝐶𝐼 = 𝜆𝑚𝑎𝑥 -𝑛 𝑛 -1
Eq.2 where λmax = consistency vector; n=criteria or factors CR is calculated using Eq. 3
𝐶𝑅 = 𝐶𝐼 𝑅𝐼
Eq.3 where RI (Table 2). random consistency index, provided by Saaty (2008) [14] Equations and are utilised to calculate the consistency index and consistency ratio of a given matrix. The matrix is then checked for consistency. If the consistency ratio is less than 0.1, the criteria weights obtained are considered reliable for analysis. This approach offers the decision-maker several options. Additionally, the consistency ratio can be verified to ensure the objectivity of the weights calculated. If the requirement is not met, the matrix can be reconstructed with different options.
| Intensity of importance | Definitions |
|---|---|
| 1 | Equal importance |
| 2 | Equal to moderate importance |
| 3 | Moderate importance |
| 4 | Moderate to strong importance |
| 5 | Strong importance |
| 6 | Strong to very strong importance |
| 7 | Very strong importance |
| 8 | Very to extreme strong importance |
| 9 | Extreme importance |
Table text extracted from the original PDF; superscript letters are shown inline. The original table image is below.
View original table image
Results and discussion
Land use/land cover (LULC) Land use and land cover play a crucial role in controlling surface runoff as it is influenced by factors such as vegetation type and soil wetness, which affect evapotranspiration, penetration, and condensation. Consequently, it greatly influences the recharge of groundwater. In terms of significance, the land use/land cover pattern is ranked first with a normalized weight of 0.3451 (Table 4). The Handri River Basin showcases a diverse range of land use categories, including Forest, Build-up areas, Barren land, Agriculture area, and water bodies (Fig. 3).
Geomorphology
Geomorphology is a scientific field that studies the development and changes of landforms, as well as their relationship to groundwater potential zones and structural characteristics. It holds the second important position, with a normalized weight of 0.2350 (Table 4). Geomorphology can be divided into different classes based on their origins: anthropogenic, denudational, fluvial, structural, and water body (fig 4). From a geomorphological perspective, the majority of the area is characterized by denudational origin, where pediments are formed around structural and denudational hills.
In the eastern part of the basin, structural hills give rise to low and moderately dissected hills. The Handri River flows in a northeastern direction, resulting in sparsely distributed water bodies and hill ranges that are predominantly granitic. This dominance of granite contributes to a dendritic drainage pattern and the occurrence of low to moderate levels of groundwater in hard rock structures with high runoff and low infiltration. 4).
Geology
The Handri basin boasts diverse litho units (fig. 6), each classified based on their distinct properties. Predominantly characterized by Archean granite and granite gneiss formations, the basin showcases a range of geological features vital for identifying groundwater potential zones. Quartz reefs, basic dykes, and granites demonstrate heightened water infiltration and storage capabilities owing to their unique fracturing and weathering characteristics. Conversely, volcanic conglomerates and meta rhyolites exhibit varying porosity levels, influencing their suitability as aquifers. The presence of granite gneiss contributes to the development of diverse groundwater flow patterns. Furthermore, formations rich in carbonates, like Koilakuntla limestone, and quartz-rich ones, such as Paniam quartz, serve as significant reservoirs for groundwater. In some localized regions, Banaganapalli quartzite and Gulcheru quartzite form aquifers through the presence of fractures and joints, thereby playing a pivotal role in facilitating sustainable groundwater management practices within the basin. Ranked fourth in importance, it holds a normalized weight of 0.1048 (Table 4).
Drainage density
Drainage density is a key indicator of hydrogeological features as it directly correlates with the underlying lithology. This metric, defined as the proximity of stream channel spacing, inversely relates to permeability. It quantifies the total length of stream channels within a given area. The drainage pattern reflects surface characteristics and provides insights into subsurface formations. Higher drainage density indicates increased runoff, whereas lower density suggests more significant potential for recharge or groundwater zones. In the study area, drainage density ranges from 0 to 1.81 km/km² (fig. 7) classified into five categories: very low, low, moderate, high, and very high, with a normalized weight of 0.0690 (Table 4). and is In comparison, the highest value class (steep) is assigned a lower rank owing to its relatively higher runoff characteristics.
In the study area, the Slope ranges from 00 to greater than 400 (fig. 8) and is classified into five categories: very low, low, moderate, high, and very high, with a normalized weight of 0.0429 (Table 4). 5) normalized 0.0310 infiltration assigned to (fig. 9). The weights of the are shown in and with a weight of (Table 4)
Assessment of groundwater potential zones
The ultimate standard weights for each thematic layer and their specific characteristics were computed as part of the process. Next, the layers were transformed into a raster format and combined using the raster calculator function in ArcGIS software. The objective was to define the zone of groundwater potential. Based on the total score, the groundwater potential zone was classified into four categories: High (26%), moderate (31%), low (34%), and very low (9%), as shown in Fig. 10.
Conclusions
The current study focused on the Handri River basin in the western part of the Kurnool district to assess its groundwater potential. The study utilized a combination of AHP and GIS, employing thematic layers, including LULC, geomorphology, lineament density, geology, drainage density, slope, and soil. These themes were weighted between individuals by pairwise comparisons and were aggregated in the GIS utilizing the weighted overlay. Based on the final output map, the study region was divided into four different zones of groundwater potential high (26%), moderate (31%), low (34%), and very low (9%). To determine the accuracy of the resulting groundwater potential zone map, it was compared with borehole yield spread throughout the study region. Boreholes located in very low and low potential zones yielded 10 to 40 liters per minute. In contrast, those in moderate potential zones yielded 40 to 80 LPM, and those in high potential zones yielded more than 80 LPM. The potential groundwater zones map produced in this study can aid policymakers in managing and planning these resources for agricultural and urban uses. As the majority of the study area is covered by agricultural land, this study will assist in improving irrigation facilities and enhancing agricultural productivity in the region.
Figures and tables from the paper
| Factors | LULC | GM | LD | Geology | DD | Slope | Soil | Normalised -weight | CR |
|---|---|---|---|---|---|---|---|---|---|
| LULC | 0.3857 | 0.4494 | 0.4119 | 0.3609 | 0.3158 | 0.2791 | 0.2500 | 0.3451 | 0.02 |
| GM | 0.1928 | 0.2247 | 0.2746 | 0.2707 | 0.2526 | 0.2326 | 0.2143 | 0.2350 | |
| LD | 0.1286 | 0.1124 | 0.1373 | 0.1805 | 0.1895 | 0.1860 | 0.1786 | 0.1722 | |
| Geology | 0.0964 | 0.0749 | 0.0686 | 0.0902 | 0.1263 | 0.1395 | 0.1429 | 0.1056 | |
| DD | 0.0771 | 0.0562 | 0.0458 | 0.0451 | 0.0632 | 0.0930 | 0.1071 | 0.0696 | |
| Slope | 0.0643 | 0.0449 | 0.0343 | 0.0301 | 0.0316 | 0.0465 | 0.0714 | 0.0429 | |
| Soil | 0.0551 | 0.0375 | 0.0275 | 0.0226 | 0.0211 | 0.0233 | 0.0357 | 0.0310 | |
| LULC | GM | LD | Geology | DD | Slope | Soil | Sum | Weightage | |
| LULC | 0.388 | 0.405 | 0.412 | 0.361 | 0.321 | 0.279 | 0.250 | 2.416 | 0.345 |
| GM | 0.194 | 0.202 | 0.275 | 0.271 | 0.257 | 0.233 | 0.214 | 1.645 | 0.235 |
| LD | 0.128 | 0.202 | 0.137 | 0.181 | 0.193 | 0.186 | 0.179 | 1.205 | 0.172 |
| Geology | 0.097 | 0.067 | 0.069 | 0.090 | 0.128 | 0.140 | 0.143 | 0.733 | 0.105 |
| DD | 0.078 | 0.051 | 0.045 | 0.045 | 0.064 | 0.093 | 0.107 | 0.483 | 0.069 |
| Slope | 0.062 | 0.040 | 0.034 | 0.030 | 0.016 | 0.047 | 0.071 | 0.301 | 0.043 |
| Soil | 0.054 | 0.032 | 0.027 | 0.023 | 0.021 | 0.023 | 0.036 | 0.217 | 0.031 |
| Sum | 2.580 | 4.940 | 7.280 | 11.080 | 15.580 | 21.500 | 28.000 | 1.000 | |
| LULC | GM | LD | Geology | DD | Slope | Soil | Sum | Weightage |
Table text extracted from the original PDF; superscript letters are shown inline. The original table image is below.
View original table image
| — | LULC | GM | LD | Geology | DD | Slope | Soil | Sum | Weightage | — | λmax | CI | CR |
|---|---|---|---|---|---|---|---|---|---|---|---|---|---|
| LULC | 0.134 | 0.095 | 0.071 | 0.038 | 0.022 | 0.012 | 0.008 | 0.380 | 0.345 | 1.100 | 7.220 | 0.037 | 0.028 |
| GM | 0.067 | 0.048 | 0.047 | 0.028 | 0.018 | 0.010 | 0.007 | 0.224 | 0.235 | 0.955 | |||
| LD | 0.044 | 0.048 | 0.024 | 0.019 | 0.013 | 0.008 | 0.006 | 0.161 | 0.172 | 0.936 | |||
| Geology | 0.033 | 0.016 | 0.012 | 0.009 | 0.009 | 0.006 | 0.004 | 0.090 | 0.105 | 0.856 | |||
| DD | 0.027 | 0.012 | 0.008 | 0.005 | 0.004 | 0.004 | 0.003 | 0.063 | 0.069 | 0.912 | |||
| Slope | 0.021 | 0.010 | 0.006 | 0.003 | 0.001 | 0.002 | 0.002 | 0.045 | 0.043 | 1.054 | |||
| Soil | 0.019 | 0.008 | 0.005 | 0.002 | 0.001 | 0.001 | 0.001 | 0.037 | 0.031 | 1.194 | |||
| Sum | 2.580 | 4.940 | 7.280 | 11.080 | 15.580 | 21.500 | 28.000 |
Table text extracted from the original PDF; superscript letters are shown inline. The original table image is below.
View original table image
| Factors | Classes | Class rank | Weight (%) |
|---|---|---|---|
| LULC | Water body | 5 | 35 |
| Forest | 4 | ||
| Agriculture | 4 | ||
| Buildup area | 2 | ||
| Barren land | 1 | ||
| Geomorphology | Fluvial origin | 5 | 24 |
| Water body | 5 | ||
| Anthropogenic | 3 | ||
| Denudational Hill | 2 | ||
| Structural Hill | 1 | ||
| Lineament density | Very High | 5 | 16 |
| High | 4 | ||
| Moderate | 3 | ||
| Low | 2 | ||
| Very Low | 1 | ||
| Geology | Koilakuntla limestones | 5 | 10 |
| Vempalli dolomites | 4 | ||
| Meta rhyolite /Meta basalt | 3 | ||
| Volconic conglomerate | 3 | ||
| Gulcheru quartzite | 2 | ||
| Banaganapalli quartzite | 2 |
Table text extracted from the original PDF; superscript letters are shown inline. The original table image is below.
View original table image
| Well No. | Location | Latitude | Longitude | GWL (mbgl) | Yielding (LPM) | Total depth in (M) |
|---|---|---|---|---|---|---|
| 1 | Kodumuru | 15.67139 | 77.77889 | 3.95 | 120 | 160 |
| 2 | Kirshnapuram | 15.64694 | 77.76611 | 5.8 | 75 | 190 |
| 3 | Gorantla | 15.63111 | 77.86417 | 7 | 30 | 190 |
| 4 | Ternekallu | 15.63417 | 77.52667 | 9.5 | 38 | 200 |
| 5 | Devarakonda | 15.53333 | 77.54833 | 11 | 18.96 | 180 |
| 6 | Khairuppala | 15.56250 | 77.49333 | 10 | 24 | 200 |
| 7 | Kapatrala | 15.60667 | 77.63056 | 6 | 72 | 200 |
| 8 | Pandikona | 15.44167 | 77.55833 | 4.5 | 140 | 80 |
| 9 | Burjula | 15.31444 | 77.43889 | 8 | 50 | 198 |
| 10 | Sambigallu | 15.61667 | 77.38111 | 6.4 | 65 | 170 |
| 11 | Nalakaladoddi | 15.47167 | 77.43056 | 6.8 | 58 | 140 |
| 12 | Hosun Road | 15.38333 | 77.49444 | 5.6 | 60 | 160 |
| 13 | Pattikonda | 15.40278 | 77.50000 | 9 | 29 | 200 |
| 14 | Penumada | 15.51619 | 77.79263 | 4.5 | 85 | 120 |
| 15 | Alamakonda | 15.43988 | 77.73449 | 5.5 | 70 | 130 |
| 16 | Veldurthi | 15.54641 | 77.93145 | 9.8 | 19.2 | 200 |
| 17 | Krishnagiri | 15.54621 | 77.83359 | 5 | 50 | 150 |
| 18 | Yapadinne | 15.38019 | 77.77803 | 9 | 18 | 170 |
| 19 | Devarabanda | 15.62794 | 77.67070 | 7.5 | 35 | 180 |
| 20 | Gundlakonda | 15.47661 | 77.64844 | 8.5 | 28 | 191 |
Table text extracted from the original PDF; superscript letters are shown inline. The original table image is below.
View original table image
References
14 in the original paper- Harter T. Basic concepts of groundwater hydrology. UCANR Publications. 2003.
- Nampak H, Pradhan B, Manap MA. Application of GIS based data driven evidential belief function model to predict groundwater potential zonation. J. Hydrol. 2014;513:283-300.
- Rajasekhar M, Upendra B, Raju GS. Identification of groundwater potential zones in southern India using geospatial and decision-making approaches. Appl Water Sci. 2022;12:68.
- Saraf AK, Choudhury PR. Integrated remote sensing and GIS for groundwater exploration and identification of artificial recharge sites. Int. J. Remote Sens. 1998;19:18251841.
- United Nations Environment Programme (UNEP). Making Peace with Nature: A Scientific Blueprint to Tackle the Climate, Biodiversity and Pollution Emergencies. Nairobi: UNEP; 2021.https://www.unep.org/resources/makingpeace-nature
- Boretti A, Rosa L. Reassessing the projections of world water Development Report. npj Clean Water. 2019;2:15.https://doi.org/10.1038/s41545-019-0039-9
- Arulbalaji P, Sreelash K, Padmalal D. GIS and AHP Techniques Based Delineation of Groundwater Potential Zones: a case study from Southern Western Ghats, India. Sci Rep. 2019;9:2082.https://doi.org/10.1038/s41598-01938567-x
- Manson S, Bonsal D, Kernik M, Lambin E. Geographic Information Systems and Remote Sensing. International Encyclopaedia of the Social & Behavioural Sciences. 2015.https://doi.org/10.1016/B978-0-08-097086-8.910274
- Kanak N, Thirumalaivasan D, Balasubramanian A. Delineation of groundwater potential zones using remote sensing, GIS and AHP techniques. Environmental Science and Pollution Research. 2023.https://doi.org/10.1007/s11356-023-26891-3
- Rajasekhar M, Raju GS, Sreenivasulu Y, Raju RS. Delineation of groundwater potential zones in semi-arid region of Jilledubanderu river basin, Anantapur District, Andhra Pradesh, India using fuzzy logic, AHP and integrated fuzzy-AHP approaches. Hydro Research. 2019;2:97108.https://doi.org/10.1016/j.hydres.2019.11.006
- Gnanachandrasamy Y, Bagyaraj G, Zhou. Remote Sensing and GIS Based Groundwater Potential Zone Mapping in Ariyalur District, Tamil Nadu. J Geol Soc India. 2018;92:484-490.https://doi.org/10.1007/s12594-0181046-z
- Ramachandran R, Perumal M, Udayaganesan P, Samy M, Selvam D. Geospatial and an AHP approach for delineating potential groundwater zone for Sakkottai block, Tamil Nadu. Arabian Journal of Geosciences. 2022;15:633.https://doi.org/10.1007/s12517-
- Saaty TL. The Analytic Hierarchy Process. New York, NY: McGraw Hill; 1980.
- Saaty TL. Decision making with the analytic hierarchy process. Int J Serv Sci. 2008;1(1):83.