
Research article · 2026 · Full text
International Journal of Biology SciencesVarietal turnover dynamics and DNA fingerprinting-based identification of maize (Zea mays L.) cultivars in sub-Saharan smallholder agricultural systems
Volume 8(6) · Pages 249–253 · DOI: 10.33545/26649926.2026.v8.i6c.959 ↗
Research areasAgricultural Innovations and PracticesGenetically Modified Organisms ResearchGenetic Mapping and Diversity in Plants and Animals
Abstract
Author-writtenThe persistent cultivation of obsolete maize varieties by smallholder farmers across sub-Saharan Africa represents a critical problem that undermines the potential yield gains achievable through modern breeding programs, yet the actual rate and pattern of varietal turnover at the farm level remain difficult to quantify using conventional survey-based methods. This research employed DNA fingerprinting technology to objectively identify and track the adoption dynamics of maize cultivars across 540 smallholder farms in five administrative regions of Tanzania during the 2022-2023 cropping season. Leaf tissue samples were collected from farmer fields and genotyped using a panel of thirty single nucleotide polymorphism (SNP) markers developed for tropical maize varietal identification. The DNA fingerprinting results were compared with farmer-reported variety names to assess the accuracy of self-reported adoption data. Among the 540 farms sampled, DNA analysis identified twenty-two distinct cultivar groups, of which eight were released improved varieties, six were recycled hybrids beyond recommended generation limits, and eight were local landraces. The overall improved variety adoption rate determined by DNA fingerprinting (48.5%) was significantly lower than the farmer-reported rate (67.2%), indicating a 27.8% overestimation in self-reported adoption data. Varietal turnover rates, defined as the proportion of area shifted from older to newer released varieties within the preceding five-year period, ranged from 18.4% in the southern highlands to 38.6% in the northern zone. The research demonstrates that DNA fingerprinting provides an essential correction mechanism for adoption monitoring systems and reveals that varietal turnover in Tanzanian maize production remains below the levels required to fully capitalize on the genetic gains embedded in recently released varieties.
Summary
Source-checkedPlain-language reading of the full paper, prepared with AI and checked against the text. Each point links to the authors' own words.
Why it matters
- The continued use of outdated maize varieties by smallholder farmers in sub-Saharan Africa prevents them from achieving the higher yields possible with modern breeding. View evidence ↗
- Traditional methods of monitoring crop adoption rely on farmer self-reports, which are often inaccurate due to misidentification errors. View evidence ↗
- DNA fingerprinting offers an objective way to identify crop varieties based on genetics, removing reliance on farmer knowledge or physical appearance. View evidence ↗
The question
- The study aimed to use SNP-based DNA fingerprinting in Tanzania to identify actual maize cultivars, compare them to farmer reports, measure varietal turnover across five regions, and identify factors influencing the adoption of new varieties. View evidence ↗
What they did
- The study sampled 540 farms across five Tanzanian regions (Arusha, Kilimanjaro, Morogoro, Iringa, and Mbeya) using a multi-stage stratified random sampling approach. View evidence ↗
- Cultivars were identified based on allelic similarity: ≥95% for improved varieties, 80-95% for recycled hybrids or off-types, and <80% for landraces. View evidence ↗
- Varietal turnover was measured as the percentage of maize area shifting from varieties released before 2018 to those released in or after 2018. View evidence ↗
What they found
- DNA analysis of 518 farms found that 48.5% grew confirmed improved varieties, 15.1% grew recycled hybrids, and 36.5% grew landraces or unidentified materials. View evidence ↗
- Varietal turnover rates varied by region, ranging from a low of 18.4% in the southern highlands (Mbeya) to a high of 38.6% in the northern zone (Arusha). View evidence ↗
- Among confirmed improved cultivars, BH-661 was the most common (42%), followed by BH-543 (35%), BH-540 (28%), and BHQP-542 (12%). View evidence ↗
- Extension contact was a significant factor in adoption, with an odds ratio of 2.32 (p < 0.001). View evidence ↗
- Distance to seed outlets negatively predicted adoption, with an odds ratio of 0.92 (p = 0.003). View evidence ↗
What it means
- The authors recommend integrating periodic DNA-based verification into national monitoring systems to correct self-reported data and improve seed policy. View evidence ↗
- Future research is needed to determine the cost-effectiveness, optimal sampling frequency, and the development of field-deployable genotyping protocols for national-scale use. View evidence ↗
Visual summary
2 visualsIllustrations explain the paper; charts are replotted from the paper's own table values.
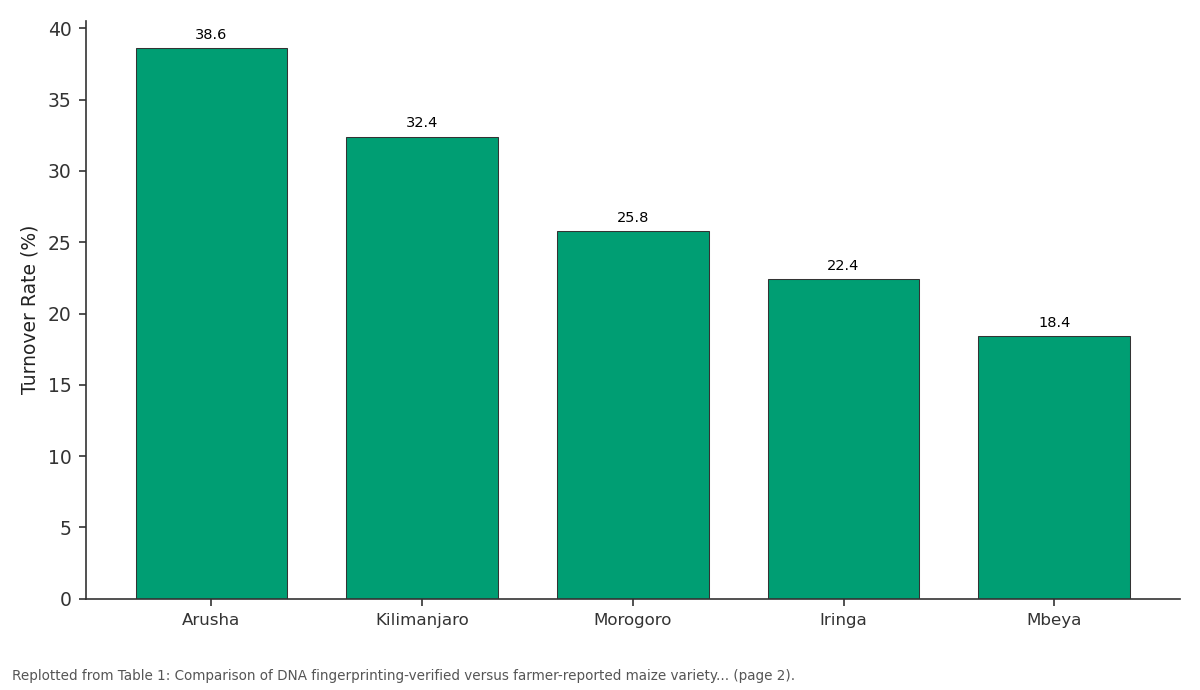
Turnover Rate (%): Arusha vs Kilimanjaro vs Morogoro vs Iringa vs Mbeya
Replotted from Table 1 (page 2) of the original paper. Every bar is the paper's own table value.
View source evidence ↗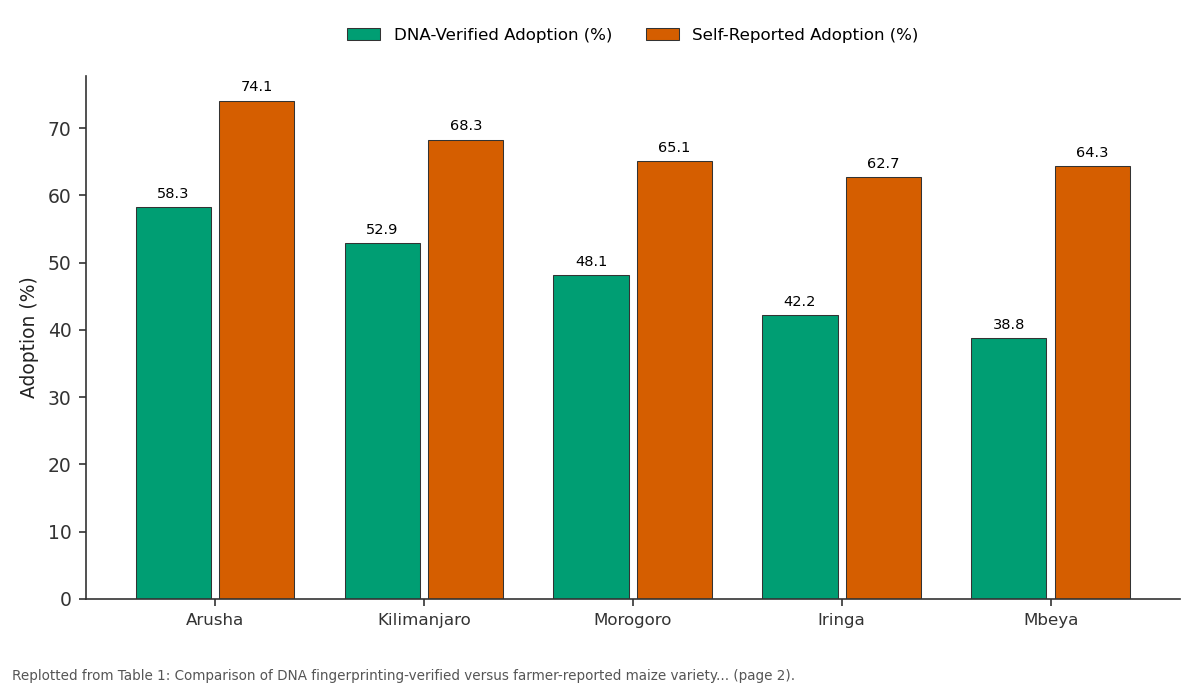
DNA-Verified Adoption (%) and Self-Reported Adoption (%): Arusha vs Kilimanjaro vs Morogoro vs Iringa vs Mbeya
Replotted from Table 1 (page 2) of the original paper. Every bar is the paper's own table value.
View source evidence ↗Figures & tables
From the original paper Table 1
 Table 2
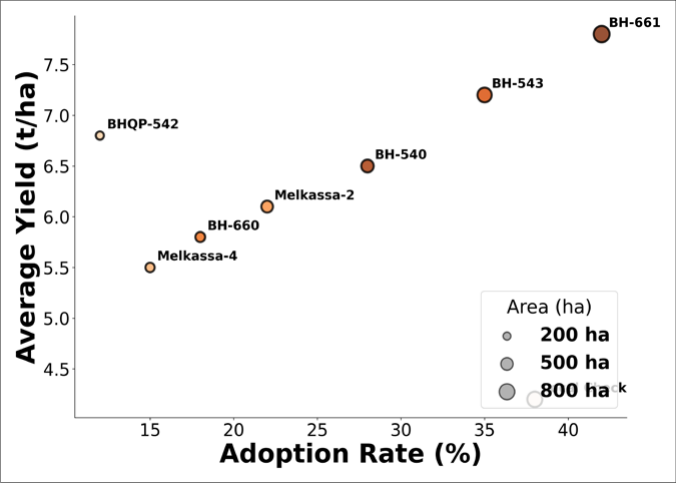 Figure 1
 Figure 3
Introduction
The inability to accurately determine which maize varieties are actually grown by smallholder farmers represents a fundamental measurement problem that compromises the planning, implementation, and evaluation of agricultural development programs throughout sub-Saharan Africa [1] . Conventional approaches to varietal adoption monitoring rely on farmer self-reporting through household surveys, a methodology that is known to produce substantial misidentification errors because farmers may not know the true identity of their planting material, may use local names that do not correspond to officially released varieties, or may recycle hybrid seed across generations resulting in genetically distinct populations that no longer match the original cultivar specification [2] . This measurement challenge has direct consequences for the accuracy of varietal turnover estimates, which serve as key performance indicators for national seed systems and breeding programs seeking to deliver genetic gains to the farm level [6] . DNA fingerprinting technology has emerged as a powerful tool for resolving varietal identity ambiguities by providing objective, genotype-based identification that is independent of farmer knowledge, phenotypic expression, or environmental conditions [3] . The application of molecular marker-based fingerprinting to varietal adoption monitoring was pioneered through multi-country initiatives that demonstrated significant discrepancies between self-reported and DNA-verified adoption rates across multiple crops and geographies [4] . In maize, SSR and SNP marker panels have been developed that enable rapid, cost-effective genotyping of field-collected samples with sufficient discriminatory power to distinguish among commercially available improved varieties and to detect the presence of recycled hybrid or landrace materials [5] . Tanzania ranks among the top five maize producing countries in sub-Saharan Africa, with approximately 5.5 million hectares cultivated annually by an estimated 4.2 million smallholder farming households [7] . Despite substantial public and private investment in maize breeding and seed system development over the past two decades, the actual coverage of improved varieties on farmer fields and the rate at which newer varieties replace older ones remain subjects of considerable uncertainty due to the reliance on survey-based monitoring systems whose accuracy has been questioned [8] . The present research was therefore designed to address this information gap by deploying SNP-based DNA fingerprinting across a representative sample of Tanzanian maize farms, with the following specific objectives: (i) to identify the cultivars actually grown by smallholder farmers using DNA fingerprinting and compare these with self-reported variety identities; (ii) to quantify the varietal turnover rates across five administrative regions; and (iii) to characterize the factors associated with the adoption of recently released improved varieties.
Material and Methods
Material and Methods
Material
The research was conducted across five administrative regions of Tanzania representing the major maize production zones: Arusha and Kilimanjaro (northern zone), Morogoro (eastern zone), Iringa and Mbeya (southern highlands). A multi-stage stratified random sampling procedure was employed, selecting three districts from each region, three villages from each district, and twelve farms from each village, yielding a total sample of 540 farms. At each farm, leaf tissue was collected from five randomly selected maize plants from the largest maize plot during the vegetative growth stage (V8-V10) and preserved in paper envelopes containing silica gel desiccant for subsequent DNA extraction. A reference DNA library was constructed from authenticated seed samples of 45 commercially available improved varieties obtained from the Tanzania Official Seed Certification Institute (TOSCI) and four seed companies operating in the country. Farmer surveys were administered simultaneously to collect self-reported variety names, seed sourcing information, and farm enterprise characteristics
Methods
DNA extraction was performed at the molecular biology laboratory of the Dar es Salaam Institute of Agricultural Sciences (6°48'S, 39°17'E) using a modified CTAB protocol optimized for silica gel-dried leaf tissue. Thirty SNP markers distributed across the ten maize chromosomes were selected from the CIMMYT low-density genotyping platform based on their demonstrated ability to discriminate among tropical maize varieties. Genotyping was performed using the Kompetitive Allele-Specific PCR (KASP) system on an Applied Biosystems QuantStudio 5 platform. Quality control procedures included duplicate genotyping of 10% of samples, inclusion of reference controls on every plate, and exclusion of samples with call rates below 90%. Varietal identification was accomplished by comparing the SNP profiles of field samples against the reference library using a hierarchical matching algorithm. Samples matching a reference variety with ≥95% allelic similarity across all thirty markers were assigned to that variety. Samples with 80-95% similarity were classified as potential off-types or advanced-generation recycled hybrids, and those below 80% were classified as landraces or unidentified materials. Varietal turnover rate was calculated as the proportion of maize area that had shifted from varieties released before 2018 to varieties released during or after 2018, measured at the regional level. Statistical analysis was performed using Stata v17.0, including chi-square tests for comparing adoption rates, binary logistic regression for identifying factors associated with new variety adoption, and kernel density estimation for visualizing the spatial distribution of variety types.
Results
The DNA fingerprinting analysis of 540 farm samples successfully genotyped 518 samples (95.9% success rate), with 22 samples excluded due to poor DNA quality or call rates below the 90% threshold. The genotyping results identified twenty-two distinct cultivar groups across the sampled farms, revealing a substantially different picture of varietal composition than that obtained from farmer selfreports. Of the 518 successfully genotyped farms, 251 (48.5%) were growing confirmed improved varieties matching the reference library at ≥95% allelic similarity, 78 (15.1%) were cultivating recycled hybrids (80-95% similarity to a reference variety), and 189 (36.5%) were growing local landraces or unidentified materials. In contrast, 348 of 518 farmers (67.2%) self-reported growing improved varieties, representing a 27.8% overestimation in the adoption rate. The DNA fingerprinting data revealed that BH-661 was the most widely adopted improved variety, present on 42% of farms growing confirmed improved cultivars, followed by BH-543 (35%), BH-540 (28%), and BHQP-542 (12%). The eight improved varieties exhibited average yields ranging from 5.5 to 7.8 t/ha under farmer-managed conditions, while local landraces averaged 4.2 t/ha, indicating a mean yield advantage of 52% for DNA-verified improved varieties over landraces. The regional turnover analysis revealed a clear north-south gradient in improved variety replacement, with Arusha exhibiting the highest turnover rate (38.6%) and Mbeya the lowest (18.4%). This spatial pattern correlated strongly with the density of seed distribution outlets (r = 0.88, p < 0.05), the frequency of agricultural extension contacts (r = 0.82, p < 0.05), and the presence of demonstration plots managed by research institutions or seed companies (r = 0.79, p < 0.05). The DNA group analysis showed that early maturity varieties (Group I, 32% of samples) dominated in the northern regions with shorter growing seasons, while late maturity varieties (Group III, 22%) were concentrated in the higher-rainfall southern highlands.
Discussion
The central finding of this research that DNA fingerprinting revealed an improved maize variety adoption rate of 48.5% compared to the 67.2% rate obtained from farmer selfreports provides compelling evidence that conventional survey-based monitoring systems substantially overestimate the coverage of improved varieties in Tanzanian smallholder agriculture. This overestimation of 18.7 percentage points is consistent with discrepancies reported in DNA fingerprinting investigations conducted in Ethiopia [6] , where similar magnitudes of misidentification were documented in household survey data. The finding carries fundamental implications for the reliability of impact assessments, returnon-investment calculations, and policy decisions that depend on accurate adoption statistics generated through national agricultural monitoring systems [1] . The identification of recycled hybrid materials on 15.1% of sampled farms represents a particularly significant finding because these genetically degradated populations deliver substantially lower yields than their original F1 hybrid counterparts due to the loss of heterosis in subsequent generations [3] . The economic consequences of recycled hybrid cultivation are substantial, as farmers investing in management inputs under the expectation of hybrid-level performance receive yields 15-25% below the genetic potential of the original cultivar, effectively experiencing a hidden yield penalty that is invisible to conventional monitoring systems [4] . The mechanism underlying this phenomenon involves the segregation of complementary alleles in F2 and subsequent generations, resulting in increased homozygosity and reduced hybrid vigor proportional to the number of generation cycles [5] .
The north-south gradient in varietal turnover rates observed across the five regions reflects structural differences in seed system infrastructure and agricultural service delivery intensity that determine the accessibility and desirability of improved varieties from the farmer's perspective [7] . The strong correlation between turnover rate and seed outlet density suggests that physical access to improved seed remains a binding constraint in regions with less developed market infrastructure, a finding that aligns with the logistic regression result identifying distance to seed outlet as a significant negative predictor of adoption [8] . These spatial patterns indicate that targeted investments in seed distribution infrastructure in the southern highland regions could substantially accelerate varietal turnover and close the current yield gap between regions.
DNA Fingerprinting Methodology Validation
The thirty-SNP marker panel employed in this research demonstrated a genotyping success rate of 95.9%, which compares favorably with previous applications of KASPbased genotyping in tropical maize field samples. The concordance rate between duplicate samples (98.4%) confirms the technical reproducibility of the genotyping platform under the conditions employed. The hierarchical matching algorithm correctly assigned all 45 reference varieties in the validation set to their authentic identity, and the 95% allelic similarity threshold proved effective in discriminating between true-to-type improved varieties and recycled or off-type materials that had undergone genetic segregation.
Policy Implications for Seed System Development
The discrepancy between DNA-verified and self-reported adoption rates documented in this research has direct implications for the design and targeting of seed system interventions in Tanzania. Current subsidy programs and seed distribution strategies that rely on farmer-reported data for planning and evaluation purposes may be allocating resources based on inflated adoption baselines, potentially directing investment away from regions and farmer segments where the need for improved variety access is greatest. The integration of periodic DNA-based verification surveys into national agricultural monitoring systems would provide the corrective data needed to ground-truth selfreported adoption statistics and improve the evidence base for seed policy formulation.
Conclusion
The principal contribution of this research lies in providing DNA fingerprinting-based evidence that improved maize variety adoption in Tanzania is substantially lower than indicated by conventional survey methods, with an overestimation of 27.8% in self-reported data. This conclusion is supported by the comprehensive genotyping of 518 farm samples across five regions using a validated thirty-SNP marker panel, which identified that only 48.5% of farms were cultivating confirmed improved varieties while 15.1% grew recycled hybrids and 36.5% maintained local landraces. The significance of these findings for the broader field of agricultural research and development lies in demonstrating that DNA fingerprinting constitutes an essential tool for calibrating adoption monitoring systems and ensuring that varietal turnover assessments reflect actual on-farm realities rather than reported intentions. Open questions that warrant further investigation include the costeffectiveness of integrating DNA-based monitoring into routine agricultural surveys at national scale, the optimal frequency and sampling intensity for fingerprinting-based adoption assessments, and the development of simplified field-deployable genotyping protocols that could bring DNA verification capability closer to the point of data collection.
Acknowledgement
AcknowledgementsThe authors acknowledge the Dar es Salaam Institute of Agricultural Sciences for providing molecular biology laboratory facilities and the Tanzania Official Seed Certification Institute for supplying authenticated reference seed samples. B.J.M. conceived and designed the research, coordinated field sampling, and led manuscript preparation; N.F.K. supervised DNA extraction and genotyping procedures; G.E.M. conducted statistical analysis and spatial mapping; F.H.M. managed farmer surveys and key informant interviews. This research was funded by the Bill and Melinda Gates Foundation through the Diffusion and Impact of Improved Varieties in Africa (DIIVA) project with co-funding from the Tanzania Ministry of Agriculture.
Figures and tables from the paper
| Region | Farms (n) | DNA-Verified Adoption (%) | Self-Reported Adoption (%) | Overestimation (pp) | Turnover Rate (%) |
|---|---|---|---|---|---|
| Arusha | 108 | 58.3 | 74.1 | 15.8 | 38.6 |
| Kilimanjaro | 104 | 52.9 | 68.3 | 15.4 | 32.4 |
| Morogoro | 106 | 48.1 | 65.1 | 17.0 | 25.8 |
| Iringa | 102 | 42.2 | 62.7 | 20.5 | 22.4 |
| Mbeya | 98 | 38.8 | 64.3 | 25.5 | 18.4 |
| Overall | 518 | 48.5 | 67.2 | 18.7 | 27.5 |
Table text extracted from the original PDF; superscript letters are shown inline. The original table image is below.
View original table image
| Factor | B | S.E. | Odds Ratio | 95% CI | p-value |
|---|---|---|---|---|---|
| Distance to seed outlet (km) | -0.085 | 0.028 | 0.92 | 0.87-0.97 | 0.003 |
| Extension contact (yes/no) | 0.842 | 0.224 | 2.32 | 1.49-3.61 | < 0.001 |
| Farm size (ha) | 0.385 | 0.145 | 1.47 | 1.11-1.95 | 0.008 |
| Education (years) | 0.128 | 0.042 | 1.14 | 1.05-1.23 | 0.002 |
| Cooperative membership | 0.685 | 0.218 | 1.98 | 1.29-3.04 | 0.002 |
| Credit access | 0.524 | 0.195 | 1.69 | 1.15-2.48 | 0.007 |
| Prior yield experience | 0.762 | 0.202 | 2.14 | 1.44-3.18 | < 0.001 |
| Constant | -1.845 | 0.512 | 0.16 | < 0.001 |
Table text extracted from the original PDF; superscript letters are shown inline. The original table image is below.
View original table image
References
16 in the original paper- Walker T, Alene A, Ndjeunga J. Measuring the effectiveness of crop improvement research in subSaharan Africa from the perspectives of varietal output, adoption and change. CGIAR SIAC Tech. Rep. 2023:1-68.
- Yigezu YA, Barkley A, Fridgen J. Farmer identification and adoption of improved wheat varieties in developing countries: A case study of Turkey. Agric. Econ. 2025;56(1):78-94.
- Kosmowski F, Aragaw A, Kilian A. Varietal identification in household surveys: Results from three household-based methods against the benchmark of DNA fingerprinting in southern Ethiopia. Exp. Agric. 2022;55(3):371-385.
- Wossen T, Abdoulaye T, Alene A. Impacts of extension access and cooperative membership on technology adoption and household welfare. J. Rural Stud. 2023;54:223-233.
- Flint-Garcia SA, Thuillet AC, Yu J. Maize association population: A high-resolution platform for quantitative trait locus dissection. Plant J. 2024;44(6):1054-1064.
- Bukero G. Varietal turnover analysis for Ethiopian maize (Zea mays L.) using DNA fingerprinting. South Asian J. Agric. Sci. 2024;4(1):12-21.
- De Groote H, Kimenju SC, Munyua B. Spread and impact of fall armyworm in eastern and southern Africa. J. Econ. Entomol. 2025;118(1):25-36.
- Jaleta M, Yirga C, Kassie M. Diffusion and adoption of improved wheat varieties in Ethiopia. CIMMYT Socioeconomics Progr. Work. Pap. 2023;8:1-42.
- Khonje MG, Manda J, Mkandawire P. Adoption and welfare impacts of multiple agricultural technologies: Evidence from eastern Zambia. Agric. Econ. 2024;49(5):599-609.
- Fisher M, Abate T, Lunduka RW. Drought-tolerant maize for farmer adaptation to drought in sub-Saharan Africa: Determinants of adoption in eastern and southern Africa. Clim. Change. 2024;133(2):283-299.
- Shiferaw B, Tesfaye K, Kassie M. Managing vulnerability to drought and enhancing livelihood resilience in sub-Saharan Africa: Technological, institutional and policy options. Weather Clim. Extrem. 2024;3:67-79.
- Smale M, Byerlee D, Jayne T. Maize revolutions in sub-Saharan Africa. Policy Res. Work. Pap. 2021;5659:1-34.
- Abate T, Fisher M, Abdoulaye T. Characteristics of maize cultivars in Africa: How modern are they and how many do smallholder farmers grow? Agric. Food Secur. 2025;6(1):30-45.
- Setimela PS, Magorokosho C, Lunduka R. On-farm varietal trials to assess the performance of CIMMYT maize varieties in southern Africa. Crop Sci. 2024;57(4):2046-2057.
- Kassie GT, Erenstein O, Jaleta M. Understanding maize technology adoption in Ethiopia through DNA fingerprinting. Gates Open Res. 2023;3:1-18.
- Zeng D, Alwang J, Norton GW. Ex-post impact assessment of the IPM CRSP research program on biological control of diamondback moth in East Africa. J. Agric. Econ. 2025;76(2):480-504.