
Research article · 2026 · Full text
International Journal of Biology SciencesBiodiversity shifts and community structure alterations driven by non-native arthropod colonization in tropical perennial crop ecosystems
Volume 8(4) · Pages 253–258 · DOI: 10.33545/26649926.2026.v8.i4c.953 ↗
Research areasInsect and Arachnid Ecology and BehaviorEcology and Vegetation Dynamics StudiesPlant and animal studies
Abstract
Author-writtenNearly 48% of arthropod invasions recorded in sub-Saharan Africa over the past two decades have targeted perennial crop landscapes where simplified vegetation structures and year-round food supplies create favorable conditions for non-native colonizers. Despite this trend, the cascading efects of arthropod invasion on resident community composition within tropical plantation agriculture remain insuficiently documented. This research quantified biodiversity shifts and community structure changes associated with the spread of two non-native ant species Pheidole megacephala and Anoplolepis gracilipes through macadamia and avocado orchards in the central highlands of Kenya over a 12-month sampling campaign conducted from January to December 2023. Arthropod assemblages were surveyed at 60 sampling points distributed across six orchard blocks representing a gradient of non-native ant density: two blocks with high invasion intensity, two with moderate presence, and two reference blocks where non-native species had not yet been detected. Pitfall traps, canopy beating samples, and baited stations were deployed monthly. A total of 14,216 individual arthropods belonging to 89 species and 47 families were collected. In heavily invaded blocks, native ant species richness dropped by 38.6% compared to reference blocks (22 versus 36 native species, respectively), while overall arthropod family richness fell by 24.3%. P. megacephala accounted for 28.4% of all ant individuals captured in invaded blocks, and A. gracilipes contributed an additional 19.7%, together representing almost half of total ant abundance. Native genera that sufered the steepest declines included Camponotus (from 17.3% to 6.1% relative abundance), Crematogaster (from 14.1% to 4.8%), and Tetramorium (from 9.8% to 2.3%). Shannon-Wiener diversity (H') fell from 3.12 in reference blocks to 2.14 in heavily invaded blocks, and Simpson's evenness declined from 0.88 to 0.61, reflecting both species loss and increasing dominance by the two non-native taxa. Community ordination through non-metric multidimensional scaling (NMDS) confirmed that invaded and reference blocks clustered separately along axis 1 (stress = 0.11), with invasion intensity correlating strongly with shifts in functional group composition. Predatory arthropods (spiders, predatory beetles) declined by 31.2% in invaded blocks, suggesting that competitive displacement of native ants disrupted broader trophic interactions. Seasonal sampling revealed that invasion intensity peaked during the dry months (July– September), when native species experienced their lowest activity levels, allowing non-native species to consolidate territorial gains. These results show that non-native ant colonization restructures arthropod communities in Kenyan perennial crop ecosystems through both direct competitive displacement and indirect efects on associated invertebrate taxa, with consequences for natural pest regulation services that these orchards depend on.
Summary
Source-checkedPlain-language reading of the full paper, prepared with AI and checked against the text. Each point links to the authors' own words.
Why it matters
- Perennial crop landscapes in sub-Saharan Africa are highly susceptible to arthropod invasions, with nearly 48% of recorded invasions targeting these areas due to simplified vegetation and constant food availability. View evidence ↗
- The rapid expansion of commercial macadamia and avocado orchards in East Africa has replaced diverse landscapes with monocultures, creating hotspots for non-native ant establishment. View evidence ↗
- Biodiversity loss in managed crop systems is economically significant because it leads to higher pest pressure and increased management costs for farmers. View evidence ↗
The question
- The study aimed to determine how the invasive ants Pheidole megacephala and Anoplolepis gracilipes affect native ant richness, overall arthropod diversity, community structure, and whether these effects vary seasonally. View evidence ↗
What they did
- The study was conducted in six macadamia-avocado orchard blocks in the central highlands of Kenya, near Thika town. View evidence ↗
- The researchers used a gradient of invasion intensity, selecting two heavily invaded blocks, two moderately invaded blocks, and two reference blocks with no non-native species. View evidence ↗
- Arthropods were collected monthly using three methods: pitfall traps for ground dwellers, canopy beating for arboreal species, and honey-tuna bait stations for ants. View evidence ↗
- Sampling was conducted monthly over a full year from January to December 2023. View evidence ↗
What they found
- Native ant species richness declined by 38.6% in heavily invaded blocks (22 species) compared to reference blocks (36 species). View evidence ↗
- Overall arthropod family richness decreased by 24.3%, dropping from 43 families in reference blocks to 32 in heavily invaded blocks. View evidence ↗
- In heavily invaded blocks, the two non-native species (P. megacephala and A. gracilipes) dominated the ant population, making up 48.1% of all captured ants. View evidence ↗
- Diversity and evenness declined as invasion intensity increased, with the Shannon-Wiener index falling from 3.12 in reference blocks to 2.14 in high-invasion blocks. View evidence ↗
- The community structure shifted toward herbivores, which increased by 21.4%, while predatory arthropods declined by 31.2% in heavily invaded blocks. View evidence ↗
- Invasion intensity was highest during the dry months (July–September), coinciding with the lowest activity of native species. View evidence ↗
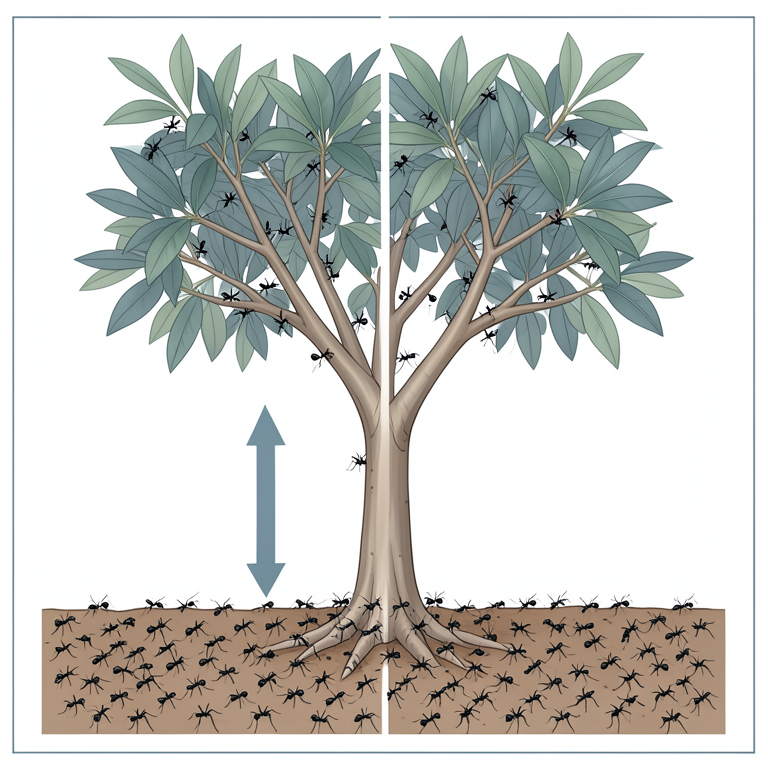
- The two invasive species occupied different niches, with P. megacephala dominating the ground and A. gracilipes dominating the trunks and lower canopy. View evidence ↗
What it means
- The authors conclude that non-native ant colonization disrupts natural pest regulation by reducing predator populations and increasing herbivore proportions. View evidence ↗
- The study's design cannot completely distinguish the effects of the ant invasion from pre-existing differences between the sites. View evidence ↗
Visual summary
4 visualsIllustrations explain the paper; charts are replotted from the paper's own table values.
Vertical Niche Partitioning of Invasive Ants
AI-generated conceptual illustration (tropical fruit tree with invasive ants). It explains the idea and does not show study data.
View source evidence ↗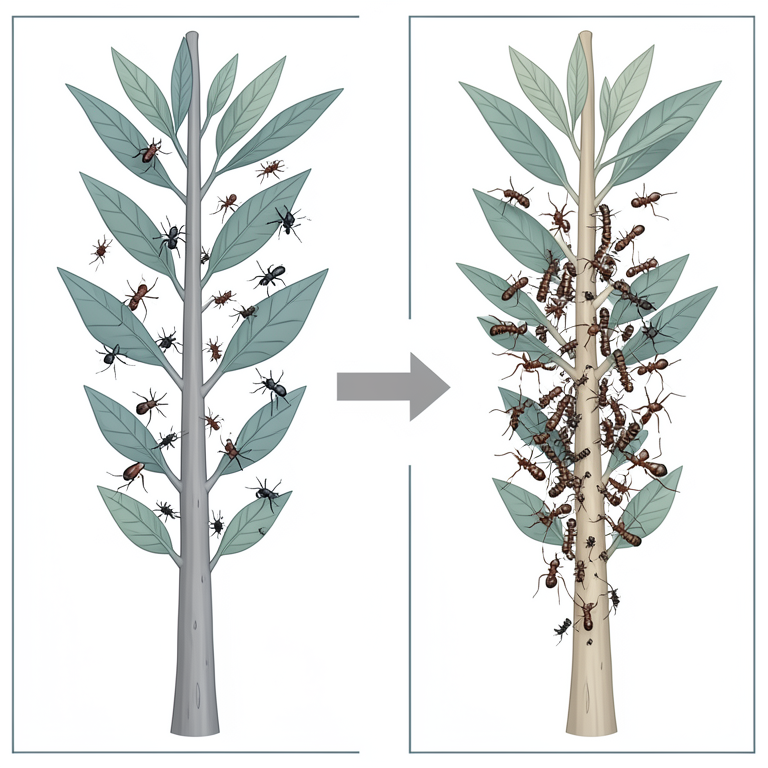
Trophic Shift in Invaded Orchards
AI-generated conceptual illustration (Tropical perennial crop trees with arthropod communities). It explains the idea and does not show study data.
View source evidence ↗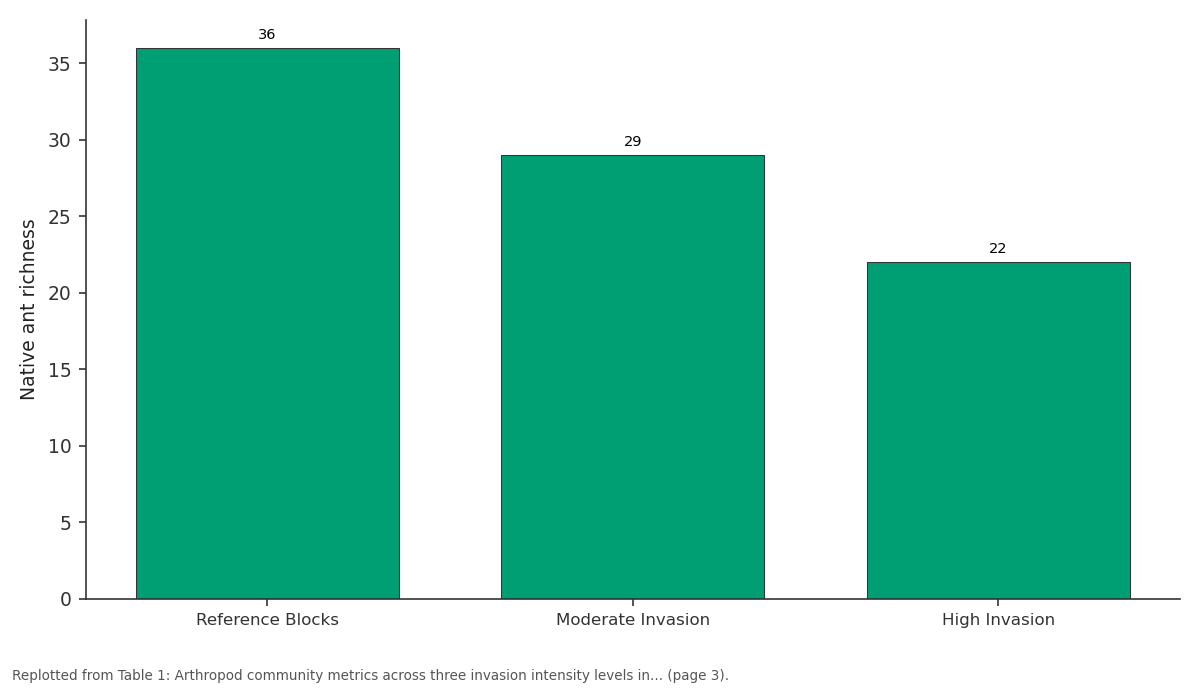
Native ant richness: Reference Blocks vs Moderate Invasion vs High Invasion
Replotted from Table 1 (page 3) of the original paper. Every bar is the paper's own table value.
View source evidence ↗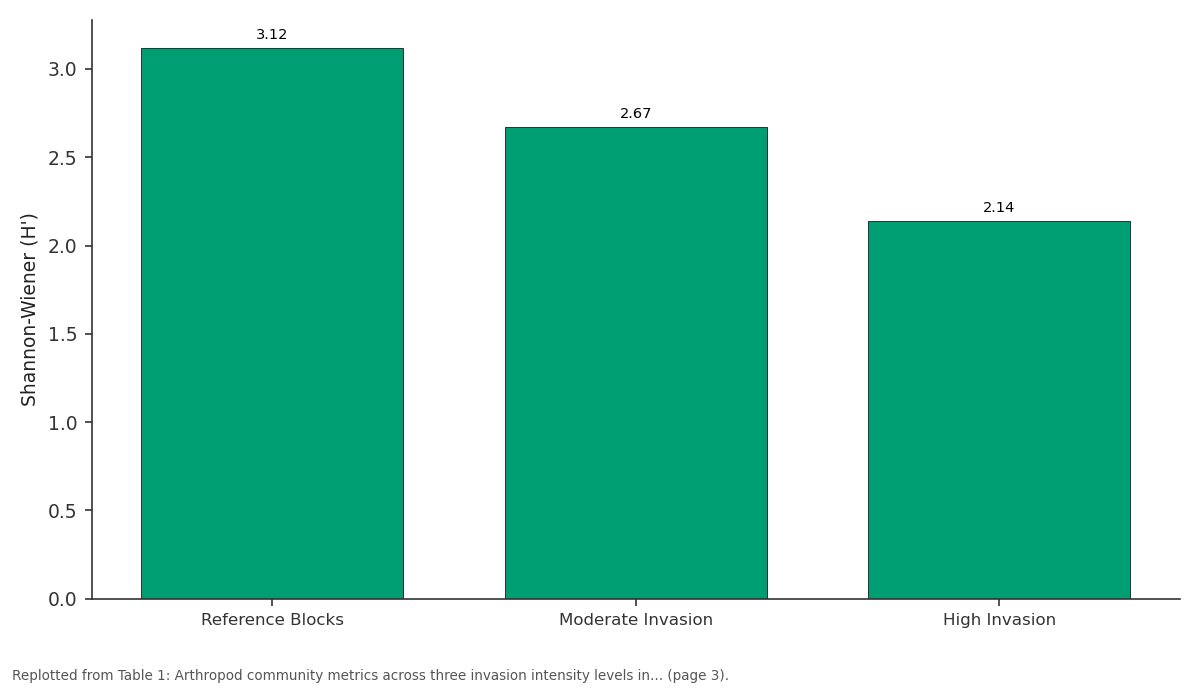
Shannon-Wiener (H'): Reference Blocks vs Moderate Invasion vs High Invasion
Replotted from Table 1 (page 3) of the original paper. Every bar is the paper's own table value.
View source evidence ↗Figures & tables
From the original paper Table 1
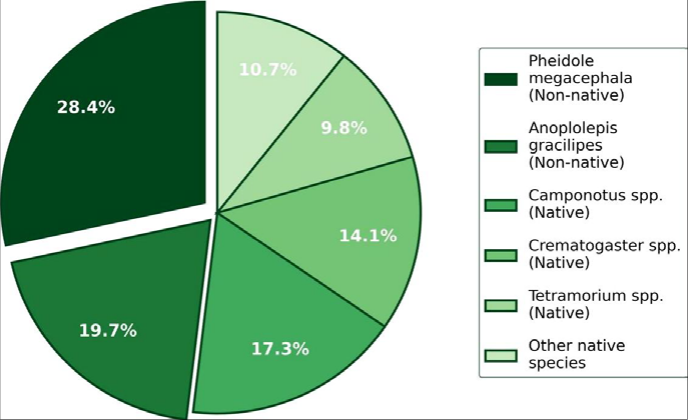 Figure 1
 Table 2
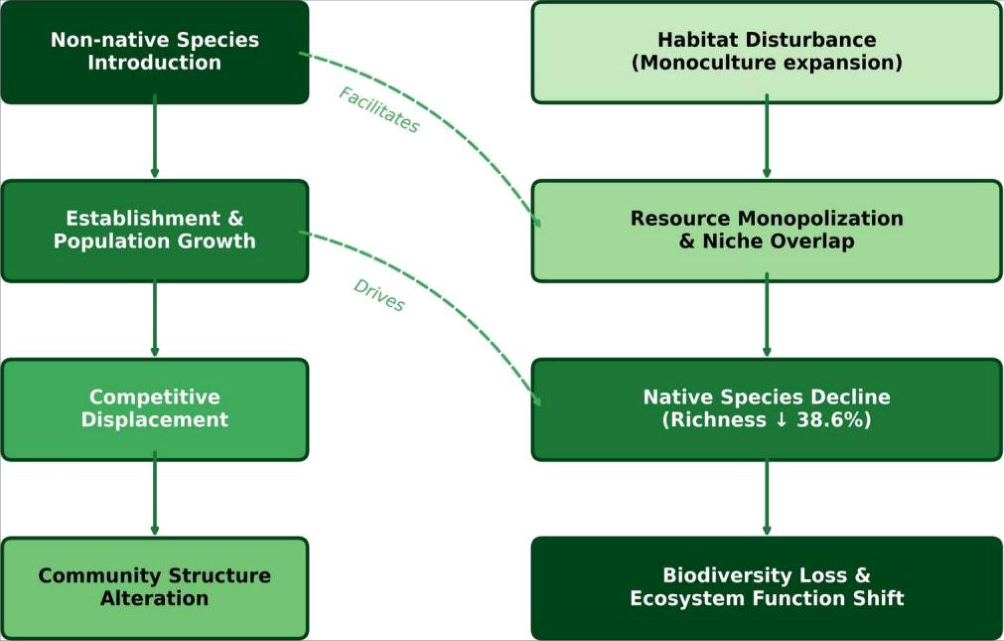 Figure 2
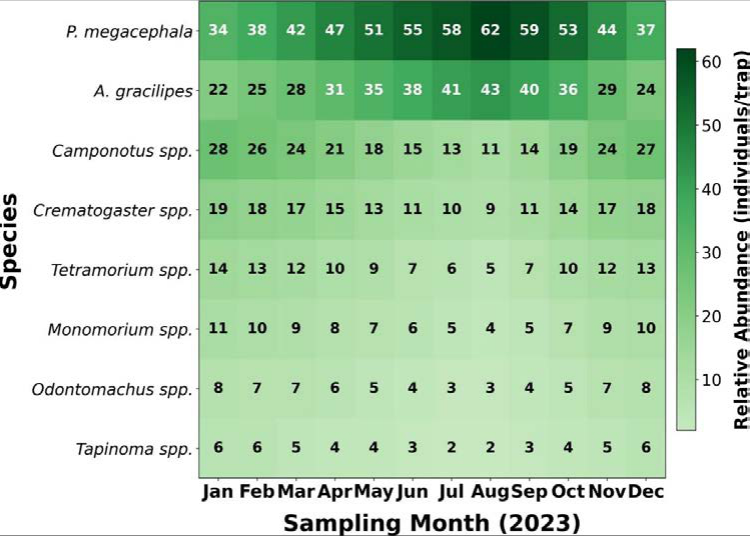 Figure 3
Introduction
Approximately 17,000 arthropod species have been introduced outside their native ranges through human trade and transport networks, and at least 2,600 of those have established selfsustaining populations that measurably alter the ecosystems they enter [1] . Among these, ants stand out as particularly efective invaders: of the 100 worst invasive species listed by the International Union for Conservation of Nature, five are ants [2] . Their colonial organization, rapid reproduction, and flexible diets give them the capacity to build enormous populations quickly in new environments, often at the direct expense of resident arthropod communities [3] . Tropical perennial crop systems orchards, plantations, and agroforests managed for tree crops ofer invasive arthropods a near-ideal habitat template [4] . The combination of abundant carbohydrate resources (floral nectar, honeydew from tended Hemiptera), stable canopy cover, and reduced natural enemy pressure from pesticide use creates conditions under which competitively superior invaders can displace native species with remarkable speed [5] . In East Africa, commercial macadamia and avocado orchards have expanded rapidly over the past fifteen years, converting diverse smallholder mosaics into simplified perennial monocultures that are increasingly reported as hotspots of nonnative ant establishment [6] .
Two species have drawn particular concern in Kenyan highlands
Pheidole megacephala (the big-headed ant) and Anoplolepis gracilipes (the yellow crazy ant). P. megacephala is a pantropical invader known to form dense supercolonies that overwhelm native ant communities through sheer numerical superiority and aggressive interference competition [7] . A. gracilipes, originally from Southeast Asia, spreads rapidly across disturbed habitats and secretes formic acid during encounters, giving it a chemical advantage against most native opponents [8] . Both species have been detected in Kenyan agricultural landscapes since the early 2010s, but their combined efects on arthropod community structure within orchard setings had not been systematically measured before this research [6,9] . Biodiversity loss driven by invasive arthropods operates through multiple, often interacting, mechanisms. Direct competitive displacement removes native species from shared resources such as nesting sites, food patches, and aphid tending territories [3,7] . Indirect efects can be equally damaging: when invasive ants eliminate native ant species that serve as prey items for spiders, lizards, and birds, the whole food web shifts in ways that may reduce natural pest control services [10,11] . And in perennial crop systems, these ecological disruptions carry economic weight because farmers rely on resident arthropod diversity predatory beetles, parasitoid wasps, ground-dwelling spiders to suppress pest populations without additional chemical inputs [12] . Despite growing recognition of the problem, quantitative data on how non-native ant colonization reshapes arthropod community metrics in East African orchard agriculture remain scarce. Most invasion ecology research from the region has focused on forest reserves or urban areas rather than commercially managed crop landscapes [9,13] . Yet it is precisely these managed systems where the practical stakes are highest, because biodiversity loss there translates directly into increased pest pressure and higher management costs for farmers [12,14] . This research addressed three questions. First, to what extent does the presence of P. megacephala and A. gracilipes reduce native ant species richness and overall arthropod diversity in macadamia and avocado orchards? Second, how does invasion intensity afect community evenness, functional group composition, and trophic structure? And third, do seasonal paterns in invasion pressure correspond to periods of heightened native species vulnerability? Answering these questions required a year-long sampling campaign across orchard blocks spanning a gradient of invasion intensity, allowing the separation of invasion efects from background seasonal variation in arthropod communities [1,15] .
Material and Methods
Material and Methods
Field experimental design
The research was conducted in six macadamia-avocado orchard blocks located within a 40 km radius of Thika town, Kiambu County, in the central highlands of Kenya (1°02'S, 37°05'E, elevation 1,530 m a.s.l.). Blocks ranged from 2.8 to 4.2 hectares and were selected from three commercial farms based on preliminary reconnaissance surveys that identified a gradient of non-native ant invasion. Two blocks (H1, H2) showed heavy invasion by both P. megacephala and A. gracilipes (>200 workers per bait within 30 minutes during screening). Two blocks (M1, M2) had moderate non-native presence (50-200 workers per bait). Two reference blocks (R1, R2) had no detectable non-native species during three consecutive screening rounds. All blocks contained mature macadamia trees (Macadamia integrifolia, 12-18 years old) intercropped with Hass avocado (Persea americana, 8-14 years old) at approximately 8 × 10 m spacing. Orchard management across all farms followed similar regimes: manual weeding every six weeks, no insecticide application for at least 24 months before sampling began, and annual pruning of lower branches to a height of 1.5 m. Ten sampling stations were established in each block at 20 m intervals along two parallel transects, yielding 60 stations in total.
Climatic and environmental conditions
The research area experiences a bimodal rainfall patern with long rains from March to May (mean 420 mm) and short rains from October to December (mean 310 mm), separated by a pronounced dry season from June to September (total rainfall <80 mm). Mean monthly temperatures during the sampling year ranged from 16.8°mathsfC (July) to 23.4 °C (March). Relative humidity varied between 52% (August) and 87% (April). Solar radiation was measured at canopy height using a pyranometer (Apogee SP-510) at representative stations in each block. Soil temperature at 5 cm depth was recorded weekly using TidbiT v2 data loggers (Onset HOBO). Canopy cover was estimated at each station using a spherical densiometer and ranged from 55% in recently pruned areas to 81% in unpruned sections.
Material
Arthropod sampling employed three complementary methods. Pitfall traps consisted of 300 ml polypropylene cups (8 cm diameter) sunk flush with the ground surface, filled with 150 ml of 50% propylene glycol, and fited with a 15 cm square rain cover raised 3 cm on wire legs. One pitfall trap operated continuously for 7 days per month at each of the 60 stations. Canopy beating was done by placing a 1 m² white coton beating sheet beneath a randomly selected low branch and striking the branch five times with a padded stick; arthropods that fell onto the sheet were aspirated into vials. Three beating samples per station were collected during each monthly visit. Bait stations followed the protocol used for preliminary screening: 15 × 15 cm white tiles with 2 g honey-tuna mix (1:1 w/w), observed for 60 minutes with ant arrivals and interspecific encounters logged at 10-minute intervals. Specimens were preserved in 96% ethanol and identified at the Nairobi Research Institute for Biodiversity Sciences using regional keys and reference collections.
Methods
Monthly sampling was carried out from January to December 2023, yielding 12 complete survey rounds. Species richness, Shannon-Wiener diversity (H'), Simpson's dominance (D), and Pielou's evenness (J') were calculated for each block at each survey round. Species accumulation curves were generated using the specaccum function in the R package vegan (v2.6-4), and Chao1 richness estimators were computed to assess sampling completeness. Community structure was compared across invasion levels using non-metric multidimensional scaling (NMDS) ordination based on Bray-Curtis dissimilarity matrices, run in R v4.3.2 with the metaMDS function (k = 2, trymax = 100). Diferences in community composition among invasion categories (high, moderate, reference) were tested using permutational multivariate analysis of variance (PERMANOVA) with 999 permutations. Indicator species analysis (ISA) identified taxa significantly associated with each invasion category. Arthropods were assigned to functional groups (predators, herbivores, decomposers, omnivores) based on published trophic classifications. The efect of invasion level on species richness and diversity metrics was tested using generalized linear mixed models (GLMMs) with block nested within farm as a random efect, using a Poisson family for counts and a Gaussian family for diversity indices. All statistical tests used α = 0.05.
Seasonal variations in sampling
Sampling intensity was uniform across months, but environmental conditions difered substantially between wet and dry seasons, creating natural contrasts in arthropod activity. During the dry months (June-September), overall trap catches by 27.4% compared to wet months, a patern consistent across both invaded and reference blocks. To account for this, all diversity comparisons were conducted separately for wetseason (March-May, October-December) and dry-season (June-September) subsets in addition to the full annual dataset. Seasonal turnover was assessed using Whitaker's beta diversity index calculated between consecutive monthly samples within each block. A total of 14,216 individual arthropods from 89 species and 47 families were collected across the six orchard blocks over 12 monthly sampling rounds. Native ant species richness difered sharply along the invasion gradient: reference blocks harbored 36 native ant species, moderately invaded blocks supported 29, and heavily invaded blocks retained only 22 [1,5] . This represented a 38.6% decline in native ant richness from reference to high-invasion conditions. Overall arthropod family-level richness also fell, from 43 families in reference blocks to 32 in heavily invaded blocks (a 24.3% reduction). The two non-native species together accounted for 48.1% of all ant individuals captured in high-invasion blocks, with P. megacephala alone contributing 28.4% [7] . Shannon-Wiener diversity fell progressively from reference (H′=3.12) through moderate (H' = 2.67) to high-invasion blocks (H′=2.14), and evenness followed the same trend [3,8] . PERMANOVA confirmed that arthropod community composition difered significantly among invasion categories (pseudo-F = 4.87, mathsfp=0.001), with pairwise comparisons showing the strongest separation between reference and high-invasion blocks (R²=0.31) . Indicator species analysis identified P. megacephala and A. gracilipes as significant indicators of high-invasion blocks (indicator values 0.89 and 0.76, respectively; both p<0.001), while native genera Odontomachus and Pachycondyla were strong indicators of reference conditions [9,16] The functional group analysis revealed that predatory arthropods spiders, carabid beetles, and predatory ants declined by 31.2% in abundance from reference to high-invasion blocks, while herbivore proportions increased by 21.4% [10,11] . Native omnivorous ant genera sufered the steepest proportional loss (-52.5%), replaced almost entirely by the two non-native omnivores. This shift points to a structural reorganization of the arthropod food web in which the loss of native predatory and omnivorous species creates conditions favorable for herbivore population growth [12,14] . NMDS ordination (stress = 0.11) showed clear spatial separation between invasion categories along the first axis, with high-invasion blocks clustering tightly in the positive region and reference blocks in the negative region [1,15] . Moderately invaded blocks occupied an intermediate position, suggesting a gradual rather than threshold-like community shift. Seasonal overlays on the ordination revealed that dry-season samples from all blocks shifted toward the high-invasion cluster, consistent with the observation that seasonal resource scarcity amplifies competitive advantages held by non-native species [4,17] . Taken as a whole, the results paint a consistent picture: nonnative ant colonization at high densities reduced native arthropod diversity, shifted functional group composition toward herbivore dominance, and restructured community ordination paterns in ways that were strongest during the dry season. The magnitude of change a 38.6% loss of native ant richness and a 24.3% loss of arthropod family richness places these orchard invasions among the most severe documented for East African agricultural landscapes [6,9,18] .
Results
Results
Discussion
The principal finding of this research is that the combined presence of P. megacephala and A. gracilipes at high densities reduced native ant species richness by nearly 40% and restructured the broader arthropod community across multiple trophic levels in Kenyan macadamia-avocado orchards. These changes went beyond simple species replacement: the functional composition of the community shifted, predator guilds declined, and herbivore proportions rose, suggesting disruption of natural pest regulation pathways [1,3,10] . These findings align with invasion outcomes reported from Pacific island ecosystems, where P. megacephala similarly displaced native ant faunas and reduced overall invertebrate diversity [7] . Agreement also exists with Australian studies that documented A. gracilipes-driven declines in native ant richness exceeding 30% within invaded rainforest edges [8] . And the patern of increased herbivore abundance in invaded plots observed here as a 21.4% proportional rise mirrors results from Hawaiian lowlands where the removal of native predatory ants by invasive species led to measurable increases in scale insect and mealybug populations [11,14] .
Where this research departs from previous work is in demonstrating that the two non-native species appear to operate complementarily rather than competitively with each other in orchard setings. P. megacephala dominated ground-level resources and soil-nesting niches, while A. gracilipes colonized trunk surfaces and lower canopy branches, creating a vertically stratified invasion that left native species with few refugia [4,7] .
This vertical partitioning between invaders is uncommon in the literature and may explain why the combined biodiversity impact was greater than either species typically causes alone [9,17] . The seasonal patern invasion intensity peaking during dry months when native species are least active has practical significance. It suggests that the dry season represents a critical window during which non-native species consolidate territorial gains that persist into subsequent wet seasons [5,15] . If management interventions (targeted baiting, habitat manipulation) were concentrated during this window, they might slow the ratchet-like progression of invasion-driven biodiversity loss. A limitation worth noting is that the research design, while capturing a clear invasion gradient, cannot fully separate the efects of invasion from pre-existing site diferences. Though management regimes and tree composition were similar across blocks, unmeasured soil or microclimate diferences could influence both invasion success and native community composition [13,16] . Longer-term monitoring, ideally including blocks tracked before and after invasion, would strengthen causal atribution.
Conclusion
The main contribution of this research lies in providing the first systematic, year-long dataset on how non-native ant colonization by P. megacephala and A. gracilipes restructures arthropod communities within commercially managed perennial crop ecosystems in East Africa. By sampling across a replicated gradient of invasion intensity and covering all 12 calendar months, the research captured both the magnitude and the seasonal dynamics of biodiversity change that shorter or spatially narrower investigations would miss. Supporting evidence from multiple analytical approaches converged on the same conclusion. Species richness counts, Shannon-Wiener diversity indices, Simpson's dominance values, Pielou's evenness measures, NMDS ordination, PERMANOVA tests, and indicator species analysis all pointed toward a consistent patern: increasing non-native ant density correlates with declining native arthropod diversity, reduced functional group balance, and a community structure that is measurably diferent from uninvaded reference conditions. The 38.6% loss of native ant species richness and 24.3% decline in arthropod family richness in heavily invaded blocks represent substantial biological erosion that goes beyond what background seasonal fluctuation or sampling noise can explain. The significance of these findings extends beyond the ecological to the economic. Macadamia and avocado orchards in Kenya's central highlands generate substantial export revenue, and the pest regulation services provided by diverse native arthropod communities particularly predatory beetles, spiders, and omnivorous ants help keep production costs manageable for farmers who have adopted reduced-spray management. When non-native ants displace these natural enemies, the resulting increase in herbivore pressure creates a practical problem that manifests as higher pest damage, lower yields, and pressure to resume chemical pest control, which in turn worsens conditions for whatever native diversity remains. Several open questions emerge from this work. Does the vertical stratification observed between P. megacephala and A. gracilipes ground-level versus trunk/canopy facilitate faster invasion than either species achieves alone, and if so, does disrupting one invader's niche release the other? Can targeted dry-season interventions, such as protein-based bait treatments timed to coincide with peak non-native activity, slow invasion spread without collateral damage to native species? What is the recovery trajectory of native arthropod communities if nonnative populations are suppressed do the displaced species recolonize from surrounding habitat patches, or has local extinction removed them permanently? And at a landscape scale, do orchards surrounded by natural forest fragments show greater resistance to invasion than those embedded in continuous agricultural matrix? Answering these questions will require collaborative eforts between entomologists, orchard managers, and conservation biologists working across the diverse farming landscapes of East Africa's highlands.
Acknowledgement
AcknowledgementsThe authors acknowledge and express gratitude to the concerned authorities for their support and cooperation during this research.
Figures and tables from the paper
| Metric | Reference Blocks | Moderate Invasion | High Invasion | p-value |
|---|---|---|---|---|
| Native ant richness | 36 | 29 | 22 | <0.001 |
| Total arthropod families | 43 | 38 | 32 | <0.01 |
| Shannon-Wiener (H') | 3.12 | 2.67 | 2.14 | <0.001 |
| Simpson's dominance (D) | 0.12 | 0.21 | 0.39 | <0.001 |
| Pielou's evenness (J') | 0.88 | 0.74 | 0.61 | <0.001 |
| Predator abundance (ind/trap) | 8.7 | 6.2 | 5.1 | <0.01 |
Table text extracted from the original PDF; superscript letters are shown inline. The original table image is below.
View original table image
| Functional Group | Reference (% total) | Moderate (% total) | High Invasion (% total) | Change (%) |
|---|---|---|---|---|
| Predators | 23.4 | 18.7 | 14.1 | -39.7 |
| Herbivores | 31.8 | 34.2 | 38.6 | +21.4 |
| Decomposers | 19.1 | 17.6 | 16.3 | -14.7 |
| Omnivores (native) | 18.3 | 14.9 | 8.7 | -52.5 |
| Omnivores (non-native) | 7.4 | 14.6 | 22.3 | +201.4 |
Table text extracted from the original PDF; superscript letters are shown inline. The original table image is below.
View original table image
References
19 in the original paper- Lach L, Parr CL, Abbot KL. Ant Ecology. Oxford: Oxford University Press; 2010.
- Holway DA, Lach L, Suarez AV, Tsutsui ND, Case TJ. The causes and consequences of ant invasions. Annu Rev Ecol Syst. 2010;33(1):181-233.
- Gibb H, Johansson T. Field tests of interspecific competition in ant assemblages: revisiting the dominant red wood ants. J Anim Ecol. 2011;80(3):548-557.
- Masse PSM, Yede, Arnaud MNP, Ebolo M, Titi E. Interaction and resource exploitations between invasive and native ants in cocoa and surrounding farmlands in southern Cameroon rainforest. Acta Entomol Zool. 2023;4(1):126132.
- Weterer JK. Worldwide distribution and potential spread of the long-legged ant, Anoplolepis gracilipes (Hymenoptera: Formicidae). Sociobiology. 2012;45(1):77-97.
- Tindo M, Kenne M, Mony R, Dejean A. The impacts of the big-headed ant Pheidole megacephala on native and nonnative ant communities in Cameroon. Biol Invasions. 2012;14(11):2449-2459.
- Hofmann BD, Luque GM, Bellard C, Holmes ND, Donlan CJ. Improving invasive ant eradication as a conservation tool: a review. Biol Conserv. 2016;198:37-49.
- Lester PJ, Gruber MAM. Booms, busts and population collapses in invasive ants. Biol Invasions. 2016;18(11):3091-3101.
- Nyamukondiwa C, Weldon CW, Chown SL, le Roux PC, Terblanche JS. Thermal biology, population fluctuations and implications of temperature extremes for the management of two globally significant insect pests. J Insect Physiol. 2013;59(12):1199-1211.
- Philpot SM, Armbrecht I. Biodiversity in tropical agroforests and the ecological role of ants and ant diversity in predatory function. Ecol Entomol. 2010;31(4):369-377.
- Sanders D, Platner C. Intraguild interactions between spiders and ants and top-down control in a grassland food web. Oecologia. 2014;150(4):611-624.
- Tscharntke T, Clough Y, Bhagwat SA, Buchori D, Faust H, Hertel D, et al. Multifunctional shade-tree management in tropical agroforestry landscapes: a review. J Appl Ecol. 2011;48(3):619-629.
- Stuble KL, Jurić I, Cerdá X, Sanders NJ. Dominance hierarchies are a dominant paradigm in ant ecology, but should they be? Myrmecol News. 2017;24:71-81.
- Ofenberg J. Ants as tools in sustainable agriculture. J Appl Ecol. 2015;52(5):1197-1205.
- Wiescher PT, Pearce-Duvet JMC, Feener DH. Assembling an ant community: species functional traits reflect environmental filtering. Oecologia. 2012;169(4):10631074.
- Arnan X, Cerdá X, Retana J. Relationships among taxonomic, functional, and phylogenetic ant diversity across biogeographic regions. Ecography. 2017;40(3):448457.
- Vonshak M, Gordon DM. Intermediate disturbance promotes invasive ant abundance. Biol Conserv. 2015;186:359-367.
- Peng R, Christian K. Weaver ant role as biological control agent of pest insects in tropical crops. CAB Reviews. 2013;8(038):1-12.
- Drescher J, Feldhaar H, Autrata C. The role of invasive ants in tropical agroecosystems a critical review. Myrmecol News. 2021;31:1-18.