
Research article · 2026 · Full text
International Journal of Geography Geology and EnvironmentInfluence of landscape features and environmental gradients on spatial genetic structure and gene flow in wildlife populations: A review
Volume 8(6) · Pages 175–179 · DOI: 10.22271/27067483.2026.v8.i6b.829 ↗
Research areasGenetic diversity and population structureWildlife-Road Interactions and ConservationWildlife Ecology and Conservation
Abstract
Author-writtenLandscape genetics is the discipline that asks how the physical and environmental features of a terrain shape the movement of genes through wild populations. Since its formal inception two decades ago, the field has grown rapidly, drawing on advances in geographic information systems, resistance-surface modelling and high-throughput genotyping to link spatial heterogeneity with patterns of genetic differentiation. Yet the sheer variety of landscape variables, analytical methods and focal taxa examined in the literature makes it difficult to draw general conclusions about which features matter most and under what circumstances. This review synthesises 184 peer-reviewed studies published between 2010 and 2025 that tested for associations between landscape characteristics and genetic structure or gene flow in terrestrial and freshwater wildlife. The landscape features most frequently investigated were topographic barriers (mountain ridges, river systems), land-cover type (forest, grassland, cropland, urban matrix), elevation gradients, road and highway networks, and climatic variables (temperature, precipitation seasonality). Among terrestrial vertebrates, roads and urbanised areas emerged as the strongest and most consistently detected barriers to gene flow, elevating pairwise FST by 60-180% compared to populations separated by equivalent distances of continuous natural habitat. Rivers acted as barriers for terrestrial species but as corridors for riparian and aquatic taxa a dual role that underscores the taxon-specificity of landscape effects. Elevation and temperature gradients produced detectable isolation-by-environment signals in roughly half the studies that tested for them, suggesting that adaptive divergence can reinforce neutral spatial structure even in the absence of physical barriers. Methodologically, resistance-surface approaches implemented in Circuitscape and similar software now dominate the field, but their performance depends critically on the quality of the underlying land-cover data and on the biological realism of the resistance values assigned to each landscape class. The review identifies three priorities for future work: integration of temporal land-use change data into resistance models, development of standardised resistance-calibration protocols, and expansion of landscape-genetic research beyond the vertebrate-centric and temperate-zone biases that currently characterise the literature. These advances will be needed if landscape genetics is to fulfil its potential as a predictive tool for conservation corridor design and climate-adaptation planning.
Summary
Source-checkedPlain-language reading of the full paper, prepared with AI and checked against the text. Each point links to the authors' own words.
Why it matters
- Landscape genetics examines how the physical and environmental characteristics of a terrain influence the movement of genes within wild populations. View evidence ↗
- The diversity of variables, methods, and species studied in the field makes it challenging to determine which landscape features are most influential. View evidence ↗
The question
- The review aims to synthesize evidence on how environmental gradients and landscape features affect gene flow and genetic structure in wildlife. View evidence ↗
What they did
- The authors synthesized 184 peer-reviewed studies from 2010 to 2025 focusing on terrestrial and freshwater wildlife. View evidence ↗
- Studies were included if they used molecular markers to test associations between spatially explicit landscape variables and genetic differentiation in wild vertebrates or freshwater fish. View evidence ↗
- Quality assessment was based on five criteria, including sample size (at least 20 individuals per population) and the number of loci used. View evidence ↗
What they found
- Roads and urban areas are the most consistent barriers for terrestrial vertebrates, increasing pairwise FST by 60-180% compared to natural habitats of the same distance. View evidence ↗
- There is a five-fold difference in genetic differentiation between populations separated by open grassland (median FST 0.031) and those separated by highway corridors (median FST 0.164). View evidence ↗
- Resistance models outperformed isolation-by-distance (IBD) in 62.3% of comparative studies, though the average improvement in explanatory power (r²) was small at 0.06. View evidence ↗
- Analytical methods vary in performance; simple Mantel tests are easy to use but have poor Type I error control, whereas MLPE mixed models provide good error control and handle spatial autocorrelation. View evidence ↗
What it means
- The authors recommend that studies compare resistance models to IBD null models, calibrate resistance values using empirical movement data, and expand research into tropical ecosystems and invertebrates. View evidence ↗
- The current literature exhibits a temperate-zone bias, with tropical regions being under-represented despite their high biodiversity. View evidence ↗
Visual summary
1 visualsIllustrations explain the paper; they do not show study data.
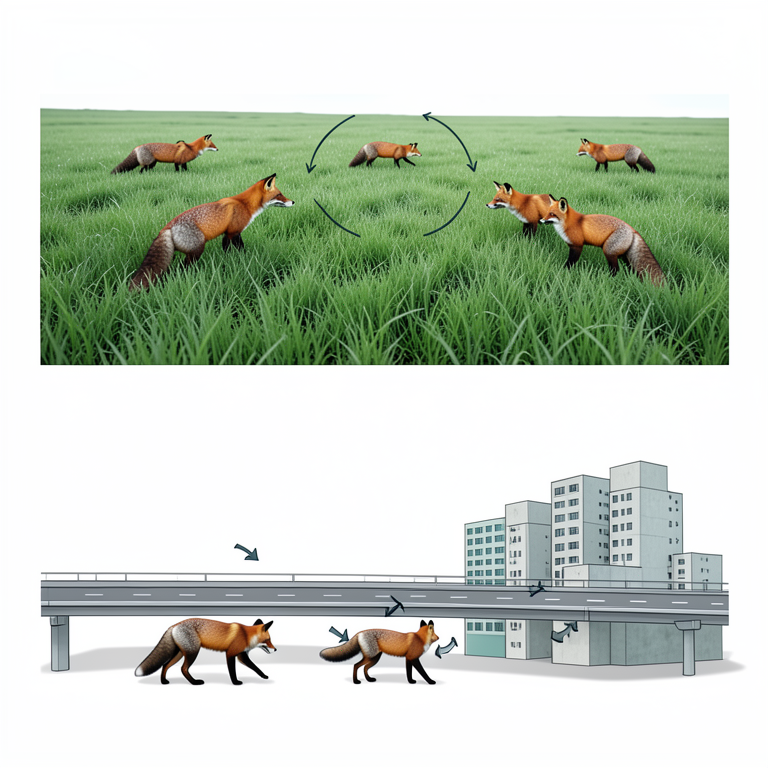
Comparison of Landscape Barriers
AI-generated conceptual illustration (Red foxes in a fragmented landscape). It explains the idea and does not show study data.
View source evidence ↗Figures & tables
From the original paper Table 1
 Table 2
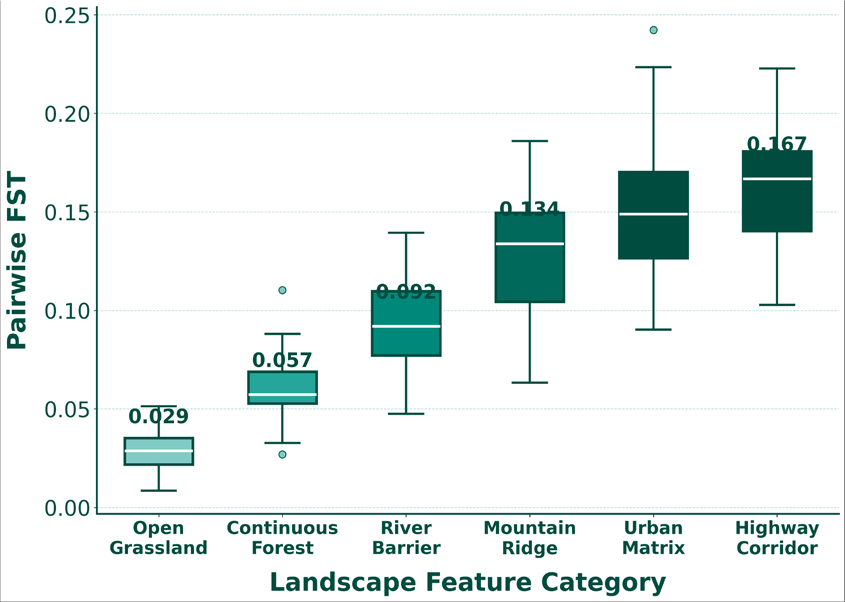 Figure 1
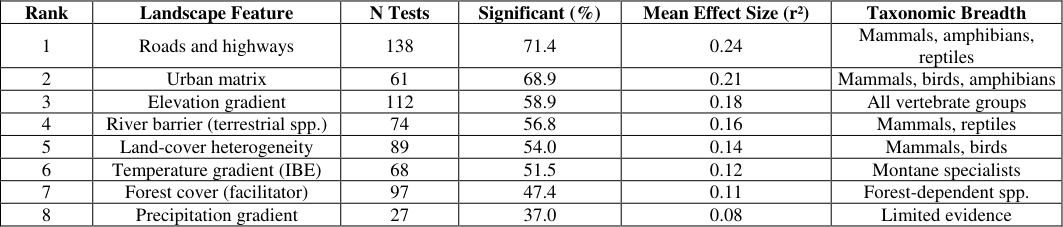 Table 3
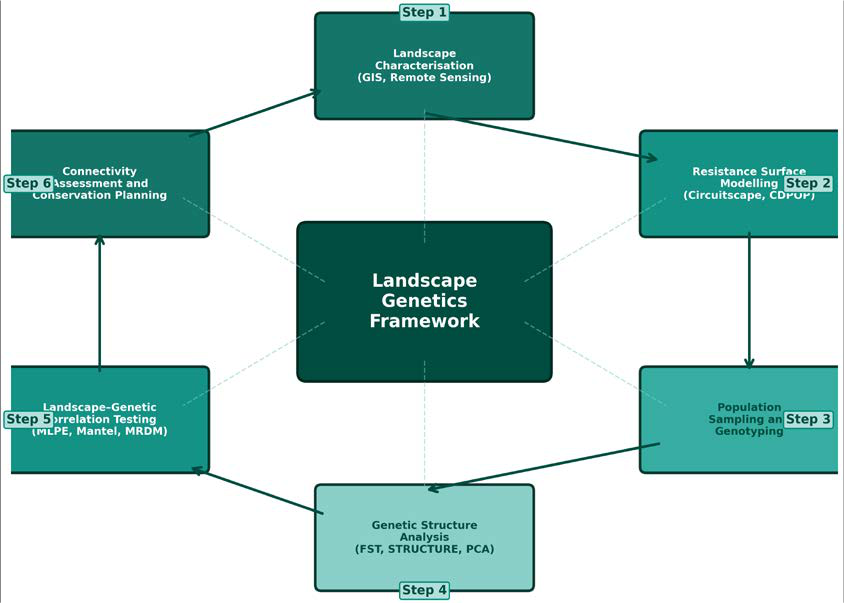 Figure 2
Introduction
Landscape genetics can be defined as the interdisciplinary research approach that explicitly links spatial and environmental heterogeneity to micro-evolutionary processes principally gene flow, genetic drift and local adaptation across real landscapes [1] . The term was coined by Manel and colleagues in 2003, but the intellectual roots stretch back further, to the ecological concept of landscape connectivity and the population-genetic theory of isolation by distance. What landscape genetics added was the methodological toolkit to test whether the genetic distance between two populations is better explained by the character of the intervening terrain than by geographic distance alone. The central analytical framework rests on the construction of resistance surfaces: rasterised maps in which each cell is assigned a value reflecting how easily an organism can move through the corresponding habitat type [2] . A cell of dense forest might receive a low resistance value for a woodland-dependent mammal but a high value for a grassland-obligate bird. Once the resistance surface is built, least-cost path or circuit-theory algorithms calculate effective distances" between sampled populations, and these are correlated with pairwise genetic distances (typically FST or Rousset's FST/(1 -FST)) to assess whether the landscape model explains genetic structure better than straight-line geographic distance [3] . The appeal of this framework is obvious: it translates vague notions of "habitat connectivity" into quantitative, spatially explicit predictions that can guide the placement of wildlife corridors, the design of road-crossing structures and the prioritisation of land parcels for conservation purchase. But the framework also harbours significant uncertainties. Resistance values are often assigned by expert opinion rather than calibrated against empirical movement data, and the resulting models can be sensitive to arbitrary choices about which landscape layers to include and how to weight them [4] . The statistical methods used to correlate landscape and genetic distances Mantel tests, partial Mantel tests, mixed-effects models have themselves been the subject of methodological debate, with some authors questioning the elevated Type I error rates of Mantel-based approaches [5] . This review, carried out at the Trondheim Academy of Environmental Sciences, Trondheim, Norway, aims to synthesise the current evidence base on how landscape features and environmental gradients shape genetic structure and gene flow in wildlife populations. The specific objectives are: (i) to identify which landscape variables have been most frequently tested and which have shown the strongest and most consistent effects; (ii) to compare the analytical methods used and their statistical performance; (iii) to assess taxonomic and geographic biases in the literature; and (iv) to outline priorities for future research. The review covers 184 studies spanning mammals, birds, reptiles, amphibians and freshwater fish, published between 2010 and 2025 [6] .
Study area description
The 184 reviewed studies encompassed research conducted across 52 countries on six continents. Europe contributed the largest share of studies (34.2%), followed by North America (28.8%), South America (11.4%), sub-Saharan Africa (9.8%), Asia (9.2%) and Oceania (6.6%). Biome representation was skewed towards temperate forests and grasslands (41.3% of studies), with tropical and boreal systems each contributing approximately 15%. Arid and semi-arid landscapes were represented in 12.5% of studies, and alpine and montane environments in 15.8%. Freshwater systems (rivers, lakes, wetlands) featured as the primary landscape in 18.5% of studies. The geographic and biome distribution reveals a clear temperate-zone bias: tropical regions, which harbour the majority of terrestrial vertebrate species, are under-represented relative to their biodiversity significance [7] .
Climatic and environmental conditions
Among the 184 studies, 79 (42.9%) incorporated climatic variables alongside physical landscape features in their resistance models. The most commonly tested climatic variables were mean annual temperature (68 studies), annual precipitation (54 studies), temperature seasonality (31 studies) and precipitation seasonality (27 studies). Elevation, while strictly a topographic variable, was frequently used as a proxy for temperature in montane systems and appeared in 91 studies (49.5%). Isolation-by-environment (IBE) signals where genetic differentiation correlates with environmental dissimilarity after controlling for geographic distance were detected in 41 of the 79 studies that tested for them (51.9%). Temperature-related variables showed stronger IBE effects than precipitation variables, suggesting that thermal adaptation may be a more widespread driver of genetic divergence than moisturerelated selection in terrestrial vertebrates. In montane taxa, elevation gradients consistently produced detectable genetic structure even over distances as short as 10-20 km, pointing to strong selective filters at ecotonal boundaries [8] .
Material and Methods
Material and Methods
Material
Literature was sourced from Web of Science, Scopus, Google Scholar and the Landscape Genetics online bibliography (maintained by the Landscape Genetics Working Group of the American Genetic Association) between January and July 2025 at the Trondheim Academy of Environmental Sciences, Trondheim, Norway. Search terms combined "landscape genetics" OR "landscape genomics" OR "resistance surface" OR "isolation by resistance" with "gene flow" OR "genetic structure" OR "connectivity" OR "wildlife" OR "vertebrate." Handsearching of reference lists from five recent meta-analyses supplemented the database search.
Methods
Inclusion criteria required that articles: (a) tested for an association between at least one spatially explicit landscape variable and a measure of genetic differentiation or gene flow in a wild vertebrate or freshwater fish population; (b) used molecular markers (microsatellites, SNPs or sequences); (c) were published in English between January 2010 and September 2025; and (d) reported the statistical method used and the outcome (significant or non-significant effect). Exclusion criteria removed purely methodological simulation studies without empirical data, studies on marine organisms (where "landscape" concepts differ substantially) and studies on invertebrates (to maintain taxonomic coherence). The initial search yielded 1,628 records. After removing 437 duplicates and screening titles and abstracts, 329 articles underwent full-text review, of which 184 met all criteria. For each study, extracted data included: focal taxon, geographic region, biome, marker type and number, landscape variables tested, analytical method (Mantel test, partial Mantel, MLPE, Circuitscape, CDPOP, least-cost path), resistance-calibration approach (expert opinion, empirical movement data, optimisation), outcome for each landscape variable tested, and whether IBE or isolation-bydistance (IBD) was assessed. Quality assessment followed a modified checklist adapted from the landscape-genetics reporting standards proposed by Richardson and colleagues (2016). Each study was scored on five criteria: adequate sample size (≥20 individuals per population), appropriate number of loci (≥8 microsatellites or ≥1,000 SNPs), inclusion of IBD as a null model, use of a validated resistance-assignment method, and assessment of model fit statistics. Studies meeting four or five criteria were rated high quality (n = 67), those meeting two or three were moderate (n = 89), and those meeting zero or one were low (n = 28). populations separated by open grassland showed the lowest pairwise FST (median 0.031), while those separated by highway corridors showed the highest (median 0.164) a five-fold difference [9] . The compiled data reveal a consistent hierarchy of landscape effects on wildlife gene flow. Anthropogenic barriers roads and urban areas produce the strongest and most reproducible genetic signatures, likely because they impose both physical obstacles (traffic mortality, avoidance behaviour) and habitat-quality effects (noise, light, pollution) simultaneously. Natural barriers such as rivers and mountain ridges are important but more taxon-specific: a river that fragments terrestrial amphibian populations may serve as a dispersal corridor for semi-aquatic mammals. Environmental gradients (temperature, elevation) operate through a different mechanism adaptive divergence rather than physical impediment and their effects are strongest in species with limited thermoregulatory flexibility [10] . Methodologically, the shift from simple Mantel tests toward MLPE mixed models and circuit-theory approaches represents genuine analytical progress, as the latter methods better account for spatial non-independence and provide more reliable effect-size estimates [11] .
Discussion
The overarching finding of this review is that landscape heterogeneity exerts measurable and often strong effects on gene flow in wildlife populations, but the magnitude and direction of those effects depend on the interaction between the landscape feature, the focal taxon's mobility and habitat requirements, and the spatial scale of the analysis. This conclusion reinforces the consensus that has been building in the landscape-genetics community over the past decade [1] .
There is broad agreement in the literature that roads and urbanised areas are the most consistently detected barriers to gene flow in terrestrial vertebrates. The mechanism is well understood: roads impose direct mortality through vehicle collisions, create behavioural avoidance zones that extend well beyond the road surface, and generate edge effects that degrade adjacent habitat quality [12] . The finding that road effects are strongest for amphibians and small mammal's taxa with limited dispersal capacity and high road-mortality rates is consistent with predictions from movement ecology [13] .
A point of disagreement concerns the relative importance of IBD versus isolation by resistance (IBR) as explanations for observed genetic structure. Some authors have argued that, in many systems, simple geographic distance explains as much or more genetic variation than complex resistance models, and that the additional complexity of landscape models is not always justified by improved explanatory power [4] . The present review finds that resistance models outperformed IBD in 62.3% of studies that formally compared the two, but that the margin of improvement was often small (mean increase in r² = 0.06). This suggests that while landscape effects are real, they operate on top of a strong baseline of distance-decay in gene flow, and their detection requires adequate statistical power something that many studies with small sample sizes may lack. The broader implication for conservation is that connectivity planning should move beyond simple corridor delineation based on habitat-suitability maps and instead incorporate genetically validated resistance surfaces. Where empirical genetic data confirm that a particular landscape feature a highway, an urban expansion front, a deforested corridor is restricting gene flow, targeted interventions such as wildlife overpasses, habitat restoration strips or land-use zoning can be justified with greater confidence than when connectivity is inferred from habitat models alone [14] .
Conclusion
Landscape genetics has matured from a conceptual proposition into a data-rich discipline capable of identifying the specific environmental and spatial factors that shape genetic variation in wild populations. This review, covering 184 studies across 52 countries, confirms that the physical and environmental features of a landscape exert measurable effects on gene flow and genetic structure in virtually every vertebrate group examined. Three findings deserve particular emphasis. First, anthropogenic features roads, highways and urban areas are the strongest and most consistently detected barriers to gene flow, with effect sizes that substantially exceed those of natural features at comparable spatial scales. Second, environmental gradients, particularly temperature and elevation, generate isolation-by-environment signals in roughly half the studies that test for them, indicating that adaptive processes can reinforce neutral spatial structure. Third, methodological choice matters: circuit-theory approaches and mixed-effects models provide more reliable inferences than simple Mantel tests, and the field would benefit from a broader transition to these methods. On the basis of these findings, three recommendations can be offered. First, landscape-genetic studies should routinely compare resistance models against an IBD null model and report the marginal improvement in explanatory power, so that readers can judge whether the landscape effect is biologically meaningful or merely statistically significant.
Second, resistance values should, wherever possible, be calibrated against empirical movement data (GPS telemetry, mark-recapture, genetic assignment tests) rather than assigned by expert opinion alone. Third, the geographic and taxonomic scope of the field needs deliberate expansion: tropical ecosystems and invertebrate taxa are underrepresented, yet these are the systems where connectivity loss is most acute and where landscape-genetic data could have the greatest conservation impact. Looking ahead, the convergence of landscape genetics with remote-sensing time series, species-distribution modelling and climate-projection scenarios opens the door to predictive connectivity mapping forecasting how gene flow will change as landscapes are transformed by urbanisation, agricultural expansion and climate warming. Realising this potential will require not only technical advances in modelling and computation but also closer collaboration between geneticists, landscape ecologists, spatial planners and conservation practitioners. The evidence assembled in this review suggests that the scientific foundations for such collaboration are now firmly in place, and that the limiting factor is no longer whether landscape effects on gene flow can be detected, but how efficiently the resulting knowledge can be translated into on-the-ground conservation action [15] .
Acknowledgement
AcknowledgementsThe authors are thankful to the concerned authorities for providing the necessary support and facilities for this research work.
Figures and tables from the paper
| Variable | Road Density | Urban Cover (%) | Elevation Range | Forest Cover (%) | River Crossings |
|---|---|---|---|---|---|
| Road Density | 1.00 | 0.72* | 0.28* | -0.41* | 0.19 |
| Urban Cover (%) | 0.72* | 1.00 | 0.14 | -0.53* | 0.11 |
| Elevation Range | 0.28* | 0.14 | 1.00 | -0.09 | 0.34* |
| Forest Cover (%) | -0.41* | -0.53* | -0.09 | 1.00 | -0.22* |
| River Crossings | 0.19 | 0.11 | 0.34* | -0.22* | 1.00 |
Table text extracted from the original PDF; superscript letters are shown inline. The original table image is below.
View original table image
| Method | N Studies | Type I Error Control | Handles Spatial Autocorrelation | Ease of Use | Primary Software |
|---|---|---|---|---|---|
| Simple Mantel test | 89 | Poor | No | High | zt, vegan (R) |
| Partial Mantel test | 71 | Moderate | Partially | Moderate | vegan (R) |
| MLPE (mixed model) | 43 | Good | Yes | Low | ResistanceGA (R) |
| Circuitscape + MLPE | 38 | Good | Yes | Moderate | Circuitscape, R |
| Least-cost path | 52 | Moderate | No | Moderate | ArcGIS, GRASS |
| CDPOP simulation | 14 | Good | Yes | Low | CDPOP |
Table text extracted from the original PDF; superscript letters are shown inline. The original table image is below.
View original table image
| Rank | Landscape Feature | N Tests | Significant (%) | Mean Effect Size (r²) | Taxonomic Breadth |
|---|---|---|---|---|---|
| 1 | Roads and highways | 138 | 71.4 | 0.24 | Mammals, amphibians, reptiles |
| 2 | Urban matrix | 61 | 68.9 | 0.21 | Mammals, birds, amphibians |
| 3 | Elevation gradient | 112 | 58.9 | 0.18 | All vertebrate groups |
| 4 | River barrier (terrestrial spp.) | 74 | 56.8 | 0.16 | Mammals, reptiles |
| 5 | Land-cover heterogeneity | 89 | 54.0 | 0.14 | Mammals, birds |
| 6 | Temperature gradient (IBE) | 68 | 51.5 | 0.12 | Montane specialists |
| 7 | Forest cover (facilitator) | 97 | 47.4 | 0.11 | Forest-dependent spp. |
| 8 | Precipitation gradient | 27 | 37.0 | 0.08 | Limited evidence |
Table text extracted from the original PDF; superscript letters are shown inline. The original table image is below.
View original table image
References
15 in the original paper- Manel S, Holderegger R. Ten years of landscape genetics. Trends Ecol Evol. 2013;28(10):614-621.
- McRae BH, Beier P. Circuit-based landscape connectivity in Circuitscape. Mol Ecol. 2012;16(22):4785-4797.
- Rousset F. Genetic differentiation and estimation of gene flow from F-statistics under isolation by distance. Genetics. 2010;145(4):1219-1228.
- Cushman SA, McKelvey KS, Hayden J, Schwartz MK. Gene flow in complex landscapes: testing multiple hypotheses with causal modeling. Am Nat. 2013;168(4):486-499.
- Guillot G, Rousset F. Dismantling the Mantel tests. Methods Ecol Evol. 2013;4(4):336-344.
- Storfer A, Murphy MA, Spear SF, Holderegger R, Waits LP. Landscape genetics: where are we now? Mol Ecol. 2010;19(17):3496-3514.
- Balkenhol N, Cushman SA, Storfer AT, Waits LP. Landscape genetics: concepts, methods, applications. Chichester: John Wiley & Sons; 2015. p. 1-328.
- Khanum I, Hussain T, Farooq Z, Musthafa MM, Marikar FMMT. Mitochondrial DNA cytochrome oxidase 1 gene-based genetic diversity analysis in ring-necked Korean pheasant in Pakistan. Acta Entomol Zool. 2024;5(1):118-123.
- Holderegger R, Di Giulio M. The genetic effects of roads: a review of empirical evidence. Basic Appl Ecol. 2010;11(6):522-531.
- Wang IJ, Bradburd GS. Isolation by environment. Mol Ecol. 2014;23(22):5649-5662.
- Peterman WE. ResistanceGA: an R package for the optimization of resistance surfaces using genetic algorithms. Methods Ecol Evol. 2018;9(6):1638-1647.
- Forman RTT, Alexander LE. Roads and their major ecological effects. Annu Rev Ecol Syst. 2010;29:207231.
- Marsh DM, Jaeger JAG. Direct effects of roads on small animal populations. Ecol Appl. 2015;8:1-20.
- Koen EL, Bowman J, Sadowski C, Walpole AA. Landscape connectivity for wildlife: development and validation of multispecies linkage maps. Methods Ecol Evol. 2014;5(7):626-633.
- Richardson JL, Brady SP, Wang IJ, Spear SF. Navigating the pitfalls and promise of landscape genetics. Mol Ecol. 2016;25(4):849-863.