
Research article · 2026 · Full text
International Journal of Biology SciencesSeasonal variations in zooplankton concerning physicochemical conditions of the Darna River in Nashik district, Maharashtra
Volume 8(7) · Pages 262–267 · DOI: 10.33545/26649926.2026.v8.i7c.951 ↗
Research areasAquatic Ecosystems and Phytoplankton DynamicsWater Quality and Pollution AssessmentWater Quality and Resources Studies
Abstract
Author-writtenThis study investigated the spatiotemporal variations in zooplankton communities concerning physicochemical parameters in the Darna River, Maharashtra, across pre-monsoon (May) and post-monsoon (October) seasons of 2024. Water samples were collected monthly from four strategically chosen sites: Darna Dam, Shennit, Shevge Darna, and Darna Sangavi, representing varying anthropogenic influences. Analysis revealed significant seasonal fluctuations in key parameters, including dissolved oxygen (DO), biochemical oxygen demand (BOD), total dissolved solids (TDS), and temperature. Zooplankton diversity, comprising Rotifera, Cladocera, Copepoda, and Ostracoda, was highest during the pre-monsoon period at all sites, strongly correlating with elevated temperatures and nutrient availability. Sites proximal to human settlements and industrial discharge (Shevge Darna, Darna Sangavi) exhibited persistently degraded water quality, evidenced by critically low DO (<1 mg/L) and high BOD (>60 mg/L) levels. These results underscore the severe impact of anthropogenic pressures on the river's ecological health, with zooplankton communities serving as effective bioindicators of pollution stress.
Summary
Source-checkedPlain-language reading of the full paper, prepared with AI and checked against the text. Each point links to the authors' own words.
Why it matters
- The Darna River in Nashik District is an ecologically important water body that supports various fish species and is vital for the local community. View evidence ↗
- The river faces pollution challenges, partly due to the disposal of ritual waste from puja offerings and holy dips. View evidence ↗
- Rapid industrial growth and new settlements in Nashik have increased the pressure on the region's water resources. View evidence ↗
The question
- The study aimed to investigate how zooplankton communities and water physicochemical parameters varied across space and time during the pre-monsoon and post-monsoon seasons of 2024. View evidence ↗
What they did
- Water samples were collected monthly from four sites with different levels of human influence: Darna Dam, Shennit, Shevge Darna, and Darna Sangavi. View evidence ↗
- The researchers measured pH, dissolved oxygen (DO), biochemical oxygen demand (BOD), total dissolved solids (TDS), and temperature using APHA standard methods. View evidence ↗
- Zooplankton were analyzed by filtering 50 liters of surface water through a bolting silk net and fixing the filtrate in a 4% formaldehyde solution. View evidence ↗
- The study used Principal Component Analysis (PCA) and Multivariate Analysis of Variance (MANOVA) to statistically validate water quality patterns. View evidence ↗
What they found
- Water temperature showed a seasonal decrease from a peak of 39-43°C in May to 28-35°C in October. View evidence ↗
- Water quality varied sharply by location: Darna Dam had healthy DO (7.02-7.60 mg/L) and low BOD (3.10-5.20 mg/L), while Darna Sangavi had critically low DO (0.1-1.7 mg/L) and high BOD (39.8-69 mg/L). View evidence ↗
- Total Dissolved Solids (TDS) and turbidity were highest at the Darna Sangavi site, reaching 660-710 mg/L and 40-46 NTU respectively. View evidence ↗
- Zooplankton abundance and diversity peaked in May (pre-monsoon) due to higher temperatures and more available phytoplankton food. View evidence ↗
- The presence of pollution-tolerant Rotifera genera, such as Brachionus and Keratella, at Shevge Darna and Darna Sangavi indicates eutrophic conditions. View evidence ↗
- PCA analysis differentiated the sites, associating Darna Dam and Shennit with higher DO and balanced pH, while Darna Sangavi correlated with higher TDS and temperature. View evidence ↗
What it means
- The authors conclude that there is a clear inverse relationship between human-caused pollution and the river's ecological health, with Shevge Darna and Darna Sangavi identified as critically degraded. View evidence ↗
- The authors recommend implementing watershed management, stricter industrial discharge regulations, and public awareness campaigns to protect the river's biodiversity. View evidence ↗
Visual summary
3 visualsIllustrations explain the paper; charts are replotted from the paper's own table values.
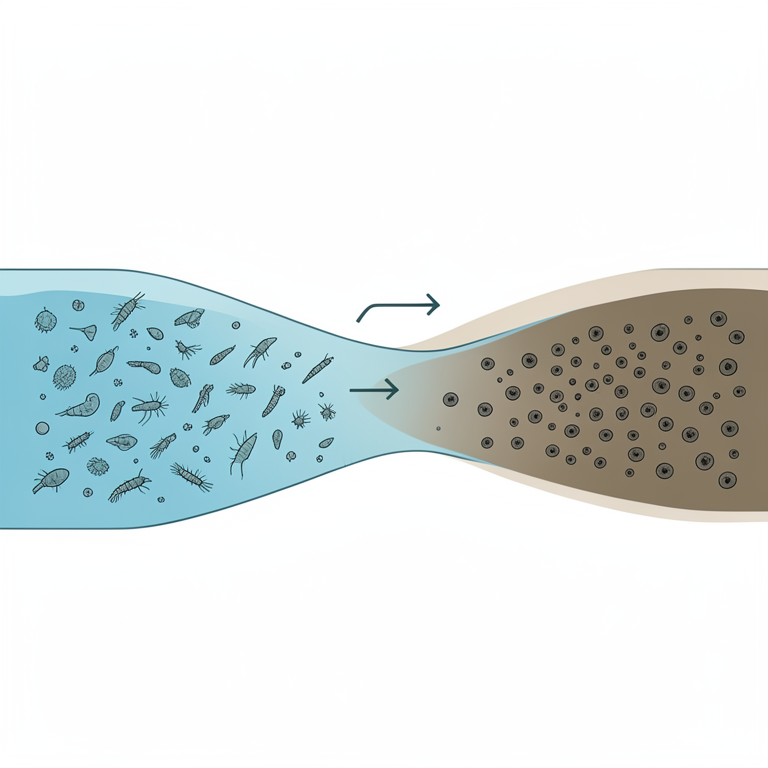
Pollution Gradient and Biological Response
AI-generated conceptual illustration (Zooplankton in the Darna River). It explains the idea and does not show study data.
View source evidence ↗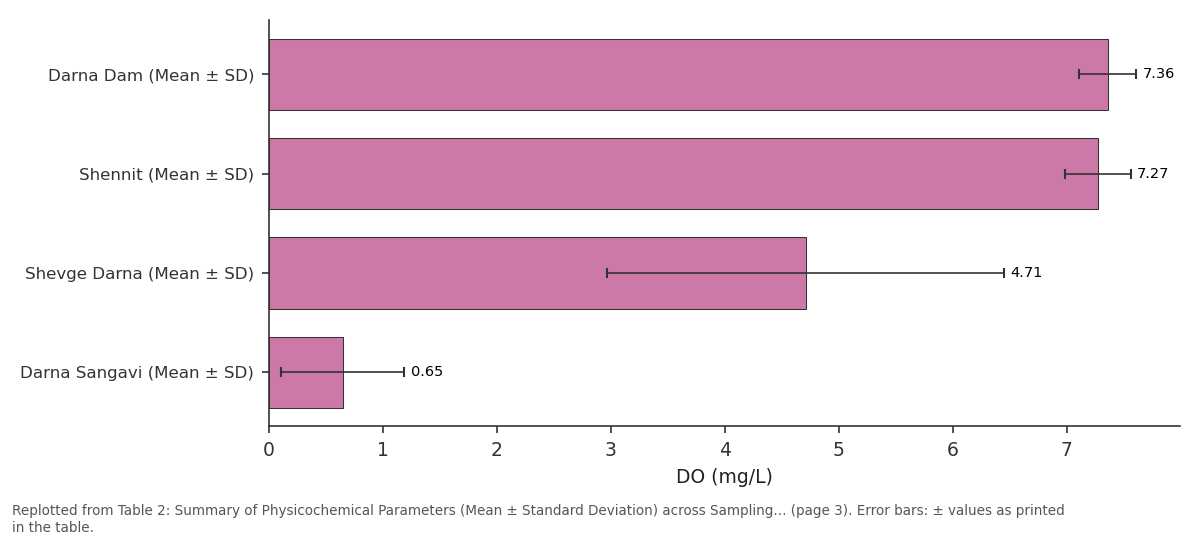
DO (mg/L): Darna Dam (Mean ± SD) vs Shennit (Mean ± SD) vs Shevge Darna (Mean ± SD) vs Darna Sangavi (Mean ±...
Replotted from Table 2 (page 3) of the original paper. Every bar is the paper's own table value.
View source evidence ↗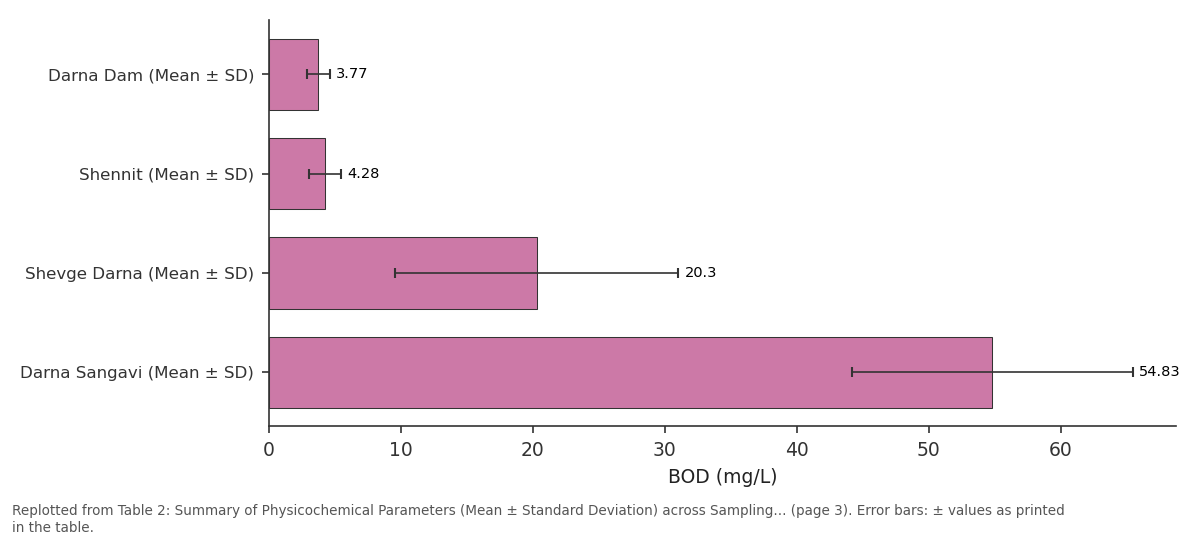
BOD (mg/L): Darna Dam (Mean ± SD) vs Shennit (Mean ± SD) vs Shevge Darna (Mean ± SD) vs Darna Sangavi (Mean ±...
Replotted from Table 2 (page 3) of the original paper. Every bar is the paper's own table value.
View source evidence ↗Figures & tables
From the original paper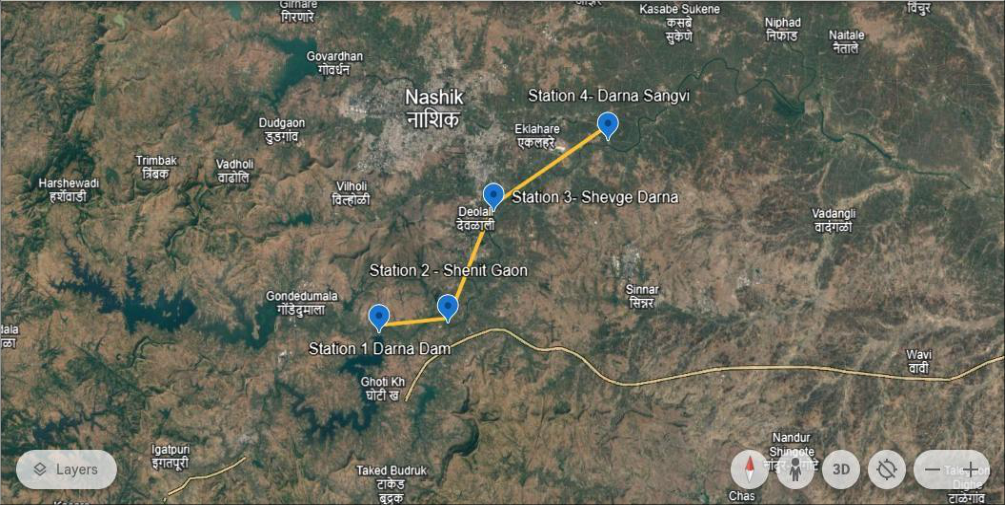 Figure 1
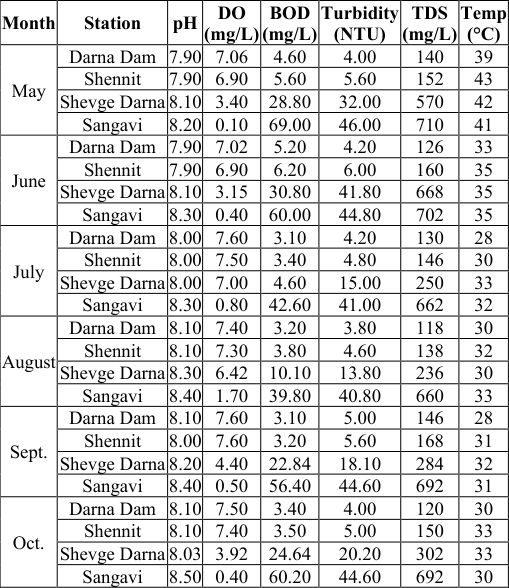 Table 1
 Table 2
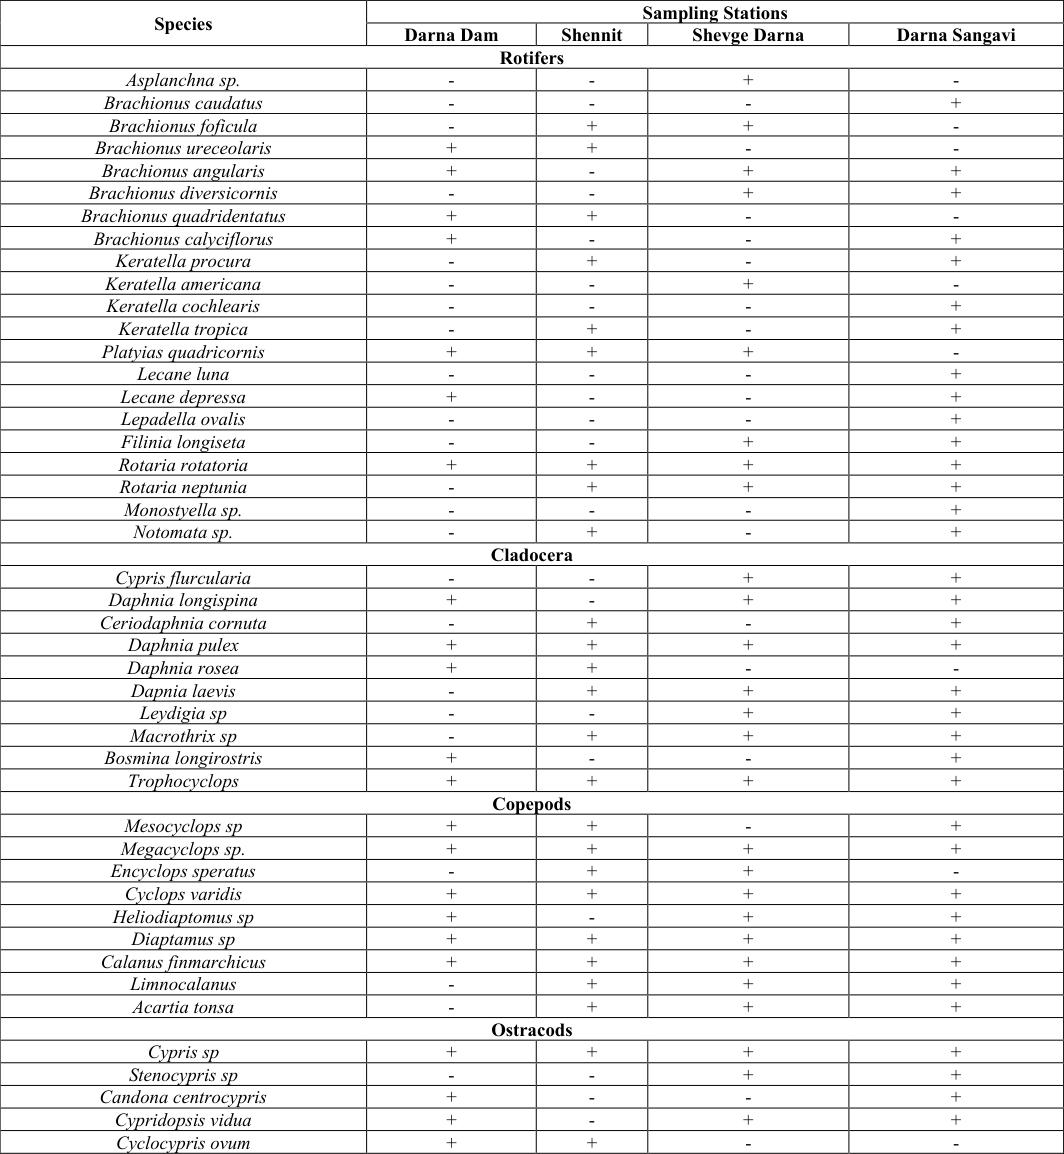 Table 3
 Table 4
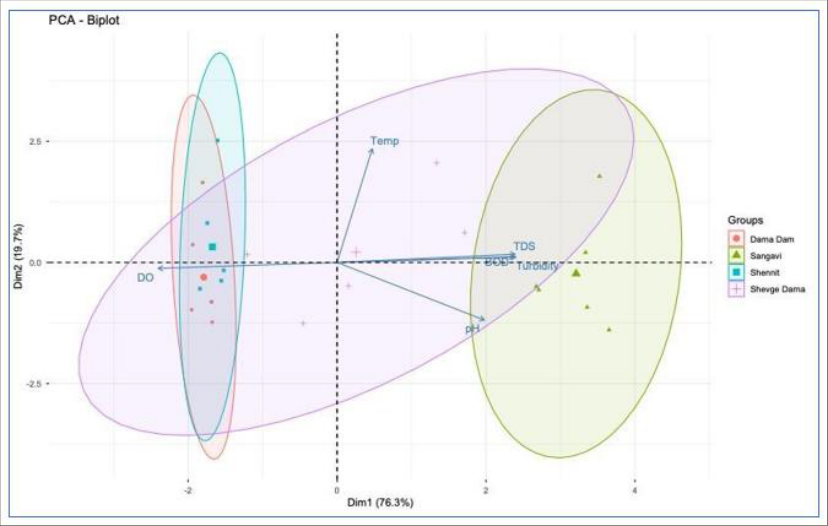 Figure 2
Introduction
Water is one of the most precious resources on Earth. It is essential for life; without water, life as we know it could not exist. Life originated in water, and many species thrive exclusively in aquatic environments (Trivedi, 2004) [30] . Water possesses unique properties crucial for the functioning of the biosphere (Ghose, 2002) [13] . Approximately 97% of the Earth's water is found in glaciers and polar ice, while 0.009% exists in lakes. The percentage of water present in rivers is 0.00009%, and the remaining water is found as groundwater. Consequently, only about 1% of all water on the planet is actively utilised by living organisms, highlighting the importance of maintaining water quality. If pure water were used for drinking, around 98% of waterborne diseases could be controlled (Kudeshia, 2003) [19] . The Darna River in Nashik District is an ecologically significant water body, supporting diverse aquatic life, including a variety of fish species (Kakulate & Tidme, 2018) [16] , and plays a vital role for the local population. The river originates from the Kulung Hill Fort in the Sahyadri range. It flows through Igatpuri, Nashik, and Niphad Talukas of Nashik District, making it essential for nearby communities. However, the river has faced significant water pollution challenges in recent years. Various rituals, including puja offerings and holy dips, are performed at the confluence with the Godavari River. Unfortunately, the disposal of ritual waste at multiple points along the river's course contributes to pollution. Moreover, Nashik is experiencing rapid industrial growth, attracting individuals seeking employment and establishing new settlements. This growth has increased pressure on water and other local resources (Bawa & Gaikwad, 2013) [4] . Seasonal changes impact various factors, including water quality, so the study focused on the pre-monsoon and post-monsoon periods. The parameters examined included physical and biological aspects such as pH, BOD, and turbidity.
Materials and Methods
This paper examines the changes in river water's physicochemical and biological properties during the premonsoon and post-monsoon seasons. Water samples were collected from four selected sites for the study: 1) Darna Dam, 2) Shennit, 3) Shevge Darna, and 4) Darna Sangavi (see Figure 1). These sites were selected because they are areas where changes in water quality are easily observed. Water either accumulates in these locations due to various human activities or is utilized by people for different purposes. As a result, the findings will be more accurate as compared to areas where the river flows continuously. Water samples were collected monthly from May 2024 to October 2024 at the specified sites. These samples were analysed in a laboratory for physical and chemical parameters, including pH, dissolved oxygen (DO), biochemical oxygen demand (BOD), total dissolved solids (TDS), and temperature, using standard methods outlined by APHA (2005) [1] .
To analyse the biological factors such as plankton, 50 litres of surface water was filtered through a small plankton net constructed from bolting silk number 25. The filtrate was then transferred into a 4% formaldehyde solution for fixation. A 10 ml sample was taken in two separate tubes for centrifugation in the laboratory. The samples were centrifuged for 10 minutes at 1500 revolutions per minute. The supernatant was discarded, and the remaining sample was placed onto a clean glass slide. A clean cover slip was then used to observe the sample under a light microscope. The samples were examined for both the pre-monsoon and post-monsoon seasons.
Results and Discussion
Results and Discussion
Physicochemical Parameters
The analysis of physicochemical parameters revealed significant spatial and temporal variations across the four sampling stations, highlighting the influence of both seasonal cycles and anthropogenic pressure. Temperature exhibited a clear seasonal trend, decreasing from a peak in the pre-monsoon summer (May, 39-43°C) to lower values during and after the monsoon (28-35°C in October) (Table 1). This pattern is consistent with the regional climatology.
| Month | Station | pH | DO (mg/L) | BOD (mg/L) | Turbidity (NTU) | TDS (mg/L) | Temp (°C) |
|---|---|---|---|---|---|---|---|
| May | Darna Dam | 7.90 | 7.06 | 4.60 | 4.00 | 140 | 39 |
| Shennit | 7.90 | 6.90 | 5.60 | 5.60 | 152 | 43 | |
| Shevge Darna | 8.10 | 3.40 | 28.80 | 32.00 | 570 | 42 | |
| Sangavi | 8.20 | 0.10 | 69.00 | 46.00 | 710 | 41 | |
| June | Darna Dam | 7.90 | 7.02 | 5.20 | 4.20 | 126 | 33 |
| Shennit | 7.90 | 6.90 | 6.20 | 6.00 | 160 | 35 | |
| Shevge Darna | 8.10 | 3.15 | 30.80 | 41.80 | 668 | 35 | |
| Sangavi | 8.30 | 0.40 | 60.00 | 44.80 | 702 | 35 | |
| July | Darna Dam | 8.00 | 7.60 | 3.10 | 4.20 | 130 | 28 |
| Shennit | 8.00 | 7.50 | 3.40 | 4.80 | 146 | 30 | |
| Shevge Darna | 8.00 | 7.00 | 4.60 | 15.00 | 250 | 33 | |
| Sangavi | 8.30 | 0.80 | 42.60 | 41.00 | 662 | 32 | |
| August | Darna Dam | 8.10 | 7.40 | 3.20 | 3.80 | 118 | 30 |
| Shennit | 8.10 | 7.30 | 3.80 | 4.60 | 138 | 32 | |
| Shevge Darna | 8.30 | 6.42 | 10.10 | 13.80 | 236 | 30 | |
| Sangavi | 8.40 | 1.70 | 39.80 | 40.80 | 660 | 33 | |
| Sept. | Darna Dam | 8.10 | 7.60 | 3.10 | 5.00 | 146 | 28 |
| Shennit | 8.00 | 7.60 | 3.20 | 5.60 | 168 | 31 | |
| Shevge Darna | 8.20 | 4.40 | 22.84 | 18.10 | 284 | 32 | |
| Sangavi | 8.40 | 0.50 | 56.40 | 44.60 | 692 | 31 | |
| Oct. | Darna Dam | 8.10 | 7.50 | 3.40 | 4.00 | 120 | 30 |
| Shennit | 8.10 | 7.40 | 3.50 | 5.00 | 150 | 33 | |
| Shevge Darna | 8.03 | 3.92 | 24.64 | 20.20 | 302 | 33 | |
| Sangavi | 8.50 | 0.40 | 60.20 | 44.60 | 692 | 30 |
Table text extracted from the original PDF; superscript letters are shown inline. The original table image is below.
View original table image
It aligns with studies on other Indian rivers, such as the Godavari, where summer temperatures are typically highest due to increased solar irradiance and reduced water volume (Nalawade & Bagul, 2020) [22] . The clear seasonal trend in water temperature, peaking in the pre-monsoon summer, aligns with patterns documented in the Masoli reservoir (Kadam et al., 2007) [15] . pH values remained alkaline throughout the study period, ranging from 7.9 to 8.5 across all sites. The alkaline pH observed in the Darna River is consistent with findings from other water bodies in Maharashtra, such as the Sawana reservoir (Jayabhaye et al., 2008) [14] . A slight increase in pH was observed during the post-monsoon months, potentially due to reduced photosynthetic activity and lower levels of CO2 dissolution, a phenomenon also noted by Garg et al. (2010) [12] in Ramsagar reservoir. The most striking spatial gradient was observed in Dissolved Oxygen (DO) and Biochemical Oxygen Demand (BOD). The upstream site at Darna Dam maintained healthy DO levels (7.02-7.60 mg/L) and low BOD (3.10-5.20 mg/L), indicating good water quality. In stark contrast, the Darna Sangavi site consistently showed critically low DO (0.1-1.7 mg/L) and alarmingly high BOD (39.8-69 mg/L) (Fig. X). These values far exceed the CPCB standards for outdoor bathing (BOD < 3 mg/L) and signify severe organic pollution, likely originating from the nearby thermal power plant and industrial discharge. Similarly, Shevge Darna showed degraded conditions, though less severe than Sangavi. This pattern of oxygen depletion downstream of pollution point sources is a well-documented global phenomenon (Cairns, 1997) [8] . The high BOD indicates a substantial load of biodegradable organic waste, leading to intense microbial respiration that consumes dissolved oxygen, as described by Trivedi (2004). The degraded water quality at the downstream stations, characterised by high BOD and low DO, presents a stark contrast to the conditions reported in well-managed lakes like Pakhal Lake in Andhra Pradesh (Vasumathi et al., 2009) [32] . Total Dissolved Solids (TDS) and Turbidity showed parallel trends. Values were lowest at the pristine Darna Dam site and highest at Darna Sangavi (TDS: 660-710 mg/L; Turbidity: 40-46 NTU). The monsoon season (July-August) initially increased turbidity at all sites due to surface runoff, as seen in the Kalawa lake study (Pejaver & Gurav, 2008) [25] , but a subsequent dilution effect was observed, slightly reducing TDS. The persistently high TDS at Sangavi and Shevge Darna directly indicates effluent discharge and anthropogenic input. The gradual increase in TDS from upstream to downstream sites mirrors observations in other impounded waters in the region, such as the Ruti dam (Kamble et al., 2009) [17] . Table 2 presents the physicochemical parameters observed at the various sampling sites along the Darna River, highlighting marked differences influenced by anthropogenic activities. The pH levels across all stations were slightly alkaline, with the highest value recorded at Darna Sangavi (8.35). This notable difference (p< 0.001) suggests that downstream human activities significantly alter the river's pH. Dissolved oxygen (DO) levels were high and stable at the upstream sites, averaging around 7.3 mg/L. However, a substantial decline was noted at Shevge Darna (4.7 mg/L), with a critically low level at Darna Sangavi (0.65 mg/L). This sharp decrease indicates severe organic pollution and oxygen depletion in the downstream areas. Biochemical Oxygen Demand (BOD) showed a pattern reflective of organic pollution, with low values at upstream stations (~4 mg/L) escalating dramatically to very high levels at Shevge Darna (20.3 mg/L) and reaching an extreme at Darna Sangavi (54.8 mg/L). These significant differences (p< 0.001) underscore the heavy organic load and untreated wastewater discharge impacting the river. Regarding turbidity, low levels were recorded at Darna Dam and Shennit (4-5 NTU), but a sharp increase was observed at Shevge Darna (23.8 NTU), with the highest readings at Darna Sangavi (42.9 NTU). This trend indicates considerable sediment and waste inflow from human activities. Total dissolved solids (TDS) reflected a similar pattern, gradually rising from upstream (130-152 mg/L) to midstream (385 mg/L) and peaking at Darna Sangavi (686 mg/L). This increasing trend (p< 0.001) points to the impacts of agricultural runoff, sewage, and effluents on water quality. Finally, while the temperature across all sites ranged from 31 to 34 °C, no significant differences were observed (p = 0.12), indicating that temperature does not play a significant role in driving variations in water quality among the sites.
One hundred eleven zooplankton species belonging to four major groups, Rotifera, Cladocera, Copepoda, and Ostracoda, were identified (Table 3). The physicochemical conditions profoundly influenced the community composition and distribution. Zooplankton diversity and abundance were highest across all sites during the premonsoon period (May). This proliferation can be attributed to elevated water temperatures, which enhance metabolic rates and reproductive cycles, and increased availability of phytoplankton as a food source (Battish, 1992) [3] . The prevalence of genera like Brachionus and Keratella (Rotifera), known to be tolerant of organic enrichment, at the polluted sites (Shevge Darna, Darna Sangavi) supports their status as indicator species for eutrophic conditions (Sharma, 1991-92) [27] . Daphnia pulex and Cyclops varidis at almost all sites indicate a water quality capable of supporting these common crustaceans. The higher zooplankton abundance in the pre-monsoon period can be linked to increased primary productivity driven by elevated temperatures, a relationship also noted in studies of the Bheema River (Vasanthkumar & Vijaykumar, 2011) [31] . Maintaining optimal physicochemical conditions is fundamental for aquatic productivity and the health of ecosystems (Sinha & Srivastava, 1991) [28] , a principle clearly demonstrated by the stressed zooplankton communities in the polluted sites of the Darna River. A sharp decline in zooplankton density was recorded during the monsoon months (June-September). This is primarily due to the combined effects of dilution from increased water volume, hydraulic washout where currents flush organisms downstream, and reduced light penetration from high turbidity, which limits primary production and thus food availability (Bilous et al., 2015; Sajeeb, 2021) [6,21] . This seasonal crash in plankton populations is common in riverine ecosystems affected by monsoon dynamics. The spatial analysis revealed that the polluted sites (Shevge Darna, Darna Sangavi), despite having a presence of species, likely hosted stressed communities with lower overall abundance and a shift towards pollution-tolerant taxa. This is consistent with the findings of Tidme (2013) [29] in temple ponds around Nashik, where water quality directly dictated zooplankton density. The high BOD and low DO levels at these sites create a physiologically stressful environment, inhibiting the survival of sensitive species and reducing overall biodiversity, a classic sign of organic pollution (Borics & Abonyi, 2021) [7] . The results demonstrate a clear cause-and-effect relationship between human activity, water quality, and biological response. The intense anthropogenic pressure at Shevge Darna and Darna Sangavi manifests as severe organic pollution (high BOD), which depletes dissolved oxygen and elevates TDS. This degraded habitat, in turn, structures the zooplankton community, selecting for tolerant species and reducing overall ecosystem health and biodiversity. The seasonal monsoon provides a temporary respite through dilution, but the persistent nature of the pollution sources ensures that water quality degrades again post-monsoon. This study confirms that zooplankton communities are effective bioindicators, as their composition directly reflected the trophic status and pollution levels of the river, a conclusion supported by work on other Indian water bodies (Dhembare, 2011; Patil et al., 2008) [11,24] . The findings underscore the urgent need for targeted mitigation strategies, particularly at the identified pollution hotspots, to restore the ecological balance of the Darna River.
| Species | Sampling Stations | — | — | — |
|---|---|---|---|---|
| Darna Dam | Shennit | Shevge Darna | Darna Sangavi | |
| Rotifers | ||||
| Asplanchna sp. | - | - | + | - |
| Brachionus caudatus | - | - | - | + |
| Brachionus foficula | - | + | + | - |
| Brachionus ureceolaris | + | + | - | - |
| Brachionus angularis | + | - | + | + |
| Brachionus diversicornis | - | - | + | + |
| Brachionus quadridentatus | + | + | - | - |
| Brachionus calyciflorus | + | - | - | + |
| Keratella procura | - | + | - | + |
| Keratella americana | - | - | + | - |
| Keratella cochlearis | - | - | - | + |
| Keratella tropica | - | + | - | + |
| Platyias quadricornis | + | + | + | - |
| Lecane luna | - | - | - | + |
| Lecane depressa | + | - | - | + |
| Lepadella ovalis | - | - | - | + |
| Filinia longiseta | - | - | + | + |
| Rotaria rotatoria | + | + | + | + |
| Rotaria neptunia | - | + | + | + |
| Monostyella sp. | - | - | - | + |
| Notomata sp. | - | + | - | + |
| Cladocera | ||||
| Cypris flurcularia | - | - | + | + |
| Daphnia longispina | + | - | + | + |
| Ceriodaphnia cornuta | - | + | - | + |
| Daphnia pulex | + | + | + | + |
| Daphnia rosea | + | + | - | - |
| Dapnia laevis | - | + | + | + |
| Leydigia sp | - | - | + | + |
| Macrothrix sp | - | + | + | + |
| Bosmina longirostris | + | - | - | + |
| Trophocyclops | + | + | + | + |
| Copepods | ||||
| Mesocyclops sp | + | + | - | + |
| Megacyclops sp. | + | + | + | + |
| Encyclops speratus | - | + | + | - |
| Cyclops varidis | + | + | + | + |
| Heliodiaptomus sp | + | - | + | + |
| Diaptamus sp | + | + | + | + |
| Calanus finmarchicus | + | + | + | + |
| Limnocalanus | - | + | + | + |
| Acartia tonsa | - | + | + | + |
| Ostracods | ||||
| Cypris sp | + | + | + | + |
| Stenocypris sp | - | - | + | + |
| Candona centrocypris | + | - | - | + |
| Cypridopsis vidua | + | - | + | + |
| Cyclocypris ovum | + | + | - | - |
Table text extracted from the original PDF; superscript letters are shown inline. The original table image is below.
View original table image
Multivariate Statistical Analysis of Physicochemical
Parameters: To statistically validate the observed spatiotemporal patterns in water quality, a Principal Component Analysis (PCA) and Multivariate Analysis of Variance (MANOVA) were performed on the physicochemical data. MANOVA results provided strong statistical evidence for significant differences in water quality parameters across stations and over time. The effect of the sampling station was highly significant (Pillai's trace = 1.416, F = 12.12, p< 0.000001), underscoring the pronounced spatial heterogeneity driven by varying degrees of anthropogenic impact. The month of sampling also had a significant, though weaker, effect (Pillai's trace = 1.172, F = 4.25, p = 0.0009), confirming the seasonal variation observed in parameters like temperature and turbidity. The PCA effectively reduced the dimensionality of the dataset, with the first two principal components (PC1 and PC2) accounting for 96.1% of the total variance (PC1: 76.3%, PC2: 19.7%). This indicates that these two components can explain almost all variability in the water quality parameters. The PCA biplot (Figure 2) clearly differentiated the sampling stations. Darna Dam and Shennit clustered on the negative side of PC1, strongly associated with higher dissolved oxygen (DO) levels and balanced pH, confirming their status as sites with better water quality. In contrast, Darna Sangavi was positioned on the positive side of PC1, strongly correlated with elevated total dissolved solids (TDS) and temperature, highlighting the stress from anthropogenic pollution. Shevge Darna was separated along PC2, which was driven by high biochemical oxygen demand (BOD) and turbidity, indicative of organic pollution.
Conclusion
This study demonstrates a clear inverse relationship between anthropogenic pollution and the ecological integrity of the Darna River. The physicochemical and biological data conclusively identify Shevge Darna and Darna Sangavi as critically degraded zones. The zooplankton community structure proved to be a sensitive biomarker, with diversity and abundance sharply declining in response to poor water quality conditions characterized by high BOD and low DO. These findings highlight the urgent need to implement watershed management strategies, including stricter regulation of industrial discharge and public awareness campaigns regarding ritualistic waste, to mitigate further ecological degradation and protect the river's biodiversity.
Figures and tables from the paper
| — | DF | Pillai | Approx F | No den | DF | p-value |
|---|---|---|---|---|---|---|
| Station | 3 | 1.4161 | 12.1249 | 6 | 30 | 30 6.857e-07 |
| Month | 5 | 1.1721 | 4.2475 | 10 | 30 | 0.0009851 |
| Residual | 15 |
Table text extracted from the original PDF; superscript letters are shown inline. The original table image is below.
View original table image
References
33 in the original paper- APHA. Standard methods for the examination of water and wastewater. 19th ed. Washington, D.C.: American Public Health Association, American Water Works Association, and Water Environment Federation; 1995.
- Banga M, Bilong B, Togouet Z, Hubert S. Spatiotemporal distribution of phytoplankton in the industrial area of Calabar River, Nigeria. Environ Sci. 2022.
- Battish SK. Freshwater zooplankton of India. New Delhi: Oxford & IBH Publishing Co.; 1992.
- Bawa KV, Gaikawad VB. Water quality assessment of Godavari River at Nashik, India: Impact of sewage and industrial wastewater. Univ J Environ Res Technol. 2013;3(4):450-457.
- Bhandarkar W, Bhandarkar S, Murkute V. Observation on species diversity of Brachionus (Rotifera) from Kalikar pond, Bramhapuri, district Chandrapur, Maharashtra. J Aqua Biol. 2008;23(2):4-7.
- Bilous O, Lilitskaya G, Kryvenda A. Seasonal variability of southern Bug river upstream phytoplankton. Int J Algae. 2015;17(1):37-49. https://doi.org/10.1615/InterJAlgae.v17.i1.40
- Borics G, Abonyi A. Freshwater phytoplankton diversity: Models, drivers and implications for ecosystem properties. Hydrobiologia. 2021;848(2):251275. https://doi.org/10.1007/s10750-020-04332-9
- Cairns J. Protecting the delivery of ecosystem services. Ecosystem Health. 1997;3(3):185-194. https://doi.org/10.1080/10549819709352358
- Charjan A, Malu R, Kulkarni KM. Studies on rotifer fauna in freshwater wetlands (Ambona Lake) in Yeotmal district of Maharashtra. J Aqua Biol. 2008;23(2):8-10.
- Dhawan A, Kaur S. Pig dung as pond manure: Effects on water quality, pond productivity and growth of carps in a polyculture system. Naga ICLARM Q. 2002;25(1):11-14.
- Dhembare AJ. Statistical approaches for computing diversity and density of zooplankton with water factor in Mula dam, Rahuri, M.S. Eur J Exp Biol. 2011;1(2):68-76.
- Garg RK, Rao RJ, Uchchariya D, Shukla G, Saksena DN. Seasonal variations in water quality and significant threats to Ramsagar reservoir, India. Afr J Environ Sci Technol. 2010;4(2):61-76.
- Ghose NC. Water: A treatise on the properties, processes, and use of water in the context of environment. New Delhi: A.P.H. Publishing Corporation; 2002.
- Jayabhaye UM, Pentewar MS, Hiware CJ. A study on physico-chemical parameters of a minor reservoir, Sawana, Hingoli district, Maharashtra. J Aqua Biol. 2008;23(2):56-60.
- Kadam MS, Pampatwar DV, Mali RP. Seasonal variations in different physico-chemical characteristics in Masoli reservoir of Parbhani district, Maharashtra. J Aqua Biol. 2007;22(1):110-112.
- Kakulate VR, Tidme SK. Fishes of the Darna region of Nashik district, Maharashtra, India. Int J Creat Res Thoughts. 2018;6(1):1621-1625.
- Kamble SM, Kamble AH, Narke SY. Study of physicochemical parameters of Ruti dam, Tq. Ashti, dist. Beed, Maharashtra. J Aqua Biol. 2009;24(2):8689.
- Kedar GT, Patil GP, Yeole SM. Rotifer biodiversity of Yedshi Lake, Maharashtra. J Aqua Biol. 2007;22(1):812.
- Kudesia VP. Water pollution. 5th ed. Meerut: Pragati Prakashan; 2003.
- Kudesia VP. Water pollution. 5th ed. Meerut: Pragati Prakashan; 2003.
- Sajeeb MI. Abundance and biodiversity of phytoplankton in the Halda River during monsoon and post monsoon period. Int J Adv Res Biol Sci. 2021;8(8):10-18. https://doi.org/10.22192/ijarbs
- Nalawade PM, Bagul AD. Physico-chemical conditions and plankton diversity of Godavari River in Nashik City area of Maharashtra: A comparative assessment. Int J Ecol Environ Sci. 2020;2(4):373-379.
- Pareek R, Singh G, Singh R. Some fresh water diatoms of Galta Kund, Jaipur, India. J Soil Sci Environ Manage. 2011;2(4):110-116.
- Patil GP, Kedar GT, Yeole SM. Zooplankton biodiversity study of two waterbodies in Washim district, Maharashtra. J Aqua Biol. 2008;23(1):13-17.
- Pejaver M, Gurav M. Seasonal variation of zooplankton in Nirmalya (religious refuges) enclosure of Kalwa Lake, Thane, Maharashtra. J Aqua Biol. 2008;23(1):2225.
- Sarwade AB, Kamble NA. Plankton diversity in the Krishna River, Sangli, Maharashtra. J Ecol Nat Environ. 2014;6(4):174-181.
- Sharma PD. Ecology and environment. 7th ed. Meerut: Rastogi Publications; 1991.
- Sinha VR, Srivastava HC. Aquaculture productivity. New Delhi: Oxford & IBH Publishing Co. Pvt. Ltd.; 1991.
- Tidme SK. Study on density and diversity of zooplankton in relation to water quality from temple ponds around Nasik) [doctoral dissertation]. Nashik: Savitribai Phule Pune University; 2013.
- Trivedi PR. Ecology and environment. New Delhi: APH Publishing Corporation; 2004.
- Vasanthkumar B, Vijaykumar K. Diurnal variation of physicochemical properties and primary productivity of phytoplankton in Bheema River. Recent Res Sci Technol. 2011;3(4):39-42.
- Vasumathi R, Prasad L, Swamy K, Reddy R. Physicochemical parameters of Pakhal Lake of Warangal district, Andhra Pradesh, India. J Aqua Biol. 2009;24(1):77-80.
- Belokda W, Elkalay K. First assessment of phytoplankton diversity in a Moroccan shallow reservoir (Sidi Abderrahmane). Saudi J Biol Sci. 2019;26(3):431-438. https://doi.org/10.1016/j.sjbs.2018.11.011