
Research article · 2026 · Full text
International Journal of Advanced Chemistry ResearchSupply chain dynamics and distribution network efficiency in fertilizer markets across eastern Kenya
Volume 8(5) · Pages 121–125 · DOI: 10.33545/26646781.2026.v8.i5b.720 ↗
Research areasAgriculture and Agroindustry StudiesLogistics and Infrastructure AnalysisAgricultural economics and policies
Abstract
Author-writtenThe fertilizer supply chain represents one of the most critical yet poorly understood components of agricultural market infrastructure in East Africa. This research examined the supply chain dynamics and distribution network efficiency of both chemical fertilizer and biofertilizer industries across five agricultural regions in eastern Kenya. A mixed-methods approach combining quantitative supply chain mapping with qualitative stakeholder assessments was employed, involving 312 market actors including manufacturers, distributors, wholesalers, retailers, and 186 end-user farmers surveyed between February and October 2023. The investigation revealed that chemical fertilizer distribution networks achieved 87.3% coverage in metropolitan areas but declined to 58.2% in peripheral coastal regions, while biofertilizer distribution coverage ranged from 42.1% in Nairobi to merely 14.3% along the coast. Supply chain efficiency metrics demonstrated that direct factory outlets achieved the highest overall efficiency scores (mean = 7.3/10) while online platforms scored lowest (mean = 4.8/10). Price variability analysis showed that fertilizer costs increased by 18-42% between factory gate and final retail point, with biofertilizers experiencing greater price escalation (38.7%) compared to chemical fertilizers (24.3%) due to cold chain requirements and shorter shelf life. Correlation analysis between distribution channel density and farmer adoption rates revealed strong positive associations for both fertilizer types (r = 0.78 for chemical, r = 0.84 for biofertilizer, p < 0.001). The findings demonstrate that supply chain infrastructure limitations represent the most significant structural barrier to biofertilizer market development in Kenya, necessitating targeted investments in cold chain logistics, decentralized production facilities, and digital marketplace integration.
Summary
Source-checkedPlain-language reading of the full paper, prepared with AI and checked against the text. Each point links to the authors' own words.
Why it matters
- The efficiency of supply chains for agricultural inputs is a primary factor in whether farmers in sub-Saharan Africa can access affordable, high-quality fertilizers. View evidence ↗
- In rural Kenyan markets, inefficiencies in distribution are estimated to add 25-45% to the final retail price of fertilizer. View evidence ↗
The question
- The study aimed to map the supply chain dynamics of chemical and biofertilizers in eastern Kenya, compare efficiency across different channels, and analyze how network density affects farmer adoption. View evidence ↗
What they did
- The study was conducted across five diverse agricultural regions in eastern Kenya, including the Nairobi Metropolitan area, Central Highlands, Western Kenya, the Rift Valley, and the Coast Region. View evidence ↗
- The researchers used a mixed-methods approach, surveying 312 supply chain actors (including manufacturers, distributors, wholesalers, retailers, and cooperative managers) and 186 end-user farmers. View evidence ↗
- Efficiency was measured using a composite index of six metrics, including delivery reliability, storage, transport cost, quality, accessibility, and price stability, each scored on a 10-point scale. View evidence ↗
What they found
- Chemical fertilizer coverage varied by region, reaching 87.3% in Nairobi but dropping to 58.2% in the Coast Region. View evidence ↗
- There is a trade-off between efficiency and reach: agro-dealer networks had lower efficiency but the widest coverage (72.8%), whereas the most efficient factory outlets reached only 12.4% of communities. View evidence ↗
- Fertilizer costs increased by 18-42% from factory to retail; biofertilizers saw a higher price escalation (38.7%) than chemical fertilizers (24.3%) due to shorter shelf life and cold chain needs. View evidence ↗
- A strong positive correlation exists between the density of the distribution network and farmer adoption rates for both chemical (r = 0.78) and biofertilizers (r = 0.84). View evidence ↗
- Less than 18% of surveyed retail outlets had the temperature-controlled facilities necessary for biofertilizer quality assurance. View evidence ↗
What it means
- The authors recommend prioritizing investments in supply chain infrastructure, specifically decentralized production, cold chain logistics, and agro-dealer capacity, over demand-side efforts like farmer training. View evidence ↗
- Integrating digital marketplaces and mobile logistics is suggested as a promising way to overcome current structural distribution barriers. View evidence ↗
Visual summary
2 visualsIllustrations explain the paper; charts are replotted from the paper's own table values.
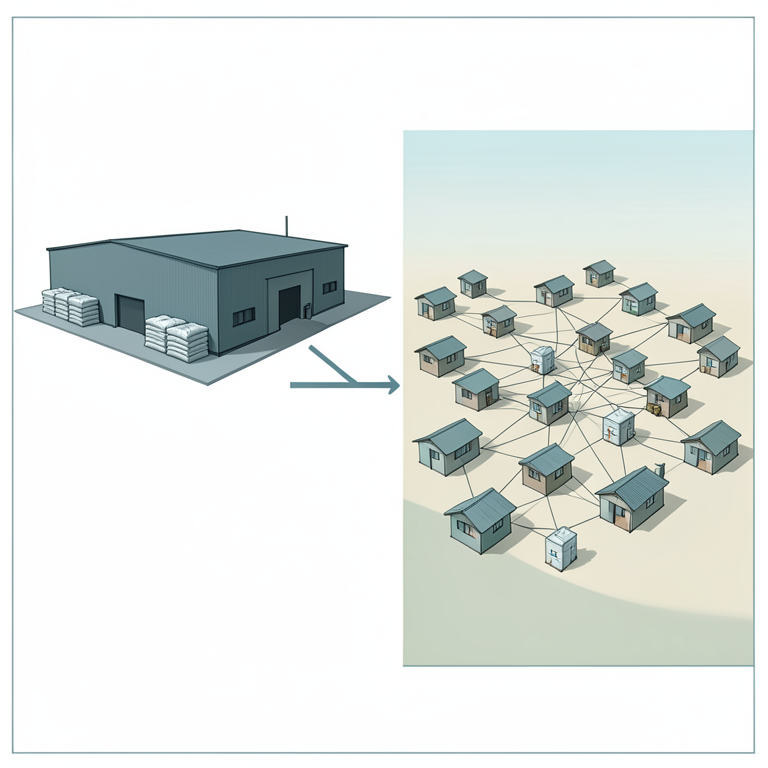
Efficiency vs. Coverage Trade-off
AI-generated conceptual illustration (Fertilizer bags and distribution hubs in eastern Kenya). It explains the idea and does not show study data.
View source evidence ↗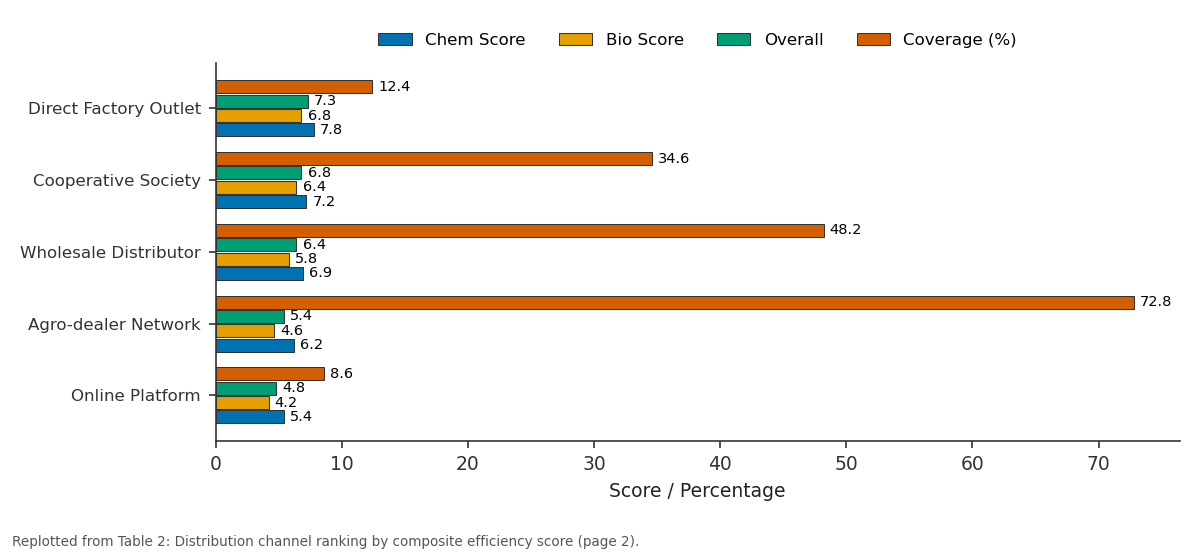
Chem Score and Bio Score and more: Direct Factory Outlet vs Cooperative Society vs Wholesale Distributor vs Agro-dealer Network vs Online Platform
Replotted from Table 2 (page 2) of the original paper. Every bar is the paper's own table value.
View source evidence ↗Figures & tables
From the original paper Table 1
 Table 2
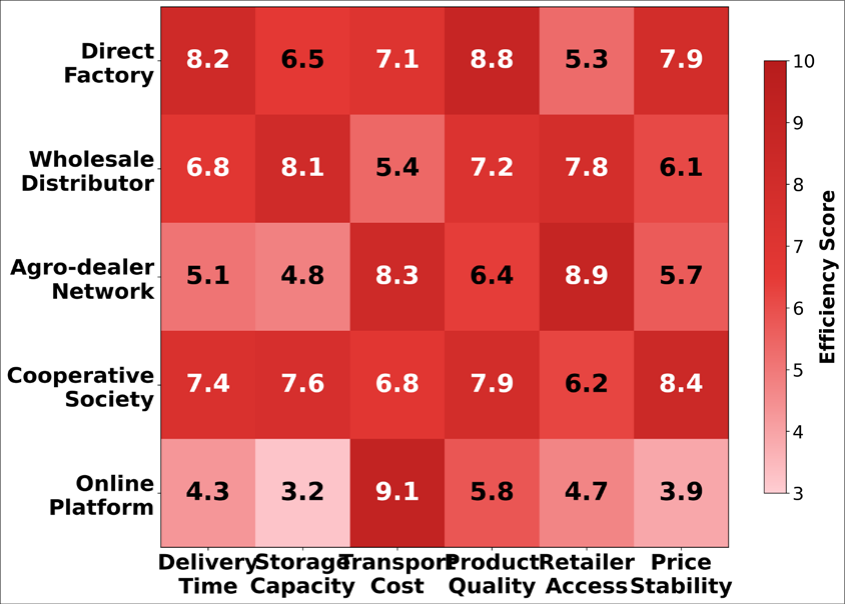 Figure 1
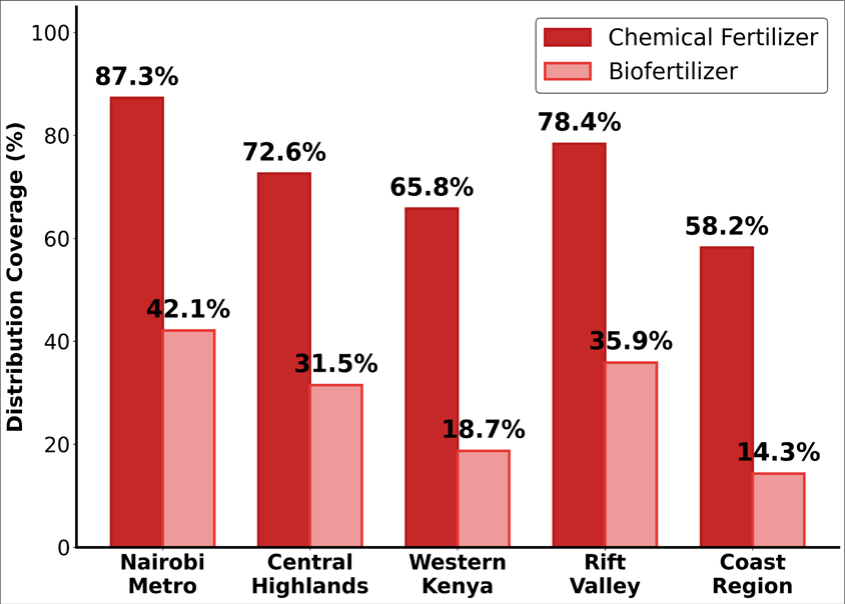 Figure 2
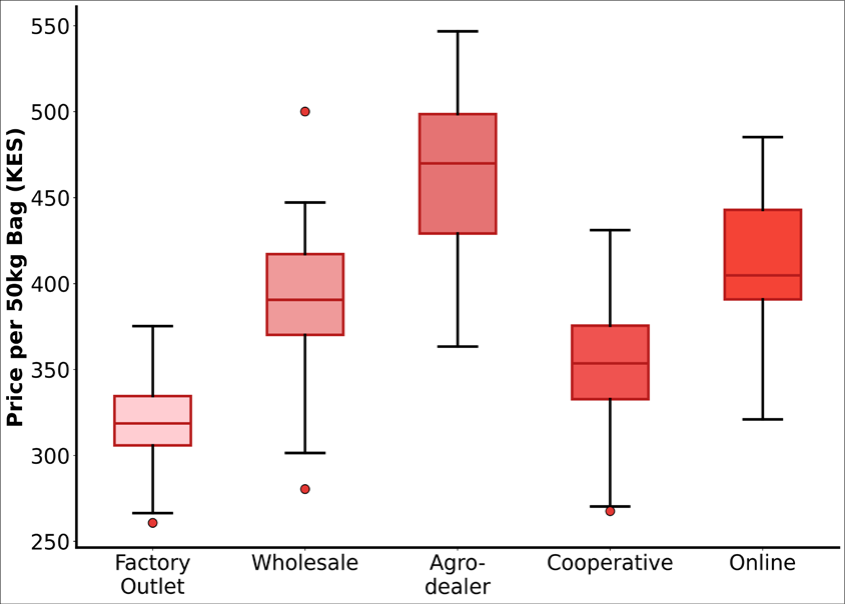 Figure 3
Introduction
The efficiency of agricultural input supply chains fundamentally determines the accessibility, affordability, and quality of fertilizer products reaching farming communities across sub-Saharan Africa [1] . The fertilizer distribution landscape in Kenya has undergone significant structural transformation over the past decade, driven by market liberalization policies, port infrastructure improvements, and the emergence of new product categories including biological fertilizer preparations [2] . Despite these developments, supply chain inefficiencies continue to impose substantial cost burdens on farmers, with estimates suggesting that distribution-related markups account for 25-45% of the final retail price of fertilizer products in rural Kenyan markets [3] . The Kenyan fertilizer market, valued at approximately 650 million USD annually, is dominated by imported chemical fertilizer products that traverse complex multi-tier distribution channels from the port of Mombasa to farming communities across the country's diverse agro-ecological zones [4] . The supply chain architecture typically involves four to six intermediary stages including port clearance, primary warehousing, secondary distribution, wholesale aggregation, and retail dispensation, each stage adding transaction costs and time delays that ultimately affect product affordability and availability for end-user farmers [3] . Biofertilizer products present distinct supply chain challenges compared to conventional chemical fertilizers, primarily owing to their biological nature and associated handling handling requirements [5] . The viability of microbial inoculants depends critically on maintaining adequate cell concentrations during storage and transport, necessitating temperature-controlled logistics and shorter distribution timelines that are poorly supported by existing fertilizer supply chain infrastructure [6] . These logistical constraints have been identified as significant barriers to biofertilizer market development across multiple African agricultural economies, yet systematic comparative analyses of supply chain efficiency between chemical and biological fertilizer products remain limited in the East African context [7] . This research therefore aimed to systematically map and evaluate the supply chain dynamics governing both chemical fertilizer and biofertilizer distribution in eastern Kenya, identify efficiency differentials across distribution channels, and assess the relationship between distribution network density and farmer adoption patterns. The investigation contributes to the growing body of evidence on agricultural input market structure in sub-Saharan Africa while providing actionable recommendations for supply chain optimization strategies.
Material and Methods
Material and Methods
Material
The research was conducted across five agricultural regions in eastern Kenya: Nairobi Metropolitan area, Central Highlands (Kiambu and Muranga counties), Western Kenya (Kakamega and Bungoma counties), the Rift Valley (Nakuru and Uasin Gishu counties), and the Coast Region (Kilifi and Kwale counties). These regions were selected to capture the full spectrum of market development stages, from highly urbanized commercial centers to remote rural farming communities. The investigation period spanned February to October 2023, and ethical approval was obtained from the Nairobi Research Center for Agronomics Ethics Committee (Protocol No. NRCA/EC/2023-012).
Methods
A mixed-methods research design was employed combining quantitative supply chain mapping with qualitative stakeholder assessments. The quantitative component involved structured surveys administered to 312 supply chain actors stratified by function: manufacturers and importers (n = 18), primary distributors (n = 34), wholesale dealers (n = 62), retail agro-dealers (n = 112), and cooperative society managers (n = 86). Additionally, 186 end-user farmers were surveyed regarding their purchasing patterns, channel preferences, and price perceptions. Supply chain efficiency was assessed using a composite index incorporating six performance metrics: delivery time reliability, storage capacity adequacy, transport cost efficiency, product quality maintenance, retailer network accessibility, and price stability. Each metric was scored on a 10-point scale through expert assessment panels comprising three supply chain specialists at each distribution node. Distribution network coverage was calculated as the percentage of farming communities within a 10-kilometer radius served by at least one active retail outlet stocking the respective fertilizer type. Statistical analysis employed Pearson correlation, one-way ANOVA with Tukey post-hoc tests, and spatial regression models using STATA version 16.0. The price variability analysis presented in Figure 3 demonstrated that agro-dealer networks exhibited the highest price variance (SD = 55 KES) while factory outlets showed the most consistent pricing (SD = 25 KES). The interquartile range analysis confirmed significant price differences across channels (Kruskal-Wallis H = 34.7, p < 0.001), with median prices increasing progressively from factory outlets (320 KES) through cooperatives (360 KES), wholesalers (385 KES), to agro-dealers (450 KES). Pearson correlation analysis revealed a strong positive association between distribution network density and farmer adoption rates for both chemical fertilizers (r = 0.78, p < 0.001) and biofertilizers (r = 0.84, p < 0.001).
Results
Results
Discussion
The documented supply chain efficiency disparities between chemical fertilizer and biofertilizer distribution systems reflect fundamental structural differences in product handling requirements and market maturity levels [3] . The finding that biofertilizer distribution coverage (14.3-42.1% across regions) substantially lagged behind chemical fertilizer coverage (58.2-87.3%) is consistent with supply chain development patterns observed in other East African agricultural input markets [8] . Comparative investigations in Tanzania and Uganda have reported similarly constrained biofertilizer distribution networks, with coverage rates ranging from 12% to 38% across agricultural zones [9] . The strong correlation between distribution density and adoption rates (r = 0.84 for biofertilizers) provides empirical support for the supply-side adoption hypothesis, which posits that product availability is a more powerful determinant of technology adoption than awareness or economic incentives in agricultural input markets characterized by infrastructure constraints [10] . This finding challenges the predominant demand-side focus of most biofertilizer promotion programmes, which emphasize farmer training and awareness campaigns while neglecting the fundamental distribution infrastructure prerequisites for market access [3] .
The cold chain requirements associated with biofertilizer products introduce unique logistical challenges that are inadequately addressed by existing fertilizer distribution infrastructure [11] . Temperature-controlled storage and transport facilities were available at fewer than 18% of retail outlets surveyed, creating significant quality assurance risks that undermine farmer confidence and product effectiveness. Investment in decentralized biofertilizer production facilities located closer to end-user markets could simultaneously reduce cold chain dependency, lower transportation costs, and improve product freshness at the point of purchase [12] . The coverage-efficiency trade-off observed between distribution channels presents a strategic dilemma for biofertilizer market development planners. While direct factory outlets and cooperative societies demonstrated superior efficiency metrics, their limited geographic reach constrains market development potential. The agro-dealer network, despite lower efficiency scores, represents the most promising distribution backbone for biofertilizer market expansion, provided that targeted investments in storage infrastructure, product handling training, and quality monitoring systems are implemented [13] .
Technological innovation opportunities
Digital marketplace platforms represent an emerging channel with significant potential for biofertilizer distribution optimization. Despite current low efficiency scores (4.8/10), online platforms eliminate multiple intermediary stages and can incorporate product traceability features that address quality assurance concerns. The integration of mobile payment systems, GPS-enabled delivery tracking, and real-time inventory management could substantially improve the viability of direct-to-farmer biofertilizer distribution models.
Conclusion
Within the context of agricultural input market development in East Africa, this research has highlighted the critical structural barriers constraining biofertilizer supply chain performance relative to established chemical fertilizer distribution systems. The key findings demonstrate that distribution coverage disparities, price escalation through multi-tier channels, and cold chain infrastructure deficiencies collectively constitute the most significant impediments to biofertilizer market growth. The recommendation emerging from this analysis is that biofertilizer market development strategies should prioritize supply chain infrastructure investment over demand-side interventions, with particular emphasis on decentralized production facilities, cold chain logistics enhancement, and agro-dealer network capacity building. Looking forward, the integration of digital marketplace technologies and mobile logistics platforms offers promising pathways for overcoming the structural distribution challenges identified in this investigation.
Acknowledgement
AcknowledgementsThis research was supported by funding from the Kenya Agricultural Research and Livestock Organization Research Grant (Grant No. KARLO/RG/2023-034). The authors acknowledge the institutional support provided by the Nairobi Research Center for Agronomics and the cooperation of county agricultural offices across the investigation area. The contributions of field research coordinators and enumerators across five agricultural regions are gratefully acknowledged.
Figures and tables from the paper
| Metric | Delivery | Storage | Transport | Quality | Access | Price |
|---|---|---|---|---|---|---|
| Delivery Time | 1.000 | 0.542 | 0.623 | 0.718 | 0.481 | 0.387 |
| Storage Capacity | 0.542 | 1.000 | 0.394 | 0.812 | 0.356 | 0.428 |
| Transport Cost | 0.623 | 0.394 | 1.000 | 0.467 | 0.589 | 0.734 |
| Product Quality | 0.718 | 0.812 | 0.467 | 1.000 | 0.512 | 0.394 |
| Retailer Access | 0.481 | 0.356 | 0.589 | 0.512 | 1.000 | 0.648 |
| Price Stability | 0.387 | 0.428 | 0.734 | 0.394 | 0.648 | 1.000 |
Table text extracted from the original PDF; superscript letters are shown inline. The original table image is below.
View original table image
| Rank | Channel | Chem Score | Bio Score | Overall | Coverage (%) |
|---|---|---|---|---|---|
| 1 | Direct Factory Outlet | 7.8 | 6.8 | 7.3 | 12.4 |
| 2 | Cooperative Society | 7.2 | 6.4 | 6.8 | 34.6 |
| 3 | Wholesale Distributor | 6.9 | 5.8 | 6.4 | 48.2 |
| 4 | Agro-dealer Network | 6.2 | 4.6 | 5.4 | 72.8 |
| 5 | Online Platform | 5.4 | 4.2 | 4.8 | 8.6 |
Table text extracted from the original PDF; superscript letters are shown inline. The original table image is below.
View original table image
References
15 in the original paper- Minten B, Koru B, Stifel D. The last mile(s) in modern input distribution: pricing, profitability, and adoption. Agric Econ. 2013;44(6):629-646.
- Ariga J, Jayne TS, Njukia S. Staple food prices in Kenya. COMESA-MSU-IFPRI African Agricultural Markets Project Policy Symposium. 2010:1-18.
- Dutta S, Hazra A, Paul I, Mitra N. Exploring the current consumer market status of chemical fertilizer vs. biofertilizer industries in West Bengal, India: an on-site investigation. South Asian J Agric Sci. 2024;4(1):147-153. DOI: 10.22271/27889289.2024.v4.i1b.124.
- AFAP. Status of fertilizer market in Kenya. Alliance for a Green Revolution in Africa Report. 2019:1-42.
- Bashan Y, de-Bashan LE, Prabhu SR, Hernandez JP. Advances in plant growth-promoting bacterial inoculant technology: formulations and practical perspectives. Plant Soil. 2014;378(1-2):1-33.
- Herrmann L, Lesueur D. Challenges of formulation and quality of biofertilizers for successful inoculation. Appl Microbiol Biotechnol. 2013;97(20):8859-8873.
- Owen D, Williams AP, Griffith GW, Withers PJA. Use of commercial bio-inoculants to increase agricultural production through improved phosphorus acquisition. Appl Soil Ecol. 2015; 86:4154.
- Kihara J, Bolo P, Kinyua M, Rurinda J, Piikki K. Micronutrient deficiencies in African soils and the human nutritional nexus. Environ Int. 2020; 144:106060.
- Jefwa JM, Pypers P, Waweru B, Muriuki J. Improving biological nitrogen fixation in smallholder farming systems. Soil Biol Biochem. 2012; 47:73-81.
- Foster AD, Rosenzweig MR. Learning by doing and learning from others: human capital and technical change in agriculture. J Polit Econ. 1995;103(6):1176-1209.
- Stephens JHG, Rask HM. Inoculant production and formulation. Field Crops Res. 2000;65(2-3):249-258.
- Malusá E, Sas-Paszt L, Ciesielska J. Technologies for beneficial microorganisms inocula used as biofertilizers. Sci World J. 2012; 2012:491206.
- Jayne TS, Mason NM, Burke WJ, Ariga J. Taking stock of Africa's second-generation agricultural input subsidy programs. Food Policy. 2018; 75:1-14.
- Sheahan M, Barrett CB. Ten striking facts about agricultural input use in sub-Saharan Africa. Food Policy. 2017; 67:12-25.
- Masso C, Ochieng JR, Vanlauwe B. Worldwide contrast in application of bio-fertilizers for sustainable agriculture: lessons for sub-Saharan Africa. J Biol Agric Healthc. 2015;5(2):34-50.