
Research article · 2026 · Full text
International Journal of Horticulture and Food ScienceTrait association analysis of growth and yield parameters in Guava (Psidium guajava L.) cv. Allahabad safeda under Nano-micronutrient application
Volume 8(7) · Pages 129–137 · DOI: 10.33545/26631067.2026.v8.i7b.816 ↗
Research areasAgricultural Practices and Plant GeneticsPlant Physiology and Cultivation StudiesGenetics and Plant Breeding
Abstract
Author-writtenCorrelation and path coefficient analyses were conducted on winter season guava crops (2022-23) to evaluate relationships between growth and yield parameters. The study examined 13 traits including fruit set percentage, fruit yield per plant, fruit weight, fruit volume, leaf area, chlorophyll content index, increase in leaf number, fruit retention percentage, plant spread (north-south and east-west directions), plant height, number of fruits retained per plant, and fruit drop percentage. Path analysis revealed that increase in plant height, increase in plant spread north-south, leaf area, chlorophyll content index, fruit set percentage per shoot, and average fruit volume exhibited high magnitude direct effects on fruit yield per plant. Fruit retention percentage demonstrated strong positive indirect effects. Principal component analysis identified two components explaining 92.8% of total variance, with PC1 accounting for 70.6%. The findings provide insights for indirect selection strategies in guava improvement programmes focusing on sustainable agricultural management.
Summary
Source-checkedPlain-language reading of the full paper, prepared with AI and checked against the text. Each point links to the authors' own words.
Why it matters
- Guava is a crop that responds well to nutrients, and its fruit quality depends heavily on the availability of both macro and micronutrients in the soil. View evidence ↗
- Many guava orchards suffer from micronutrient deficiencies because these nutrients are either not applied or are poorly absorbed by the plants. View evidence ↗
- Nanotechnology provides nutrients with smaller particle sizes, which can improve absorption and be more economical to use. View evidence ↗
The question
- The study aimed to evaluate how nano-micronutrients affect the growth and yield of guava plants. View evidence ↗
What they did
- The experiment used 4-5 year old Allahabad Safeda guava plants of uniform size and vigor at the Lovely Professional University Horticulture Farms in Punjab. View evidence ↗
- Ten treatments were tested in a randomized block design with three replicates, using nano-copper at 20 and 30 ppm and nano-zinc at 40 and 60 ppm. View evidence ↗
- Nano-nutrients were applied in two doses: the first 15 days before flowering in June, and the second after fruit set in July. View evidence ↗
What they found
- Based on mean performance, treatment T8 was the most effective, followed by T10, T3, and T6 & T9. View evidence ↗
- Fruit volume (1.82), leaf area (2.43), chlorophyll content index (2.48), and plant spread in E-W (2.72) and N-S (3.63) directions showed the lowest variability (C.V.). View evidence ↗
- The most significant differences between treatments (highest C.D. 5%) were found in fruit weight (18.40), fruit set percent (18.15), fruit retention percent (4.74), number of fruit retention per plant (4.74), and fruit yield per plant (4.58). View evidence ↗
- Plant spread in the N-S direction had highly significant positive correlations with yield per hectare (r=0.96), yield per plant (r=0.96), fruit weight (r=0.89), fruit volume (r=0.84), chlorophyll content (r=0.84), leaf number (r=0.81), and leaf area (r=0.75). View evidence ↗
- Fruit volume, fruit set percent per shoot, chlorophyll content index, leaf area, plant spread (N-S), and plant height all had significant positive direct effects on the average yield per plant. View evidence ↗
What it means
- The authors concluded that leaf area, fruit volume, chlorophyll content index, N-S plant spread, fruit set percent per shoot, and plant height are highly positively correlated with average yield per plant. View evidence ↗
Visual summary
1 visualsIllustrations explain the paper; they do not show study data.
Direct Effects on Guava Yield
AI-generated conceptual illustration (Guava plants (Psidium guajava L. cv. Allahabad safeda)). It explains the idea and does not show study data.
View source evidence ↗Figures & tables
From the original paper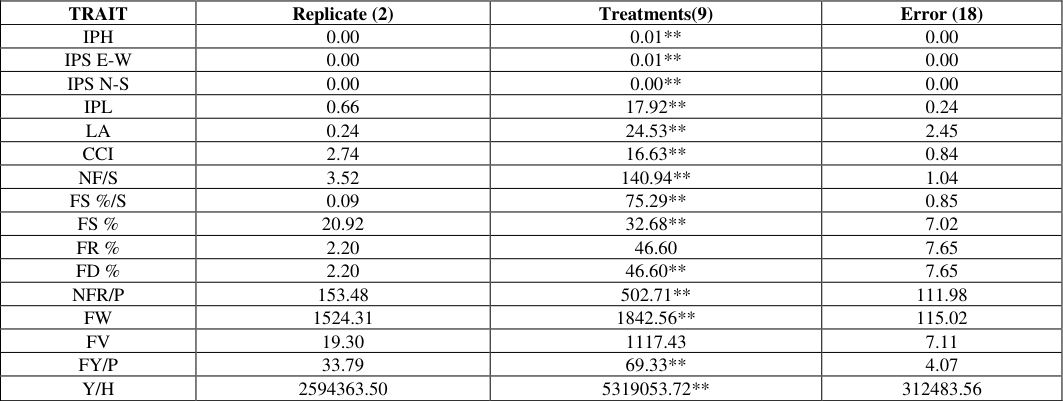 Table 1
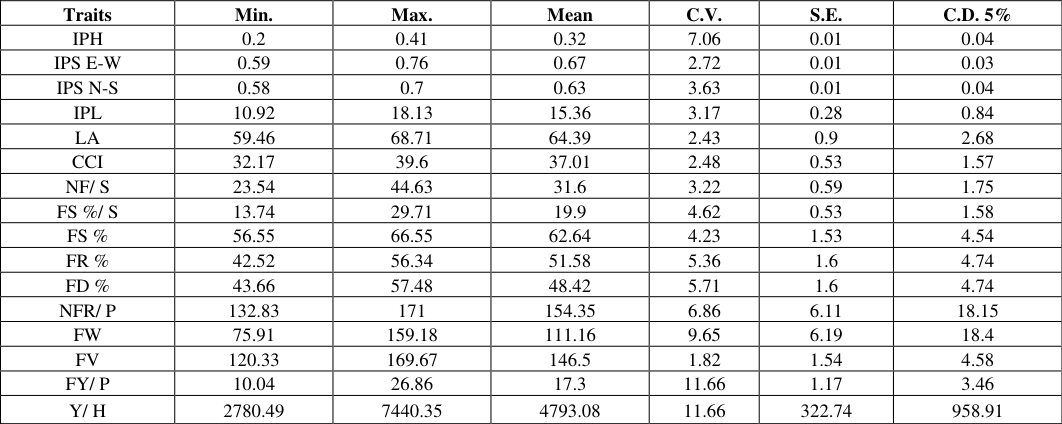 Table 2
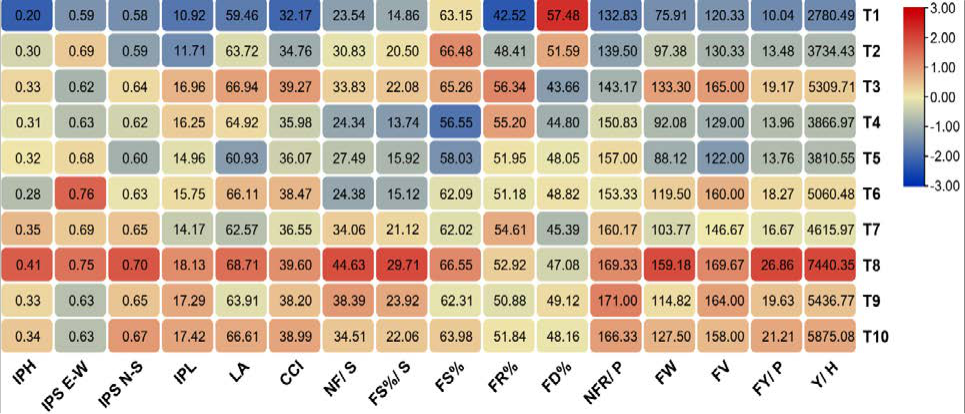 Figure 2
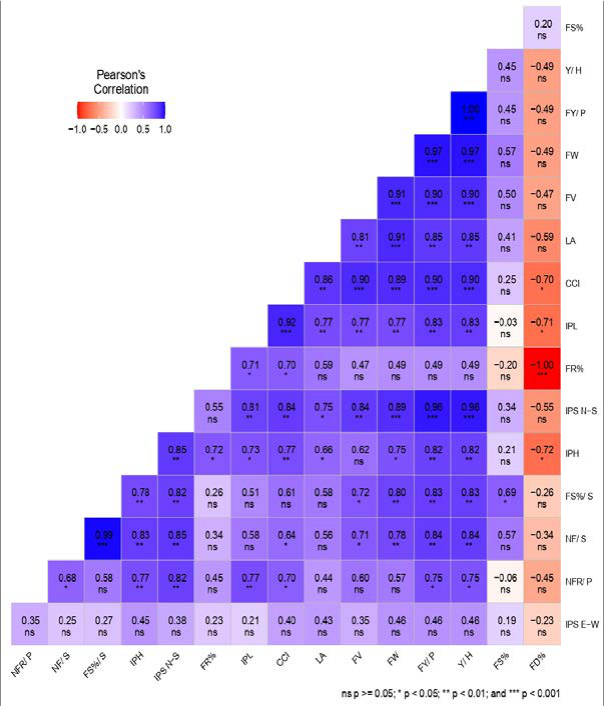 Figure 2
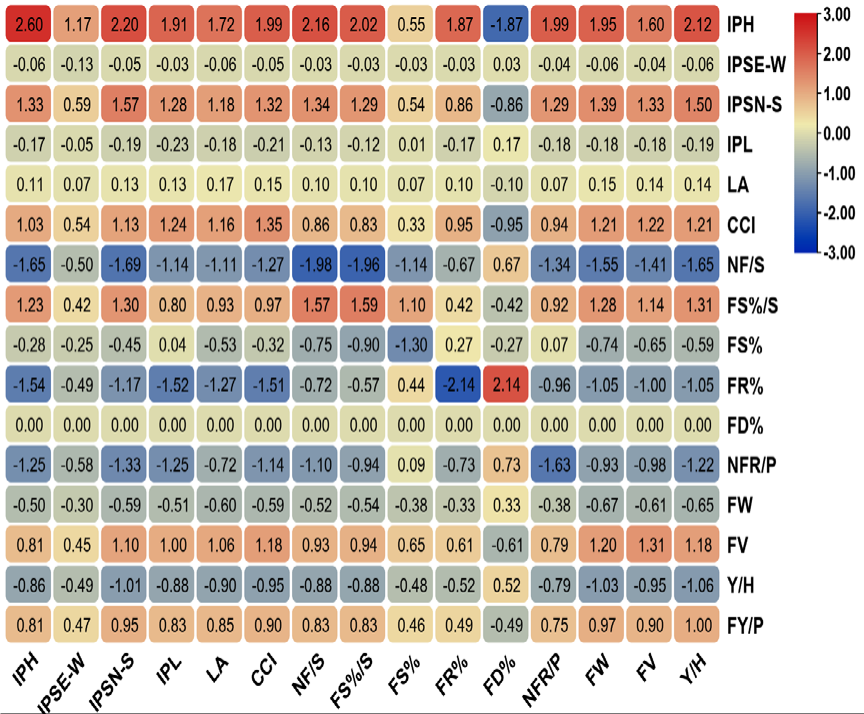 Figure 1
Introduction
Guava is a native of Central and South America. Spread of guava in the tropical and subtropical areas was aided by humans and other living organisms (Hussain et al., 2021) [8] . The fruit is high in calories, carbohydrates, fiber, calcium, minerals, vitamin C, lycopene, and polyphenols. It is known as the poor man's apple because it is most affordable to all social classes. Despite being mostly consumed in its fresh form, guava fruit is also used to make various goods such as jam, jelly, ice cream, cheese, canned fruit, and sharbat. Fruits are a crucial component of a healthy diet, and consuming them can help prevent serious illnesses. Lack of fruit and vegetable consumption, especially in developing nations, is regrettably one of the ten risk factors for mortality. 3.4 million Fewer deaths are attributed to a lower fruit consumption rate, per the Global Burden of Disease reports (GBD 2013). Guava is a nutrient-responsive crop and performs well under adequate nutrient application. Fruit quality in guava is greatly affected by the availability of macro and micronutrients in the soil. However, focus is mainly paid to applying large quantities of chemical fertilizers (containing macronutrients) for commercial production of the crop which in turn degrades the soil fertility as well as soil structure. Most guava orchards exhibit micronutrient deficiencies due to non-application of micronutrients or less absorption. In this context, any nutrient which has more absorption capacity can be effectively used for obtaining profitable results from the crops. Nanotechnology deals with this issue and offers a range of nutrients having smaller particle size which aids in absorption and offers economy of use (Adisa et al., 2019; Fatima et al., 2021; Pirzadah et al., 2020) [1,6,15] . Nano formulations are more reactive and can penetrate the soil and plant more deeply due to their higher surface area-to-volume ratio (Manjunatha et al., 2016) [13] . Additionally, nano-fertilizers are needed in small amounts because of their gradual and sustained material release, which increases plant productivity and encourages efficient nutrient use, both of which have a positive impact on the environment (Iqbal et al., 2019; Zulfiqar et al., 2019) [10,20] . The present study was conducted To evaluate the effect of Nano micronutrients on the growth and yield of guava. The complicated dependent character yield per plant is influenced by numerous other factors. Since evaluating fruit output directly is frequently ineffective, Sau et al., (2016) [14] suggest that indirect selection of several related attributes may be beneficial. In order to choose the desirable types for crop development programs, phenotypic correlations of yield with growth parameters and path analysis are helpful (Ahmed and Kamaluddin, 2013) [2] .It has been heavily highlighted how crucial plant nutrition is for improving quality and output. Every important component is crucial to the growth and development of a plant (Sau et al., 2016) [14] .
Material and methodology
The experimentwas conducted on 4-5 years old Guava plants (var. Allahabad Safeda) having uniform shape, size, and vigor, at Horticulture Farms, Department of Horticulture, Lovely Professional University, Punjab. NPK and Farm yard manure were applied to the respective treatments as per the recommendation in the Package of Practice (PAU) for the guava plants along with 1% foliar application of zinc sulphate. Foliar application of different levels of nano zinc and nano copper were used in the current study and the results were compared to the recommended foliar application of micronutrients. Different levels of nano copper (20 ppm and 30 ppm) and nano zinc (40 ppm and 60 ppm) were used. A total of 10 treatments replicated thrice were evaluated in a randomized block design: T1: control, T2: nano-Z1, T3: nano-Z2, T4: nano-Cu1, T5: nano-Cu2, T6: nano-Zn1+ nano-Cu1, T7: nano-Z1+ nano-Cu2, T8: nano-Z2 + nano-Cu1, T9: nano-Z2 + nano-Cu2, T10: ZnSO4 (PAU recommendation). The first dose of nano-nutrients was applied 15 days before flowering (third week of June) and the second dose was applied after the fruit set (third week of July). And the data on the growth parameters were recorded as the initial values (i.e., before the application of the treatments), and the final values were recorded after harvesting the fruit, the difference between the initial and final values is taken as the change and used for the data analysis. Yield parameters were recorded every 15 days intervals from starting of the flowering to the harvesting of fruits. The parameters average yield per plant, increase in plant height, increase in plant spread E-W, increase in plant spread N-S, increase in a number of plant leaves, leaf area, chlorophyll content index, the average number of fruits per plant, fruit set per shoot, fruit set percent, fruit retention percent, fruit drop percent, number of fruit retention per plant, average fruit weight, average fruit volume, and yield per hector.) were used to recorded to evaluate the treatments, and the average replicated value for each quantitative trait was subjected to statistical analysis to look for phenotypic and treatment correlations between yield and its constituent parts as well as among those parts. Using Illowsky's (2018) [9] method, the correlation coefficient was calculated. While the estimated value of correlation was tested for its significance by using t-statistics at n-2 error degree of freedom. The correlation coefficient was evaluated at the treatment and phenotypic levels to estimate the effect of various traits on yield per plant. Further, these correlations were used to estimate the path co-efficient by methods as described by Hollar (2018), and the path coefficient value was used to categorize the effect of various traits on yield and to illustrate a relationship between correlation and path coefficient (Oladosuetal., 2018) [14] .The estimation of residual factors was done to determine the percentage contribution of character studied towards the variation in average yield per plant and to find the residual value which might be contributed by other parameters not taken during the study. Also explained with the heat map (Figure 1).
Results and discussions 3.1 Analysis of variance
The analysis of variance showed that highly significant variation was scrutinized for the fifteen characters (Table 1). The degree of variability for fifteen attributes in fourteen genotypes of garden peas, characterized by the statistically significant mean, the Genotypic Coefficient of Variation (GCV), the Phenotypic Coefficient of Variation (PCV), heritability (h2) and Genetic Advance (GA). Variability parameters such as phenotypic and genotypic coefficients of variation, heritability and genetic advance, level of association between the various traits, and direct manipulation of yield associated traits on total yield greatly aids in the formulation of an effective breeding strategy aimed at utilizing the inherent variability of the subsequent population (Burton and De Vane, 1953). Phenotypic variability is affected by the environment, but genetic variability is unaffected and more valuable to a plant breeder for selection or hybridization (Chakraborty and Chakraborty, 2010). These traits have higher C.D. 5% values, indicating that there are significant differences between treatments for these traits at a 5% confidence level. The estimates of the phenotypic correlation coefficient for various characters showed a similar trend of correlation was reported for most of the traits as reported by Ullah et al., (2021). The correlation coefficient (Table1) The correlation values for phenotypic, contributions and reported a strong to moderate correlation between the various traits studied by Barth et al., (2022) [3] .They also observed the positive and moderate correlation ofthe mass of commercial fruits with the number of commercial fruits of guava at phenotypic levels. The path coefficient study revealed that an increase in plant height, fruit set percent per shoot, fruit volume, chlorophyll content index, and an increase in plant spread N-S direction had a high, direct, and positive influence over fruit yield per plant. All of the experimental findings in the present study can be further supported by the finding of Diel et al. (2020) [5] for different treatments. [16] that is also conducted on guava. Additionally, the remaining trait fruit drop percent (FD %) exhibited negative non-significant correlations with Increase in Plant Spread in East to West direction (IPS E-W). These per hectare (Y/H), fruit harvested yield per plant (FY/P), average fruit weight (FW), average fruit volume (FV), average chlorophyll content index (CCI), increase in plant spread north to south direction (IPS N-S), increase in plant height (IPH), and fruit set percent per shoot (FS %/S) are associated with increased values of number of fruits per shoot (NF/S). On the other hand, fruit set percent (FS %) (r=0.57), average leaf area (LA) (r=0.56), increase in leaf number (IPL) (r=0.58), and fruit retention percent (FR %) (r=0.34) showed either weak positive or no significant correlation with number of fruits per shoot (NF/S). While the trait fruit drop percent (FD %) (r=-0.34) shows negative non-significant correlations with number of fruits per shoot (NF/S), implying that higher fruit drop percent (FD %) values may not necessarily be indicative of higher number of fruits per shoot (NF/S). Several traits were found to have significant positive correlations with fruit set percent per shoot (FS %/S), indicating a relationship between these traits and fruit set percent per shoot (FS %/S). The trait average fruit weight (FW) revealed positive significant correlations between the traits harvested yield per hectare (Y/H) (r=0.97***), and fruit harvested yield per plant (FY/P) (r=0.97***). These findings suggest that higher values of harvested yield per hectare (Y/H) and fruit harvested yield per plant (FY/P) are associated with increased values of average fruit weight (FW). However, trait fruit set percent (FS %), was found to have a weak or non-significant correlation with average fruit weight (FW), indicating that within the examined data, there was fruit drop percent (FD %) shows a negative non-significant correlation with the average fruit weight (FW). The trait fruit harvested yield per plant (FY/P) revealed significant positive correlations with trait harvested yield per hectare (Y/H). These findings suggest that higher values of harvested yield per hectare (Y/H) were associated with increased values of fruit harvested yield per plant (FY/P). However, trait fruit set percent (FS %) was found to have a weak or non-significant correlation with fruit harvested yield per plant (FY/P), indicating that within the examined data, there was fruit drop percent (FD %) shows a negative non-significant correlation with the fruit harvested yield per plant (FY/P).
| TRAIT | Replicate (2) | Treatments(9) | Error (18) |
|---|---|---|---|
| IPH | 0.00 | 0.01** | 0.00 |
| IPS E-W | 0.00 | 0.01** | 0.00 |
| IPS N-S | 0.00 | 0.00** | 0.00 |
| IPL | 0.66 | 17.92** | 0.24 |
| LA | 0.24 | 24.53** | 2.45 |
| CCI | 2.74 | 16.63** | 0.84 |
| NF/S | 3.52 | 140.94** | 1.04 |
| FS %/S | 0.09 | 75.29** | 0.85 |
| FS % | 20.92 | 32.68** | 7.02 |
| FR % | 2.20 | 46.60 | 7.65 |
| FD % | 2.20 | 46.60** | 7.65 |
| NFR/P | 153.48 | 502.71** | 111.98 |
| FW | 1524.31 | 1842.56** | 115.02 |
| FV | 19.30 | 1117.43 | 7.11 |
| FY/P | 33.79 | 69.33** | 4.07 |
| Y/H | 2594363.50 | 5319053.72** | 312483.56 |
Table text extracted from the original PDF; superscript letters are shown inline. The original table image is below.
View original table image
Correlation analysis
The analysis revealed a positive non-significant correlation between harvested yield per hectare (Y/H) and fruit set percent (FS %) (r=0.45). Additionally, the remaining trait fruit drop percent (FD %) (r=-0.49) exhibited a negative non-significant correlation with harvested yield per hectare (Y/H). These findings highlight the complex relationships between harvested yield per hectare (Y/H) and different traits, emphasizing the importance of further investigation to comprehensively understand the underlying factors influencing harvested yield per hectare (Y/H). The trait fruit set percent (FS %) exhibited a positive nonsignificant correlation with the trait fruit drop percent (FD %) (r=0.20). This indicates that values of fruit drop percent (FD %) are not associated with increased values of fruit set percent (FS %), However, no traits showed a significant negative correlation with fruit set percent (FS %).
Path coefficient analysis
The analysis revealed that certain traits had a positive direct effect on average yield per plant (AYP). Notably, average fruit volume (FV), fruit set percent per shoot (FS %/S), average chlorophyll content index (CCI), average leaf area (LA), increase in plant spread north to south direction (IPS N-S), and increase in plant height (IPH) showed significant positive direct effects on average yield per plant (AYP). On the other hand, several traits exhibited negative direct effects on average yield per plant (AYP), namely harvested yield per hectare (Y/H) (-1.05), average fruit weight (FW), number of fruit retention per plant (NFR/P), fruit retention percent (FR %), fruit set percent (FS %), number of fruits per shoot (NF/S), increase in leaf number (IPL) and increase in plant spread in east to west direction (IPS E-W). These findings highlight the importance of these traits in influencing average yield per plant (AYP) directly and provide valuable insights for further research and guava improvement endeavours (Table 2). The analysis revealed that several traits demonstrated a substantial positive indirect effect on average yield per plant (AYP). The trait harvested yield per hectare (Y/H) exhibited a positive indirect effect with fruit drop percent (FD %) indicating their significant contribution to average yield per plant (AYP) through indirect pathways. Average fruit volume (FV) showed a positive indirect effect with harvested yield per hectare (Y/H), average fruit weight (FW), number of fruit retention per plant (NFR/P), fruit retention percent (FR %), fruit set percent (FS %), fruit set percent per shoot (FS %/S), number of fruits per shoot (NF/S), average chlorophyll content index (CCI), average leaf area (LA), increase in leaf number (IPL), increase in plant spread north to south direction (IPS N-S), increase in plant spread in east to west direction (IPS E-W) and increase in plant height (IPH), implying their influence on average fruit volume`s (FV) relationship with average yield per plant (AYP). average fruit weight (FW) exhibited a positive indirect effect with fruit drop percent (FD %) (0.32), suggesting their mediating role in the impact of average fruit weight (FW) on average yield per plant (AYP). Similarly, number of fruit retention per plant (NFR/P) had a positive indirect effect with fruit drop percent (FD %), and fruit set percent (FS %), indicating its involvement in the relationship between number of fruit retention per plant (NFR/P) and average yield per plant (AYP). Furthermore, fruit retention percent (FR %) demonstrated positive indirect effects with fruit drop percent (FD %), and fruit set percent (FS %), highlighting their significant contributions to the indirect effect of fruit retention percent (FR %) on average yield per plant (AYP). fruit set percent (FS %) displayed a positive indirect effect with number of fruit retention per plant (NFR/P), fruit retention percent (FR %) and increase in leaf number (IPL) (0.03) suggesting the influence of number of fruit retention per plant (NFR/P), fruit retention percent (FR %) and increase in leaf number (IPL) on fruit set percent`s (FS %) relationship with average yield per plant (AYP). fruit set percent per shoot (FS %/S) exhibited positive indirect effects with harvested yield per hectare (Y/H), average fruit volume (FV), average fruit weight (FW) number of fruit retention per plant (NFR/P), fruit retention percent (FR %), fruit set percent (FS %) number of fruits per shoot (NF/S), average chlorophyll content index (CCI), average leaf area (LA), increase in leaf number (IPL), increase in plant spread north to south direction (IPS N-S), increase in plant spread in east to west direction (IPS E-W), and increase in plant height (IPH), indicating their potential contribution to the indirect effect of fruit set percent per shoot (FS %/S) on average yield per plant (AYP). number of fruits per shoot (NF/S) showed a positive indirect effect with fruit drop percent (FD %), suggesting their mediation of the relationship between number of fruits per shoot (NF/S) and average yield per plant (AYP). Average chlorophyll content index (CCI) exhibited a positive indirect effect with harvested yield per hectare (Y/H), average fruit volume (FV), average fruit weight (FW), number of fruit retention per plant (NFR/P), fruit retention percent (FR %), fruit set percent (FS %), fruit set percent per shoot (FS %/S), number of fruits per shoot (NF/S), average leaf area (LA), increase in leaf number (IPL), increase in plant spread north to south direction (IPS N-S), increase in plant spread in east to west direction (IPS E-W) and increase in plant height (IPH) suggesting their mediating role in the impact of average chlorophyll content index (CCI) on average yield per plant (AYP).average leaf area (LA) displayed a positive indirect effect with harvested yield per hectare (Y/H), average fruit volume (FV), average fruit weight (FW), number of fruit retention per plant (NFR/P), fruit retention percent (FR %), fruit set percent (FS %), fruit set percent per shoot (FS %/S), number of fruits per shoot (NF/S), average chlorophyll content index (CCI), increase in leaf number (IPL), increase in plant spread north to south direction (IPS N-S), increase in plant spread in east to west direction (IPS E-W), and increase in plant height (IPH) suggesting the influence of average leaf area (LA) relationship with average yield per plant (AYP).increase in leaf number (IPL) showed a positive indirect effect with fruit drop percent (FD %), implying their influence on increase in leaf number`s (IPL) relationship with average yield per plant (AYP).increase in plant spread north to south direction (IPS N-S) showed a positive indirect effect with harvested yield per hectare (Y/H), average fruit volume (FV), average fruit weight (FW), number of fruit retention per plant (NFR/P), fruit retention percent (FR %), fruit set percent (FS %), fruit set percent per shoot (FS %/S), number of fruits per shoot (NF/S), average chlorophyll content index (CCI), average leaf area (LA), increase in leaf number (IPL), increase in plant spread in east to west direction (IPS E-W) and increase in plant height (IPH), implying their influence on increase in plant spread north to south direction`s (IPS N-S) relationship with average yield per plant (AYP). Furthermore, increase in plant spread in east to west direction (IPS E-W) demonstrated positive indirect effects with fruit drop percent (FD %), highlighting their significant contributions to the indirect effect of increase in plant spread in east to west direction (IPS E-W) on average yield per plant (AYP). The trait increase in plant height (IPH) exhibited a positive indirect effect with harvested yield per hectare (Y/H), average fruit volume (FV), average fruit weight (FW), number of fruit retention per plant (NFR/P), fruit retention percent (FR %), fruit set percent (FS %), fruit set percent per shoot (FS %/S), number of fruits per shoot (NF/S), average chlorophyll content index (CCI), average leaf area (LA), increase in leaf number (IPL), increase in plant spread north to south direction (IPS N-S), and increase in plant spread in east to west direction (IPS E-W) indicating their significant contribution to average yield per plant (AYP) through indirect pathways. These findings underscore the importance of these traits in indirectly influencing the average yield per plant and provide valuable insights for further research and guava improvement efforts. The path coefficient estimation showing direct and indirect effects (Table 2) among all 16 traits studied confirms the positive direct effect over yield per plant was reported with average increase in plant height, average increase in plant spread N-S, average leaf area, chlorophyll content index, fruit set percent per shoot, fruit drop percent (0., average fruit volume (1.13), while negative direct effect was reported with average increase in plant spread E-W (-0.13), increase in number of plant leaves (-0.23), number of fruit per shoot (-1.98), fruit set percent (-1.30), fruit retention percent(-2.14), average number of fruit retention per plant (-1.63), average fruit weight (-0.64), average yield per hector (-1.05). Similar findings have been reported by Singh et al.
| Traits | Min. | Max. | Mean | C.V. | S.E. | C.D. 5% |
|---|---|---|---|---|---|---|
| IPH | 0.2 | 0.41 | 0.32 | 7.06 | 0.01 | 0.04 |
| IPS E-W | 0.59 | 0.76 | 0.67 | 2.72 | 0.01 | 0.03 |
| IPS N-S | 0.58 | 0.7 | 0.63 | 3.63 | 0.01 | 0.04 |
| IPL | 10.92 | 18.13 | 15.36 | 3.17 | 0.28 | 0.84 |
| LA | 59.46 | 68.71 | 64.39 | 2.43 | 0.9 | 2.68 |
| CCI | 32.17 | 39.6 | 37.01 | 2.48 | 0.53 | 1.57 |
| NF/ S | 23.54 | 44.63 | 31.6 | 3.22 | 0.59 | 1.75 |
| FS %/ S | 13.74 | 29.71 | 19.9 | 4.62 | 0.53 | 1.58 |
| FS % | 56.55 | 66.55 | 62.64 | 4.23 | 1.53 | 4.54 |
| FR % | 42.52 | 56.34 | 51.58 | 5.36 | 1.6 | 4.74 |
| FD % | 43.66 | 57.48 | 48.42 | 5.71 | 1.6 | 4.74 |
| NFR/ P | 132.83 | 171 | 154.35 | 6.86 | 6.11 | 18.15 |
| FW | 75.91 | 159.18 | 111.16 | 9.65 | 6.19 | 18.4 |
| FV | 120.33 | 169.67 | 146.5 | 1.82 | 1.54 | 4.58 |
| FY/ P | 10.04 | 26.86 | 17.3 | 11.66 | 1.17 | 3.46 |
| Y/ H | 2780.49 | 7440.35 | 4793.08 | 11.66 | 322.74 | 958.91 |
Table text extracted from the original PDF; superscript letters are shown inline. The original table image is below.
View original table image
(2018) [18] in strawberry and by Khan, et al. (2022) [11] in groundnut.
Conclusion
The correlation study for 16 quantitative characters of guava with an average yield per plant at phenotypic level reflected a high degree of positive correlation with leaf area, fruit volume, chlorophyll content index, increase plant spread N-S, fruit set percent per shoot, and increase in plant height and ranged from 0.169 to 2.599. The negative correlation of increase in plant spread E-W, increase in plant leaves number, fruit weight, yield per hector, number of fruit retention per plant, number of fruit per shoot, fruit set percent, and fruit was reported with plant growth-related attributes and ranged from -0.127 to-2.144.
Figures and tables from the paper
References
20 in the original paper- Adisa IO, Pullagurala VLR, Peralta-Videa JR, Dimkpa CO, Elmer WH, Gardea-Torresdey JL, White JC. Recent advances in nano-enabled fertilizers and pesticides: a critical review of mechanisms of action. Environ Sci Nano. 2019;6(7):2002-2030.
- Ahmed S, Kamaluddin. Correlation and path analysis for agro-morphological traits in rajmash beans under Baramulla Kashmir region. Afr J Agric Res. 2013;8(18):2027-2032.
- Barth E, de Resende JTV, Mariguele KH, de Resende MDV, da Silva ALBR, Ru S. Multivariate analysis methods improve the selection of strawberry genotypes with low cold requirement. Sci Rep. 2022;12(1):11458.
- Chauhan JK, Verma P. Effect of micronutrients on growth, yield and leaf nutrient status in guava (Psidium guajava L.) cultivar Allahabad Safeda. J Pharmacogn Phytochem. 2020;9(6):392-396.
- Diel MI, Lúcio AD, Lambrecht DM, Pinheiro MVM, Sari BG, Olivoto T, Luis A. Canonical correlations in agricultural research: method of interpretation used leads to greater reliability of results. Int J Exp Res Rev. 2020;8:171-181.
- Fatima F, Hashim A, Anees S. Efficacy of nanoparticles as nanofertilizer production: a review. Environ Sci Pollut Res. 2021;28:1292-1303.
- Hollar DW, Hollar DW. The method of path coefficients. In: Trajectory Analysis in Health Care. Cham: Springer; 2018. p. 49-72.
- Hussain SZ, Naseer B, Qadri T, Fatima T, Bhat TA. Guava (Psidium guajava): morphology, taxonomy, composition and health benefits. In: Fruits Grown in Highland Regions of the Himalayas: Nutritional and Health Benefits. Cham: Springer International Publishing; 2021. p. 257-267.
- Illowsky B. Testing the significance of the correlation coefficient. In: Introductory Statistics [Internet]. 2018 [cited 2026 Jul 22]. Available from: https://psu.pb.unizin.org/introductorystatyoungsu18/cha pter/testing-the-significance-of-the-correlationcoefficient/
- Iqbal MA. Nano-fertilizers for sustainable crop production under changing climate: a global perspective. Sustain Crop Prod. 2019;8:1-13.
- Khan MMH, Rafii MY, Ramlee SI, Jusoh M, Al Mamun M. Path-coefficient and correlation analysis in Bambara groundnut (Vigna subterranea [L.] Verdc.) accessions over environments. Sci Rep. 2022;12(1):245.
- Kumar V, Ram RB, Verma RS, Yadav A, Saroj NL. Effect of foliar application of micronutrients and plant growth regulators on yield and physical characteristics of guava (Psidium guajava L.) cv. Allahabad Safeda. J Pharmacogn Phytochem. 2019;8:2715-2716.
- Manjunatha SB, Biradar DP, Aladakatti YR. Nanotechnology and its applications in agriculture: a review. J Farm Sci. 2016;29:1-3.
- Oladosu Y, Rafii MY, Magaji U, Abdullah N, Miah G, Chukwu SC, Kareem I. Genotypic and phenotypic relationship among yield components in rice under tropical conditions. Biomed Res Int. 2018;2018:Article ID 8936767.
- Pirzadah B, Pirzadah TB, Jan A, Hakeem KR. Nanofertilizers: a way forward for green economy. In: Nanobiotechnology in Agriculture: An Approach Towards Sustainability. Cham: Springer; 2020. p. 99112.
- Sachin AK, Kumar V, Kumar Y, Kumar M. Response of foliar application of micronutrients to reproductive parameters of guava (Psidium guajava L.). Int J Curr Microbiol Appl Sci. 2019;8(10):486-491.
- Sau S, Ghosh B, Sarkar S. Correlation and path analysis studies for growth and yield contributing traits in guava as affected by micronutrients. Ann Plant Soil Res. 2016;18(4):370-374.
- Singh G, Kachwaya DS, Kumar R, Vikas G, Singh L. Genetic variability and association analysis in strawberry (Fragaria × ananassa Duch.). Electron J Plant Breed. 2018;9(1):169-182.
- Yadav RK, Ram RB, Kumar V, Meena ML, Singh HD. Impact of micronutrients on fruit set and fruit drop of winter season guava (Psidium guajava L.) cv. Allahabad Safeda. Indian J Sci Technol. 2014;7(9):1451-1453.
- Zulfiqar F, Navarro M, Ashraf M, Akram NA, MunnéBosch S. Nanofertilizer use for sustainable agriculture: advantages and limitations. Plant Sci. 2019;289:110270.