
Research article · 2026 · Full text
International Journal of Horticulture and Food ScienceTree species abundance and above-ground carbon pools in east African protected landscapes
Volume 8(4) · Pages 95–99 · DOI: 10.33545/26631067.2026.v8.i4b.812 ↗
Research areasForest ecology and managementRemote Sensing and LiDAR ApplicationsForest Management and Policy
Abstract
Author-writtenProtected landscapes in East Africa encompass diverse miombo woodland, riverine forest, and mixed savanna formations that collectively store substantial above-ground carbon, yet species-level abundance data linked to carbon pool estimates remain insufficient for informed conservation management. This research assessed tree species abundance and estimated above-ground carbon pools across three vegetation types within a protected landscape near Dar es Salaam, Tanzania. Fourteen plots of 25 m × 25 m were systematically distributed across miombo woodland, riverine forest, and mixed savanna between April and November 2023. All trees with diameter at breast height of 10 cm or greater were enumerated and measured. Above-ground biomass was calculated using allometric equations validated for East African dryland forests. A total of 785 trees representing 48 species and 21 families were documented. Fabaceae dominated with ten species, followed by Combretaceae with seven and Moraceae with four species. Shannon-Wiener diversity ranged from 2.35 in mixed savanna to 3.52 in riverine forest. Mean above-ground carbon stock was 72.5 Mg C per hectare across the protected landscape, with riverine forest exhibiting the highest density at 105.2 Mg C per hectare. Violin plot analysis of diameter distributions revealed distinct structural profiles across vegetation types. Growth form analysis showed that trees constituted 48% of all woody individuals, followed by shrubs at 28%. Bar chart comparison of carbon stocks demonstrated that miombo woodland and riverine forest collectively contributed 78% of total landscape carbon. These results confirm that protected landscapes in East Africa maintain functionally important carbon pools whose magnitude and distribution are closely tied to vegetation type and species composition.
Summary
Source-checkedPlain-language reading of the full paper, prepared with AI and checked against the text. Each point links to the authors' own words.
Why it matters
- East African protected landscapes contain diverse vegetation types that store significant above-ground carbon, but there is a lack of species-level data to guide conservation. View evidence ↗
- The miombo woodland biome is the largest tropical dry woodland on Earth, covering about 2.7 million square kilometres across eastern and southern Africa. View evidence ↗
- In Tanzania, miombo and related woodlands cover roughly 44% of the land, making them important for climate change mitigation efforts like REDD+. View evidence ↗
The question
- The study aimed to assess tree species abundance and above-ground carbon pools across three vegetation types near Dar es Salaam to understand how carbon is distributed and what attributes drive storage. View evidence ↗
What they did
- The researchers used a stratified random design with fourteen 25 m × 25 m plots: six in miombo woodland, four in riverine forest, and four in mixed savanna. View evidence ↗
- All trees with a diameter at breast height (DBH) of 10 cm or more were identified by species and measured at a height of 1.3 m. View evidence ↗
- Above-ground biomass was calculated using specific allometric equations: one developed for Tanzanian miombo woodlands and a pantropical equation for riverine forest species. View evidence ↗
- The study estimated carbon content as 47% of the dry biomass. View evidence ↗
What they found
- Tree diversity, measured by the Shannon-Wiener index, was lowest in mixed savanna (2.35) and highest in riverine forest (3.52). View evidence ↗
- The average above-ground carbon stock for the landscape was 72.5 Mg C per hectare, with riverine forests having the highest density at 105.2 Mg C per hectare. View evidence ↗
- Trees were the most common growth form (48%), followed by shrubs (28%), lianas (14%), and herbs (10%). View evidence ↗
- Riverine forests are disproportionately important for carbon storage, containing about 30% of the total landscape carbon despite occupying only 15% of the area. View evidence ↗
What it means
- The authors recommend prioritizing the conservation of riverine forest habitats because they act as concentrated reservoirs of carbon. View evidence ↗
- For miombo woodlands, the authors suggest management should focus on promoting the growth of large-diameter trees to increase carbon storage. View evidence ↗
- The study focused on above-ground carbon; future work should include below-ground biomass, soil organic carbon, and dead wood, which could make up 40-60% of total ecosystem carbon. View evidence ↗
Visual summary
2 visualsIllustrations explain the paper; charts are replotted from the paper's own table values.
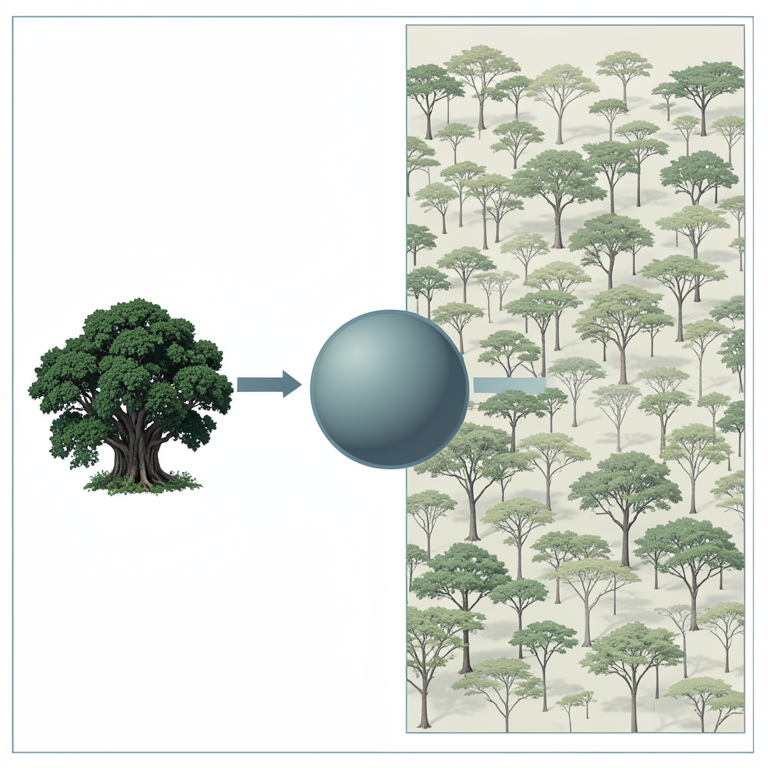
Carbon Distribution vs Area
AI-generated conceptual illustration (East African riverine forests and miombo woodlands). It explains the idea and does not show study data.
View source evidence ↗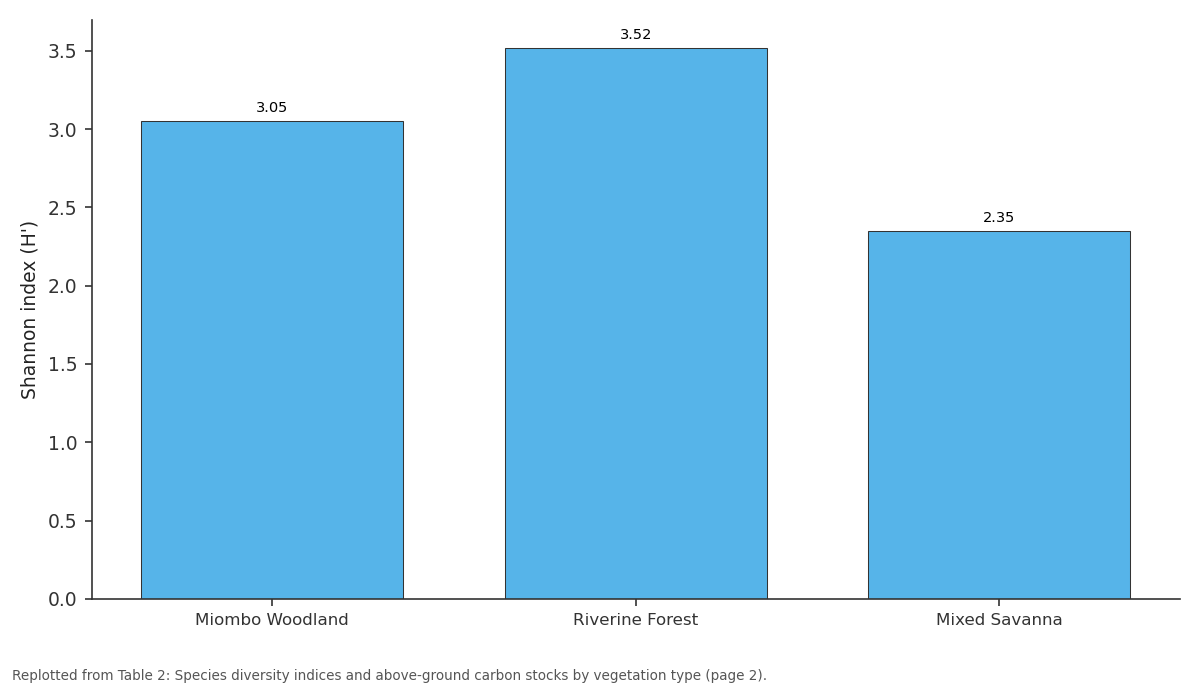
Shannon index (H'): Miombo Woodland vs Riverine Forest vs Mixed Savanna
Replotted from Table 2 (page 2) of the original paper. Every bar is the paper's own table value.
View source evidence ↗Figures & tables
From the original paper Table 1
 Table 2
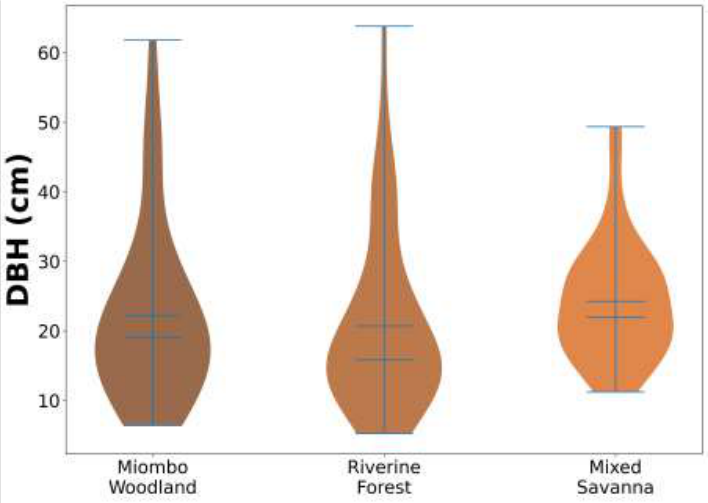 Figure 1
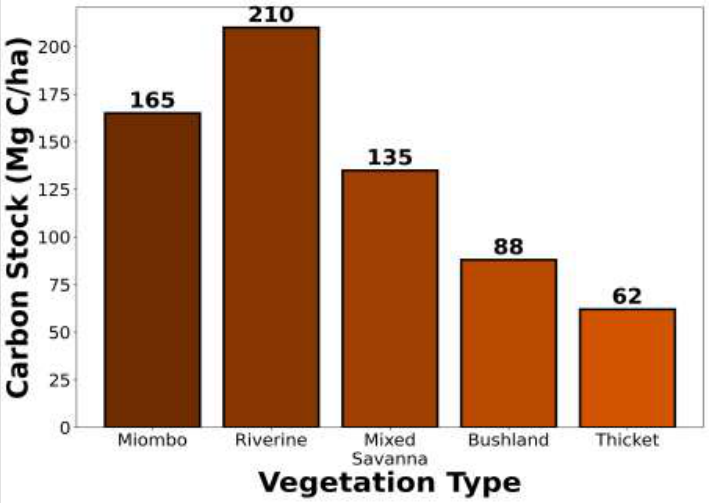 Figure 2
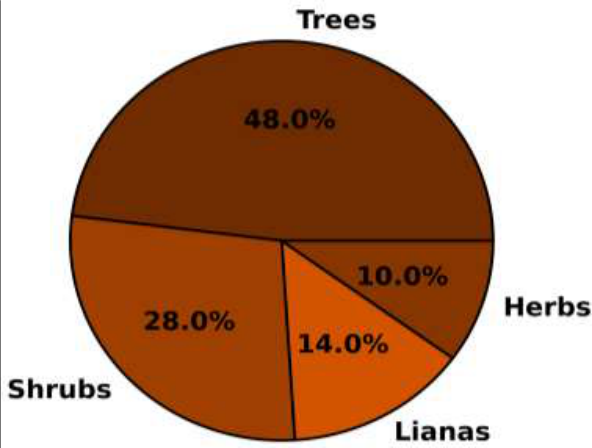 Figure 3
Introduction
While tropical forests and temperate grasslands have received extensive attention in global carbon accounting, the woodland and savanna ecosystems that dominate much of the East African landscape remain comparatively understudied despite their substantial aggregate contribution to continental carbon budgets [1,2] . In contrast, protected landscapes within these regions offer unique opportunities for carbon research under conditions of reduced anthropogenic disturbance, yet systematic assessments linking species-level abundance data to carbon pool estimates are scarce [3] . The miombo woodland biome, which extends across approximately 2.7 million square kilometres of eastern and southern Africa, represents the most extensive tropical dry woodland formation on Earth [4] . Characterized by dominance of Brachystegia, Julbernardia, and Isoberlinia species, miombo woodlands store an estimated 0.8 to 1.5 billion tonnes of above-ground carbon, making them a globally significant though often overlooked carbon reservoir [2,5] . Within Tanzania, miombo and related woodland formations cover approximately 44% of the national land area and are increasingly recognized for their potential contribution to national and international climate change mitigation frameworks including REDD + [6] . Protected landscapes in Tanzania encompass a range of vegetation types beyond miombo woodland, including riverine forests along watercourses, mixed savanna in drier areas, and transitional bushland. Each vegetation type supports distinct tree community compositions with differing structural attributes and consequent carbon storage capacities [3,7] . Understanding the spatial distribution of carbon pools across this vegetation mosaic is essential for prioritizing conservation investments and accurately representing protected landscape carbon stocks in national inventories. Previous assessments of carbon stocks in Tanzanian woodlands have reported highly variable estimates, from 15 Mg C per hectare in degraded miombo to over 100 Mg C per hectare in closed-canopy riverine forests [5,8] . This variability reflects both genuine ecological heterogeneity and methodological differences among assessments, highlighting the need for standardized approaches applied across multiple vegetation types within individual protected landscapes. This research assessed tree species abundance and estimated above-ground carbon pools across miombo woodland, riverine forest, and mixed savanna within a protected landscape near Dar es Salaam, Tanzania, aiming to characterize the vegetation-specific distribution of carbon stocks and identify the species and structural attributes that determine landscape-level carbon storage.
Materials and Methods
Materials and Methods
Material
The research was conducted within a protected landscape situated approximately 70 km southwest of Dar es Salaam, Tanzania (7°05'S, 39°10'E), encompassing approximately 2,600 hectares. The climate is classified as tropical savanna (Aw) with mean annual rainfall of 1,050 mm concentrated between November and April. Mean annual temperature is 26°C. The protected area was gazetted in 2001 and includes three principal vegetation types: miombo woodland covering approximately 55% of the area, mixed savanna covering 30%, and riverine forest along permanent and seasonal watercourses covering 15%. Soils are predominantly sandy ferralitic in upland areas and alluvial clay along watercourses. Elevation ranges from 120 to 280 m above sea level. Research authorization was obtained from the Tanzania Commission for Science and Technology (COSTECH Permit No. 2023-068-NA-2023-52) and the Tanzania National Parks Authority (TANAPA). Ethical approval was provided by the University of Dar es Salaam Research Ethics Committee.
Methods
Fieldwork was conducted between April and November 2023 to encompass both wet and dry season conditions. Fourteen plots of 25 m × 25 m were established using a stratified random design: six plots in miombo woodland, four in riverine forest, and four in mixed savanna, with plot allocation proportional to vegetation type area coverage. Within each plot, all trees with DBH of 10 cm or greater were identified to species level using regional taxonomic references, and DBH was recorded at 1.3 m height using a diameter tape. Total tree height was measured with a Suunto clinometer, and canopy cover was estimated using a spherical densiometer. Above-ground biomass was estimated using the allometric equation of Mugasha et The phased sampling approach revealed progressive differences in species composition and structural complexity across vegetation types. Miombo woodland showed moderate species richness with high structural variability between plots, while riverine forest exhibited the highest diversity and mixed savanna the lowest. Riverine forest showed significantly higher values for all diversity and carbon parameters compared to both miombo woodland and mixed savanna (p < 0.001 for all comparisons). Miombo woodland occupied an intermediate position.
The inventory across fourteen plots documented 785 individual trees belonging to 48 species and 21 families. Fabaceae was the most species-rich family with ten species, contributing notably through the genera Brachystegia, Julbernardia, and Dalbergia. Combretaceae followed with seven species, while Moraceae contributed four species primarily through the genus Ficus. Species overlap between vegetation types was moderate, with 15 species occurring in two or more types and eight species restricted to riverine forest habitat. The bar chart comparison demonstrates the pronounced differences in per-hectare carbon storage among vegetation types. Riverine forest stored approximately three times the carbon of mixed savanna on a per-hectare basis. Miombo woodland, while storing less carbon per hectare than riverine forest, occupied the largest area and therefore contributed the greatest total landscape carbon stock. Trees constituted the dominant growth form at 48% of all recorded woody individuals, followed by shrubs at 28%, lianas at 14%, and herbs at 10%. The relatively high proportion of non-tree growth forms reflects the structural complexity of the protected landscape, particularly within riverine forest habitats where lianas and shrubs contribute substantially to vegetation cover. The integrated assessment reveals that the protected landscape maintains substantial above-ground carbon pools distributed unevenly across vegetation types. The concentration of carbon stocks within riverine forest habitats, which occupy only 15% of the landscape area but contain approximately 30% of total landscape carbon, highlights the disproportionate importance of riparian vegetation for carbon management within protected East African landscapes.
Discussion
The total of 48 tree species recorded within the protected landscape falls within the expected range for coastal miombo and mixed woodland formations in eastern Tanzania. Comparable inventories by Shirima et al. (2015) documented 35 to 65 species per site across Tanzanian miombo landscapes, with species richness correlated with rainfall and elevation [3,5] . The dominance of Fabaceae with ten species reflects the well-documented importance of leguminous trees in miombo systems, where nitrogen fixation by Brachystegia and associated genera supports woodland productivity on nutrient-poor soils [4] . The mean above-ground carbon stock of 72.5 Mg C per hectare across the protected landscape represents a moderate value for East African woodland ecosystems. The finding aligns with previous estimates by Mugasha et al. (2016), who reported above-ground carbon stocks of 50 to 85 Mg C per hectare across Tanzanian miombo sites [8] . However, the comparison reveals notable agreement with the higher end of reported values, suggesting that the protected status of the landscape has permitted greater biomass accumulation than is typical of miombo woodlands under community management regimes where charcoal production and selective harvesting reduce standing biomass [6] . The contrasting carbon stocks across vegetation types within the protected landscape demonstrate the importance of habitat-level resolution in carbon assessments. The dominance of riverine forest as a carbon-dense formation has been documented in similar East African landscapes, where permanent water availability supports larger tree dimensions and higher canopy closure compared to adjacent dryland formations [7] . The finding that riverine forest, despite occupying only 15% of the landscape area, contains approximately 30% of total landscape carbon underscores the conservation importance of riparian habitats for carbon management.
The distinct diameter distribution profiles revealed by the violin plot analysis provide insights into the demographic structure of each vegetation type. The bimodal distribution in riverine forest suggests a self-replacing population with active recruitment into both understorey and canopy positions, while the right-skewed distribution in miombo woodland indicates episodic recruitment with survival to large size classes being relatively rare [2,4] . These structural differences have implications for long-term carbon storage stability, as vegetation types with more balanced demographic structures may maintain more stable carbon pools under disturbance [1] . The relatively high proportion of non-tree growth forms, particularly lianas and shrubs, represents a carbon pool that is often overlooked in assessments focused exclusively on trees. While individual lianas and shrubs store modest amounts of carbon, their collective contribution may be significant, particularly in riverine forest where lianas can contribute 5 to 10% of total above-ground biomass [3,5] .
Fire Ecology and Carbon Dynamics
Fire is a pervasive ecological factor in East African woodlands that directly influences carbon dynamics through combustion of above-ground biomass and indirectly through its effects on vegetation structure and composition. Within the protected landscape, fire management involves prescribed burning during the early dry season to reduce fuel loads and minimize the intensity of late dry-season fires. The impact of fire on carbon stocks depends on fire intensity, frequency, and the post-fire recovery capacity of the vegetation. Miombo species are generally well-adapted to frequent low-intensity fires through thick bark and resprouting ability, but repeated high-intensity fires can suppress recruitment and gradually reduce woodland density and associated carbon stocks.
Comparison with Regional Estimates
Placing the findings of this research within the regional context, the mean carbon stock of 72.
Acknowledgement
AcknowledgementsBSM and ARK contributed to fieldwork and data analysis; EJM designed the research and prepared the manuscript. The Tanzania National Parks Authority provided institutional support and field assistance. This research was funded by the Tanzania National Research Fund.
Figures and tables from the paper
| Phase | Period | Vegetation Type | Plots | Species Found | Key Finding |
|---|---|---|---|---|---|
| 1 | Apr-May 2023 | Miombo woodland | 3 | 28 | Brachystegia dominant |
| 2 | Jun-Jul 2023 | Miombo woodland | 3 | 25 | High structural variability |
| 3 | Aug-Sep 2023 | Riverine forest | 4 | 32 | Highest diversity recorded |
| 4 | Oct-Nov 2023 | Mixed savanna | 4 | 18 | Lowest carbon density |
Table text extracted from the original PDF; superscript letters are shown inline. The original table image is below.
View original table image
| Parameter | Miombo Woodland | Riverine Forest | Mixed Savanna | Overall |
|---|---|---|---|---|
| Species richness | 34 | 38 | 22 | 48 |
| Shannon index (H') | 3.05 | 3.52 | 2.35 | 3.18 |
| Simpson index (1-D) | 0.90 | 0.95 | 0.78 | 0.91 |
| Evenness (J') | 0.82 | 0.88 | 0.72 | 0.84 |
| Stem density (stems/ha) | 385 | 520 | 245 | 375 |
| Mean AGB (Mg/ha) | 125.8 | 223.8 | 72.4 | 154.2 |
| Mean Carbon (Mg C/ha) | 59.1 | 105.2 | 34.0 | 72.5 |
Table text extracted from the original PDF; superscript letters are shown inline. The original table image is below.
View original table image
References
14 in the original paper- Grace J, San Jose J, Meir P, Miranda HS, Montes RA. Productivity and carbon fluxes of tropical savannas. J Biogeogr. 2006;33(3):387-400.
- Williams M, Ryan CM, Rees RM, Sambane E, Fernando J, Grace J. Carbon sequestration and biodiversity of regrowing miombo woodlands in Mozambique. For Ecol Manag. 2008;254(2):145-155.
- Shirima DD, Totland O, Munishi PK, Moe SR. Relationships between tree species richness, evenness and aboveground carbon storage in montane forests and miombo woodlands of Tanzania. Basic Appl Ecol. 2015;16(3):239-249.
- Dongs YD, Saka MG, Adedotun A. Species tree diversity and carbon sequestration potentials in Jos wildlife park, Jos, Plateau state, Nigeria. South Asian J Agric Sci. 2024;4(1):28-36.
- Campbell BM, Angelsen A, Cunningham A, Katerere Y, Sitoe A, Wunder S. Miombo woodlands: Opportunities and barriers to sustainable forest management. CIFOR. 2007;1-38.
- Mugasha WA, Eid T, Bollandsas OM. Allometric models for prediction of above-and belowground biomass of trees in the miombo woodlands of Tanzania. For Ecol Manag. 2013;310:87-101.
- Ribeiro NS, Shugart HH, Washington-Allen R. The effects of fire and elephants on species composition and structure of the Niassa Reserve, northern Mozambique. For Ecol Manag. 2008;255(5-6):1626-1636.
- Mugasha WA, Bollandsas OM, Eid T. Relationships between diameter and height of trees in natural tropical forest in Tanzania. South For. 2016;78(1):1-8.
- Ryan CM, Berry NJ, Joshi N. Quantifying small-scale deforestation and forest degradation in African woodlands using radar imagery. Glob Change Biol. 2014;20(10):3223-3236.
- Mauya EW, Mugasha WA, Zahabu E. Carbon stocks of indigenous tree species in miombo woodlands of Mainland Tanzania. For Res. 2019;8(4):1-9.
- Kalaba FK, Quinn CH, Dougill AJ. Contribution of forest provisioning ecosystem services to rural livelihoods in the Miombo woodlands of Zambia. Popul Environ. 2013;35(2):159-182.
- Malmer A, Murdiyarso D, Bruijnzeel LA, Ilstedt U. Carbon sequestration in tropical forests and water: A critical look at the basis for commonly used generalizations. Glob Change Biol. 2010;16(2):599604.
- McNicol IM, Ryan CM, Williams M. Carbon losses from deforestation and widespread degradation offset by extensive growth in African woodlands. Nat Commun. 2018;9(1):1-11.
- Chidumayo EN, Gumbo DJ. The dry forests and woodlands of Africa: Managing for products and services. Earthscan. 2010;1-288.