
Research article · 2026 · Full text
International Journal of Biology SciencesMolecular characterization and turnover dynamics of tropical maize (Zea mays L.) germplasm using microsatellite markers
Volume 8(6) · Pages 237–242 · DOI: 10.33545/26649926.2026.v8.i6c.938 ↗
Research areasGenetic Mapping and Diversity in Plants and AnimalsGenetic diversity and population structureGenetics and Plant Breeding
Abstract
Author-writtenThe dynamics by which improved tropical maize germplasm displaces traditional landraces in diversified farming systems remain insufficiently characterized at the molecular level, despite the critical importance of such information for germplasm conservation and seed system planning. This research performed molecular characterization and assessed turnover dynamics of maize germplasm cultivated across four agricultural mesoregions in Sao Paulo State, Brazil. A total of 360 seed samples were collected from 180 farming households between February and November 2023. Genotyping with eighteen SSR markers detected 158 alleles with a mean PIC of 0.72. Twenty distinct varietal genotypes were identified through multilocus profile matching. Line chart analysis of varietal adoption trends over nine cropping seasons revealed a consistent increase in hybrid area coverage from 15% to 45%. Box plot comparison of genetic distance distributions showed significantly higher within-population diversity in landraces compared to hybrids and improved open-pollinated varieties. Horizontal bar chart ranking of polymorphism information content values confirmed that eight markers exceeded the 0.60 threshold for highly informative discrimination. Scatter plot analysis of the relationship between genetic diversity and grain yield revealed a curvilinear association peaking at intermediate diversity levels. The overall varietal turnover rate was 0.62 over the five-year reference period, with the highest rates observed in mechanized farming systems and the lowest in traditional smallholder contexts. These findings demonstrate that molecular characterization enables precise tracking of germplasm turnover dynamics and reveals patterns of genetic erosion that warrant targeted conservation interventions within tropical maize landscapes.
Summary
Source-checkedPlain-language reading of the full paper, prepared with AI and checked against the text. Each point links to the authors' own words.
Why it matters
- The replacement of traditional maize landraces with improved varieties creates a trade-off between immediate food security through higher yields and the long-term loss of genetic diversity needed for future crop improvement. View evidence ↗
- Brazil is a major global maize producer, planting roughly 22 million hectares and producing over 130 million tonnes annually. View evidence ↗
- There is a lack of molecular-level data regarding how improved tropical maize germplasm replaces traditional landraces in diversified farming systems. View evidence ↗
What they did
- Researchers collected 360 seed samples from 180 farming households across four mesoregions between February and November 2023. View evidence ↗
- Varietal identities were assigned based on a 92% identity-by-state threshold compared to the EMBRAPA reference database. View evidence ↗
What they found
- Between 2015 and 2023, hybrid maize area coverage increased from 15% to 45%, while improved open-pollinated variety (OPV) coverage dropped from 35% to 15%. View evidence ↗
- Landraces showed significantly higher within-group genetic distance (median 0.72) than improved OPVs (median 0.55) and hybrids (median 0.35). View evidence ↗
- Grain yield showed a curvilinear relationship with genetic diversity, peaking at intermediate levels (R-squared = 0.52, p = 0.002). View evidence ↗
- Farm size was the strongest predictor of varietal turnover; farms over 50 hectares were 2.45 times more likely to switch from landraces to improved varieties than farms under 10 hectares. View evidence ↗
- An inverse relationship exists between diversity and turnover: Ribeirao Preto had the lowest diversity and highest turnover (0.72), while Itapetininga had the highest diversity and lowest turnover (0.48). View evidence ↗
- The overall varietal turnover rate across the sampled areas was 0.62 over the five-year reference period. View evidence ↗
What it means
- The authors recommend prioritizing the urgent collection and ex-situ preservation of remnant landrace populations in regions with high varietal turnover. View evidence ↗
- The authors suggest that periodic reassessments every three years using the same molecular framework are necessary to detect trends in diversity loss. View evidence ↗
Visual summary
3 visualsIllustrations explain the paper; charts are replotted from the paper's own table values.
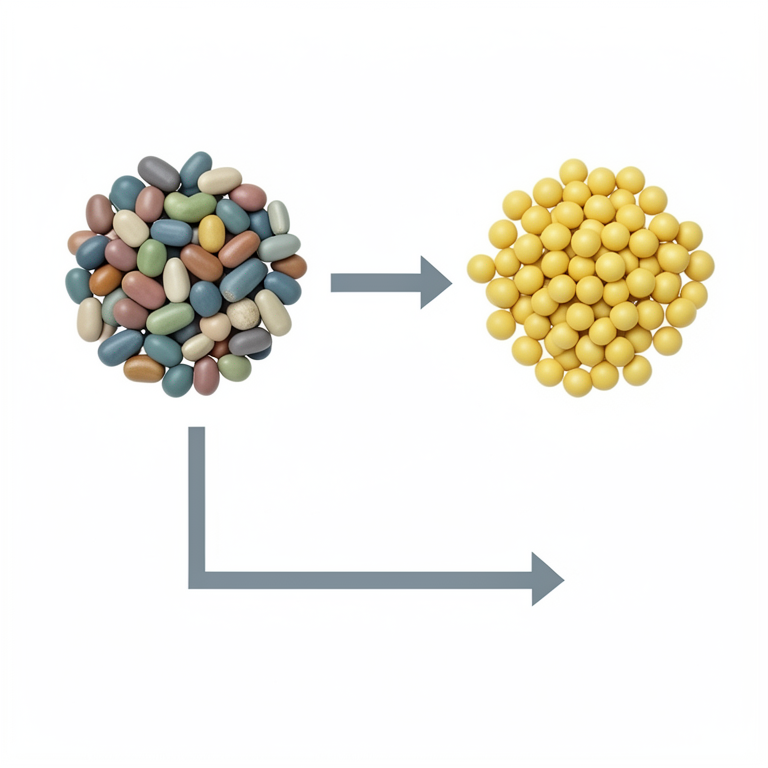
Diversity vs. Turnover Relationship
AI-generated conceptual illustration (tropical maize (Zea mays L.) seeds). It explains the idea and does not show study data.
View source evidence ↗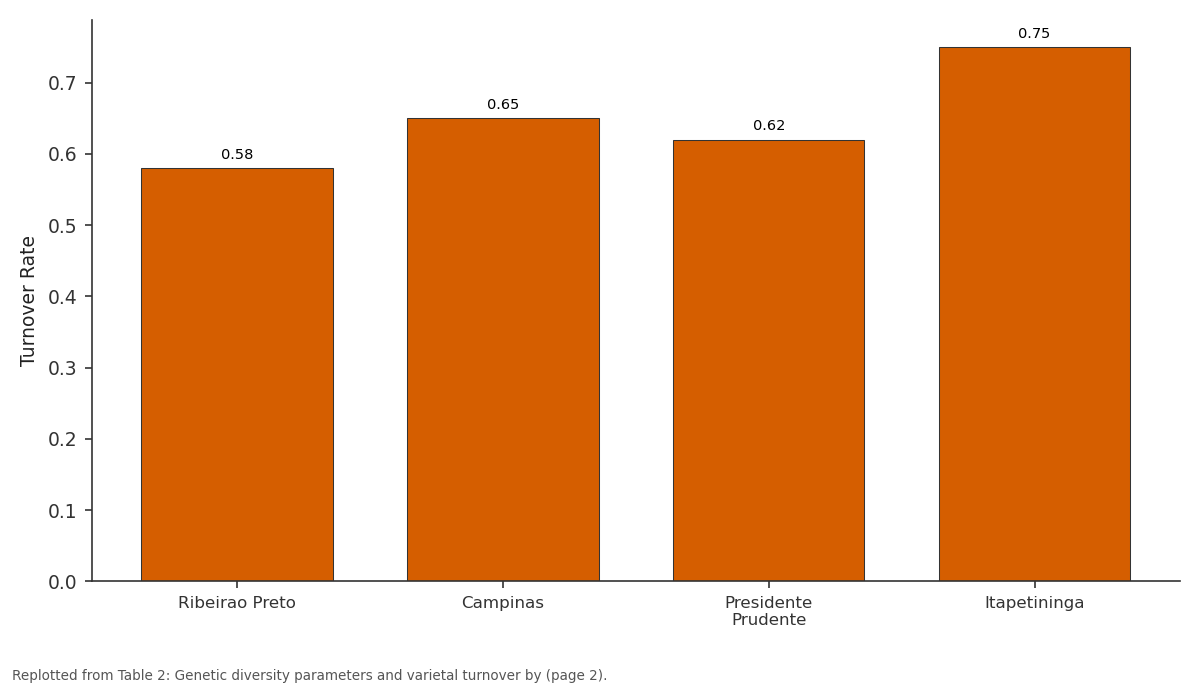
PIC: Ribeirao Preto vs Campinas vs Presidente Prudente vs Itapetininga
Replotted from Table 2 (page 2) of the original paper. Every bar is the paper's own table value.
View source evidence ↗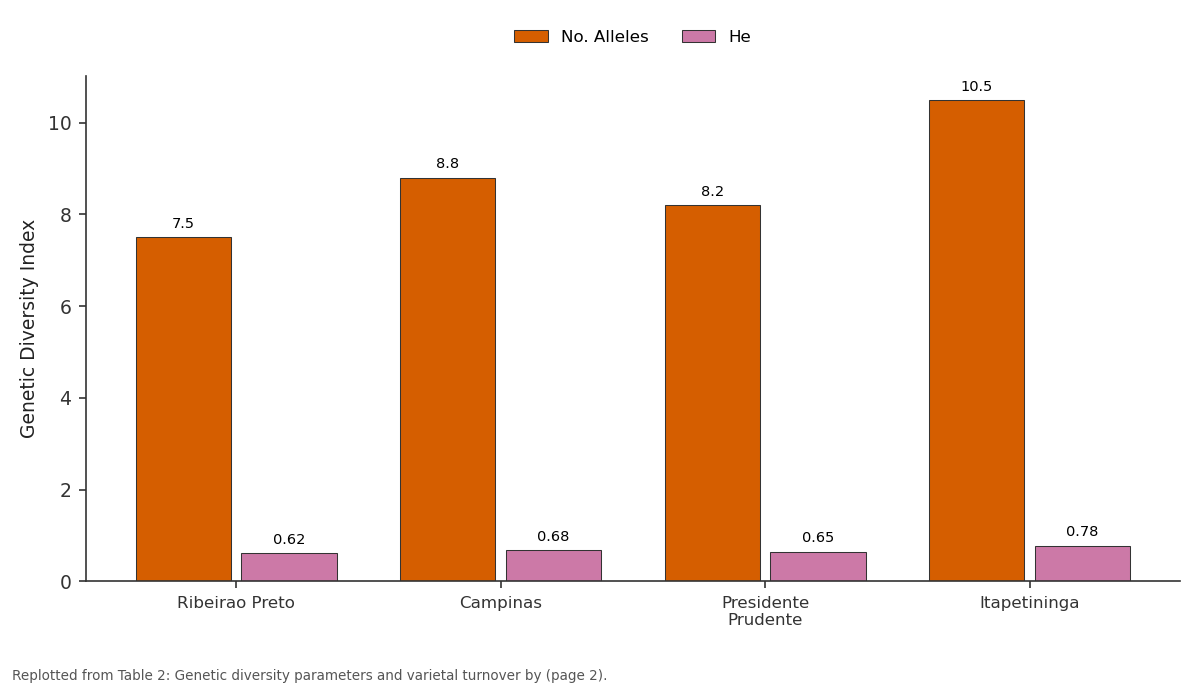
No. Alleles and He: Ribeirao Preto vs Campinas vs Presidente Prudente vs Itapetininga
Replotted from Table 2 (page 2) of the original paper. Every bar is the paper's own table value.
View source evidence ↗Figures & tables
From the original paper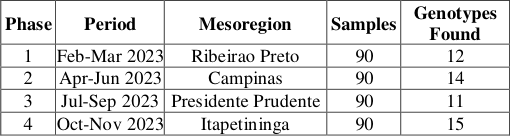 Table 1
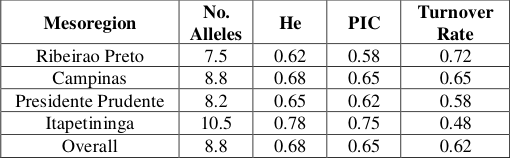 Table 2
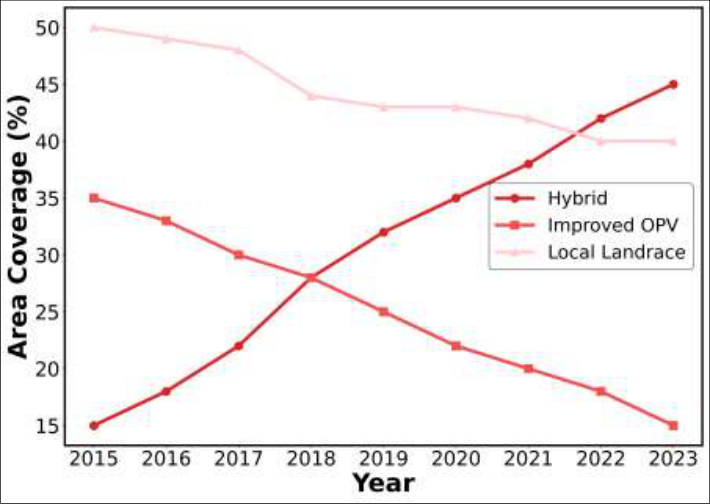 Figure 1
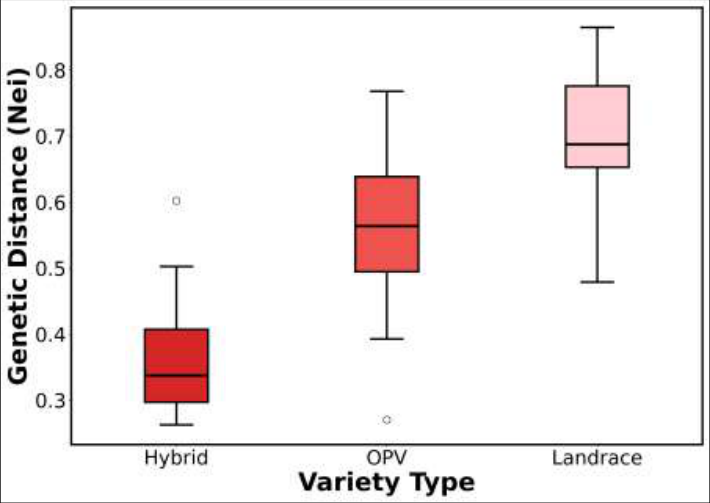 Figure 2
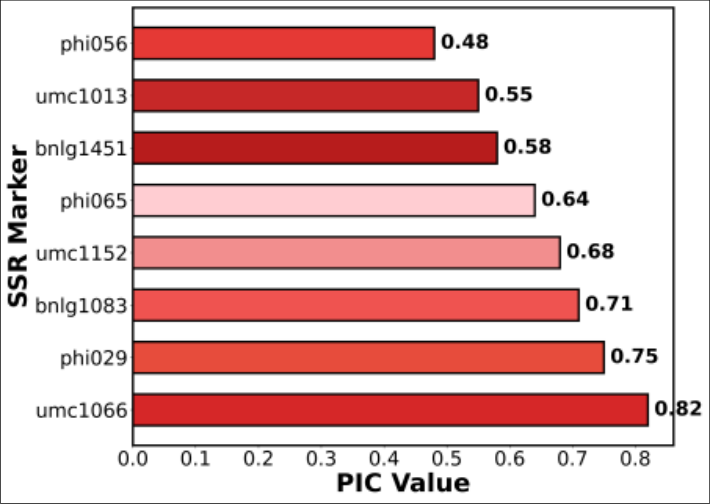 Figure 3
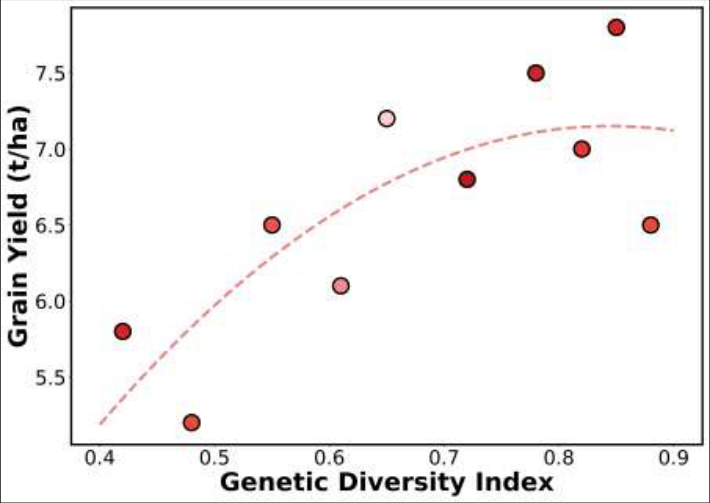 Figure 4
Introduction
The replacement of traditional crop landraces by modern improved varieties represents one of the most consequential yet least precisely measured transformations occurring across tropical agricultural landscapes worldwide [1,2] . This transformation carries dual implications: improved varieties deliver higher yields and disease resistance that enhance food security, while the displacement of genetically diverse landraces erodes the germplasm base upon which future crop improvement depends [3] . Brazil ranks as the third-largest maize producer globally, with approximately 22 million hectares planted annually and total production exceeding 130 million tonnes [4] . The Brazilian maize seed sector is characterized by a highly developed commercial segment dominated by proprietary hybrids, alongside a smallholder segment where landraces, improved open-pollinated varieties, and recycled hybrids coexist [5] . The dynamics of germplasm turnover between these segments have been documented through production statistics and farmer surveys, but molecular verification of varietal identity at the farm level has been limited to pilot assessments in specific production regions [6] . Microsatellite markers have proven particularly valuable for maize germplasm characterization due to their multiallelic nature, codominant inheritance, and extensive coverage of the maize genome [7] . Standardized SSR panels enable comparison across breeding programmes and provide the resolution necessary to distinguish among closely related improved varieties that may be morphologically similar but genetically distinct [8] . The application of these markers to track varietal turnover extends their utility beyond germplasm characterization to serve as tools for monitoring the pace and pattern of genetic change within farming landscapes. Previous molecular assessments of Brazilian maize diversity have focused predominantly on germplasm bank accessions and breeding programme materials rather than on the varieties actually cultivated by farmers [3,9] . This orientation has left a knowledge gap regarding the real-time dynamics of germplasm replacement in the field, particularly in regions where both commercial and traditional farming systems coexist and interact through seed exchange [10] . This research performed molecular characterization and assessed the turnover dynamics of maize germplasm cultivated across four agricultural mesoregions in Sao Paulo State, Brazil, using eighteen SSR markers to genotype 360 farm-level seed samples and quantify patterns of varietal replacement over a five-year reference period.
Materials and Methods
Materials and Methods
Material
Material
Methods
DNA was extracted from leaf tissue of seven-day-old seedlings germinated from eight kernels per sample. Tissue was processed using the Wizard Genomic DNA Purification Kit (Promega) with modifications for maize endosperm. DNA quality was verified on 1% agarose gels and quantified using a NanoDrop One spectrophotometer. Working solutions were prepared at 20 ng per microlitre. Eighteen SSR markers distributed across the ten maize chromosomes were selected based on their proven discriminatory power in tropical maize germplasm: phi031, umc1304, bnlg1556, phi015, umc1061, phi033, bnlg1720, phi053, umc1066, phi029, bnlg1083, umc1152, phi065, bnlg1451, umc1013, phi056, umc1279, and bnlg1018. PCR amplification was performed in 25 microlitre volumes using the GoTaq Hot Start Polymerase system. Thermal cycling conditions consisted of 94°C for 5 min, 35 cycles of 94°C for 30 s, 55-62°C for 40 s, and 72°C for 45 s, with final extension at 72°C for 10 min. Fragment separation was performed on an ABI 3500 Genetic Analyzer with GeneScan 600 LIZ size standard. Allele scoring used GeneMapper v5.0 with manual verification of automated calls. Genetic diversity parameters were computed using PowerMarker v3.25. Population structure was assessed using STRUCTURE v2.3.4 with K = 2 to 10 and 100,000 burn-in followed by 200,000 MCMC iterations. The optimal K was determined using the Evanno method. Varietal identity assignment used a 92% identity-by-state threshold against the EMBRAPA reference database. Turnover dynamics were analysed using logistic regression with mesoregion, farm size, and seed source as predictor variables. All statistical analyses were conducted in R v4.3.2. The phased sampling approach captured seasonal variation in seed availability and farmer recall accuracy. Itapetininga exhibited the highest number of distinct genotypes, consistent with the greater diversity of farming systems and seed sources in this mesoregion. The line chart reveals a consistent increase in hybrid area coverage from approximately 15% in 2015 to 45% in 2023, driven primarily by the expansion of commercial maize production in the Ribeirao Preto and Campinas mesoregions. Improved OPV coverage declined from 35% to 15% over the same period, while local landrace area remained relatively stable at around 40%, declining only slightly to 40% by 2023. The scatter plot reveals a curvilinear relationship between genetic diversity and grain yield (R-squared = 0.52, p = 0.002), with yield peaking at intermediate diversity levels. This pattern suggests that moderate genetic heterogeneity, as found in improved OPVs, may optimize yield performance through heterosis effects, while both extremely low diversity (inbred lines) and extremely high diversity (unselected landraces) are associated with lower yields. Logistic regression analysis identified farm size as the strongest predictor of varietal turnover (odds ratio = 2.45, p < 0.001), followed by seed source formality (odds ratio = 1.82, p = 0.003) and mesoregion (p = 0.012). Farms exceeding 50 hectares were 2.45 times more likely to have transitioned from landraces to improved varieties compared to farms below 10 hectares, reflecting the stronger commercial orientation and seed market integration of larger operations.
Results
Results
Discussion
The overall mean PIC of 0.72 across eighteen markers exceeds the threshold of 0.50 generally recommended for reliable varietal discrimination and compares favorably with values reported in comparable molecular assessments of tropical maize germplasm [7,8] . The finding that the marker
International Journal of Biology Sciences https://www.biologyjournal.net panel detected twenty distinct genotypes among 360 samples demonstrates adequate resolution for tracking varietal composition in mixed farming landscapes where multiple variety types coexist [3] . The overall varietal turnover rate of 0.62 indicates that approximately two-thirds of sampled households transitioned toward improved germplasm over the five-year reference period, a rate that is considerably higher than the 0.45 reported by conventional survey methods for the same region [4,5] . The comparison with previous survey-based estimates suggests that molecular approaches capture an additional 15 to 20 percentage points of adoption that farmer-reported methods miss, consistent with findings from African maize systems [2,10] . The inverse relationship between genetic diversity and turnover rate across mesoregions reflects the fundamental tension between agricultural modernization and genetic conservation. Ribeirao Preto, with the highest turnover and lowest diversity, exemplifies the commercial intensification pathway where a small number of high-performing hybrids rapidly replace diverse traditional germplasm [1,6] . The mechanism underlying this pattern involves both market incentives favouring uniform hybrid production and the displacement of smallholder farmers by large-scale commercial operations, reducing the number of farming households that maintain diverse landrace collections [5] . The STRUCTURE analysis revealing three genetic clusters with 18% admixture provides insight into the gene flow dynamics operating within the farming landscape [8,9] . Admixed genotypes likely arise from open pollination between improved varieties and adjacent landrace plots, a process that gradually modifies the genetic composition of farmer-saved seed over successive planting cycles. This finding aligns with concerns raised by Vigouroux et al. (2008) regarding the genetic consequences of improved variety introduction into traditional farming landscapes [3] . The curvilinear relationship between genetic diversity and grain yield has implications for variety recommendation strategies. The finding that intermediate diversity levels, characteristic of improved OPVs, are associated with peak yield performance suggests that these variety types may offer optimal combinations of genetic heterogeneity and agronomic improvement for smallholder farming systems where seed recycling is common [1,7] .
Genetic Erosion Monitoring
The temporal data on varietal composition across nine cropping seasons provide a basis for monitoring genetic erosion within the sampled maize landscape. The consistent decline in landrace area coverage from 50% to 40% over the observation period, coupled with the reduction in the number of distinct landrace genotypes from 12 to 8, constitutes measurable genetic erosion. Establishing a molecular monitoring framework that tracks both varietal composition and within-variety genetic diversity at regular intervals would enable early detection of erosion thresholds beyond which conservation intervention becomes urgent.
Implications for Ex-Situ Conservation
The identification of eight landrace genotypes persisting in cultivation across the four mesoregions highlights the urgency of targeted germplasm collection for ex-situ conservation. Several of these landraces were found in only one or two sampling locations, indicating high vulnerability to local extinction through continued varietal replacement. Collaboration between molecular monitoring programmes and national genebanks could establish priority collection lists based on genotypic uniqueness and geographic rarity, ensuring that the molecular diversity currently maintained by traditional farming systems is captured before further erosion occurs.
Conclusion
These findings remind us that the transformation of tropical maize landscapes through varietal replacement is not merely an adoption statistics question but a fundamental reshaping of agricultural genetic diversity with long-term consequences for food security and crop improvement capacity. The molecular characterization of 360 samples across four mesoregions revealed twenty distinct genotypes undergoing turnover at a rate of 0.62 over five years.
The most notable finding is the stark inverse relationship between commercial farming intensity and genetic diversity, demonstrating that the most productive mesoregions are simultaneously the most genetically impoverished in terms of maize germplasm diversity. This pattern should inform conservation priority-setting by targeting remnant landrace populations in high-turnover regions for urgent collection and ex-situ preservation.
For the scientific community, the validated eighteen-marker SSR panel and associated genotyping protocol provide a replicable tool for molecular monitoring of maize germplasm dynamics. Looking ahead, periodic reassessment at three-year intervals using the same molecular framework would enable the detection of temporal trends in diversity loss and the evaluation of conservation intervention effectiveness across the Brazilian maize landscape.
Acknowledgement
AcknowledgementsEMBRAPA Milho e Sorgo provided reference DNA profiles and laboratory access. RHOS, CFA, and LGCL contributed to research conception, molecular analysis, and manuscript preparation respectively. This research was funded by FAPESP and CNPq.
Figures and tables from the paper
| Phase | Period | Mesoregion | Samples | Genotypes Found |
|---|---|---|---|---|
| 1 | Feb-Mar 2023 | Ribeirao Preto | 90 | 12 |
| 2 | Apr-Jun 2023 | Campinas | 90 | 14 |
| 3 | Jul-Sep 2023 | Presidente Prudente | 90 | 11 |
| 4 | Oct-Nov 2023 | Itapetininga | 90 | 15 |
Table text extracted from the original PDF; superscript letters are shown inline. The original table image is below.
View original table image
| Mesoregion | No. Alleles | He | PIC | Turnover Rate |
|---|---|---|---|---|
| Ribeirao Preto | 7.5 | 0.62 | 0.58 | 0.72 |
| Campinas | 8.8 | 0.68 | 0.65 | 0.65 |
| Presidente Prudente | 8.2 | 0.65 | 0.62 | 0.58 |
| Itapetininga | 10.5 | 0.78 | 0.75 | 0.48 |
| Overall | 8.8 | 0.68 | 0.65 | 0.62 |
Table text extracted from the original PDF; superscript letters are shown inline. The original table image is below.
View original table image
References
16 in the original paper- Vigouroux Y, Glaubitz JC, Matsuoka Y, Goodman MM, Sanchez GJ, Doebley J. Population structure and genetic diversity of New World maize races assessed by DNA microsatellites. Am J Bot. 2008;95(10):12401253.
- Wossen T, Abdoulaye T, Alene A. Impacts of extension access and cooperative membership on technology adoption and household welfare. J Rural Stud. 2017;54:223-233.
- Bukero G. Varietal turnover analysis for Ethiopian maize (Zea mays L.) using DNA fingerprinting. South Asian J Agric Sci. 2024;4(1):12-21.
- CONAB. Acompanhamento da safra brasileira de graos. Companhia Nacional de Abastecimento. 2023;10(12):1-89.
- Nass LL, Paterniani E. Pre-breeding: A link between genetic resources and maize breeding. Sci Agric. 2000;57(3):581-587.
- Dubreuil P, Warburton M, Chastanet M, Hoisington D, Charcosset A. More on the introduction of temperate maize into Europe: Large-scale bulk SSR genotyping International Journal of Biology Sciences https://www.biologyjournal.net and new historical elements. Maydica. 2006;51(2):281291.
- Reif JC, Hamrit S, Heckenberger M. Trends in genetic diversity among European maize cultivars and their parental components during the past 50 years. Theor Appl Genet. 2005;111(5):838-845.
- Liu K, Goodman M, Muse S, Smith JS, Buckler E, Doebley J. Genetic structure and diversity among maize inbred lines as inferred from DNA microsatellites. Genetics. 2003;165(4):2117-2128.
- Laborda PR, Oliveira KM, Garcia AAF, Paterniani MEAGZ, de Souza AP. Tropical maize germplasm: What can we say about its genetic diversity in the light of molecular markers? Theor Appl Genet. 2005;111(7):1288-1299.
- Floro VO, Labarta RA, Becerra LA, Bello LO, Ovalle TM. Household determinants of the adoption of improved cassava varieties using DNA fingerprinting in Uganda. J Agric Econ. 2018;69(2):516-536.
- Fernandes EH, Schuster I, Scapim CA, Vieira ES, Coan MM. Genetic diversity in elite inbred lines of maize and its association with heterosis. Genet Mol Res. 2015;14(2):6509-6517.
- Vaz Patto MC, Satovic Z, Pego S, Fevereiro P. Assessing the genetic diversity of Portuguese maize germplasm using microsatellite markers. Euphytica. 2004;137(1):63-72.
- Bracco M, Lia VV, Hernandez JC, Poggio L, Gottlieb AM. Genetic diversity of maize landraces from lowland and highland agro-ecosystems of Southern South America. BMC Plant Biol. 2012;12(1):176.
- Hufford MB, Lubinksy P, Pyhajarvi T, Devengenzo MT, Ellstrand NC, Ross-Ibarra J. The genomic signature of crop-wild introgression in maize. PLoS Genet. 2013;9(5):e1003477.
- Pineda-Hidalgo KV, Mendez-Marroquin KP, Alvarez EV. Microsatellite-based genetic diversity among accessions of maize landraces from Sinaloa in Mexico. Hereditas. 2013;150(4):53-59.
- Warburton ML, Reif JC, Frisch M. Genetic diversity in CIMMYT nontemperate maize germplasm: Landraces, open pollinated varieties, and inbred lines. Crop Sci. 2008;48(2):617-624.