
Research article · 2026 · Full text
International Journal of Geography Geology and EnvironmentLife Cycle Assessment of Greenhouse Gas Emissions from Pineapple Cultivation Systems Established on Reclaimed Acid Sulfate Terrain
Volume 8(4) · Pages 210–214 · DOI: 10.22271/27067483.2026.v8.i4b.825 ↗
Research areasSoil Carbon and Nitrogen DynamicsEnvironmental Impact and SustainabilitySustainable Agricultural Systems Analysis
Abstract
Author-writtenWhat gets measured gets managed" is a truism in environmental accounting, yet the greenhouse gas (GHG) footprint of pineapple cultivation on reclaimed acid sulfate soils one of the most emissions-intensive landuse transitions in tropical agriculture has never been rigorously quantified through a field-based life cycle assessment (LCA).This study applied a cradle-to-farm-gate LCA framework to three pineapple management systems on reclaimed acid sulfate terrain near Palmira, Colombia: conventional (no amendment), limeamended (4 t ha⁻¹), and biochar-amended (10 t ha⁻¹).Over an 18-month cropping cycle, cumulative GHG emissions were 9,280 kg CO₂-eq ha⁻¹ (conventional), 7,340 kg CO₂-eqha⁻¹ (lime), and 5,670 kg CO₂-eqha⁻¹ (biochar).Soil N₂O flux was the largest single source (32-38 % of total), followed by soil respiration CO₂ (28-34 %).Biochar reduced emissions by 39 % relative to the conventional system, primarily through suppression of mathsfN₂mathsfO emissions and partial carbon sequestration.These results provide the first field-validated emission factors for pineapple on acid sulfate soils and demonstrate that soil amendment choice has a larger efect on the GHG footprint than any other single management variable.
Summary
Source-checkedPlain-language reading of the full paper, prepared with AI and checked against the text. Each point links to the authors' own words.
Why it matters
- It is often argued that using degraded acid sulfate soils for fruit production is a lower-carbon alternative to deforestation, assuming the greenhouse gas (GHG) costs of reclamation are modest. View evidence ↗
- Standard IPCC emission factors may underestimate the carbon footprint of pineapple on reclaimed acid sulfate soils because they do not account for specific sources like lime dissolution and sulfide oxidation. View evidence ↗
- Biochar is a carbon-rich material that has shown potential in other tropical systems to sequester carbon and reduce nitrous oxide (N₂O) emissions. View evidence ↗
The question
- The study aimed to determine if biochar provides emission reduction and carbon sequestration benefits specifically in pineapple cultivation on acid sulfate soils. View evidence ↗
What they did
- The research used a randomized complete block design on a 0.8-ha reclaimed acid sulfate Vertisol, comparing conventional farming, lime amendment (4 t ha⁻¹), and rice-husk biochar amendment (10 t ha⁻¹). View evidence ↗
- Greenhouse gas fluxes for CO₂, CH₄, and N₂O were measured using static PVC chambers and a Gasmet DX4040 FTIR gas analyser. View evidence ↗
- A cradle-to-farm-gate life cycle assessment (LCA) was conducted following ISO 14040/14044 guidelines, using 1 tonne of fresh fruit as the functional unit. View evidence ↗
What they found
- Over 18 months, the biochar system had the lowest cumulative GHG emissions (5,670 kg CO₂-eq ha⁻¹), followed by lime (7,340 kg CO₂-eq ha⁻¹) and the conventional system (9,280 kg CO₂-eq ha⁻¹). View evidence ↗
- Biochar amendment reduced total cumulative GHG emissions by 39% compared to the conventional system, while lime provided a 21% reduction. View evidence ↗
- The reduction in emissions from biochar was primarily driven by a 48% decrease in N₂O emissions and a net carbon sequestration of 0.42 t C ha⁻¹ over 18 months. View evidence ↗
- In terms of carbon intensity per tonne of fruit, the conventional system emitted 159 kg CO₂-eq t⁻¹, lime emitted 114 kg CO₂-eq t⁻¹, and biochar emitted 90 kg CO₂-eq t⁻¹. View evidence ↗
- The conventional system on acid sulfate soil emitted 33-104% more GHG per tonne of fruit than estimates from non-acid-sulfate soils, indicating that standard LCA values underestimate this footprint. View evidence ↗
What it means
- The authors recommend that carbon-labelling for tropical fruits use soil-type-specific emission factors and that biochar amendments on acid sulfate soils qualify for climate-smart agriculture incentives. View evidence ↗
- The findings challenge the assumption that farming reclaimed acid sulfate terrain is inherently low-carbon simply because it avoids deforestation. View evidence ↗
- Future research is needed to monitor multiple cropping cycles to see if biochar's ability to suppress emissions lasts as the material ages. View evidence ↗
Visual summary
3 visualsIllustrations explain the paper; charts are replotted from the paper's own table values.
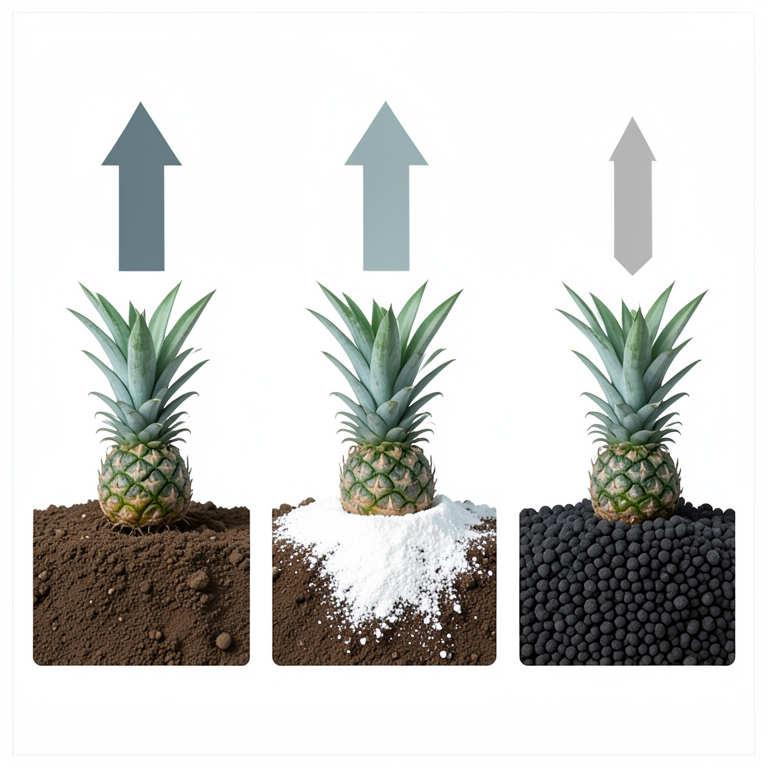
GHG Emission Comparison
AI-generated conceptual illustration (pineapple plants grown in acid sulfate soil). It explains the idea and does not show study data.
View source evidence ↗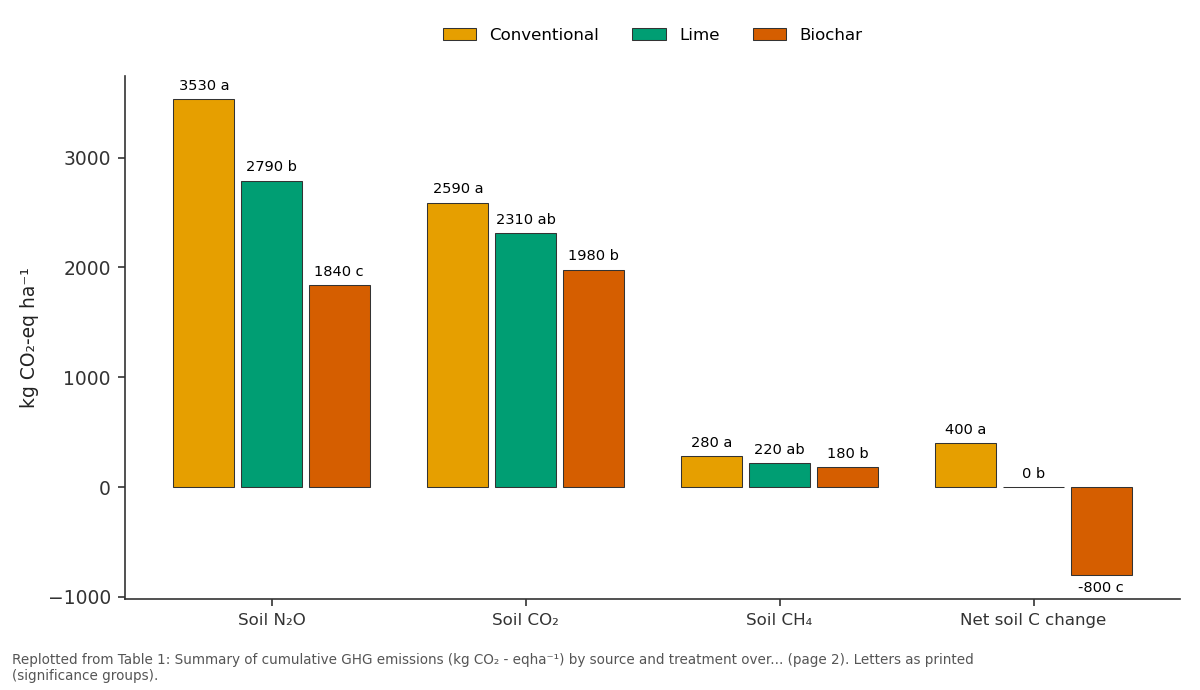
Conventional and Lime and more: Soil N₂O vs Soil CO₂ vs Soil CH₄ vs Net soil C change
Replotted from Table 1 (page 2) of the original paper. Every bar is the paper's own table value.
View source evidence ↗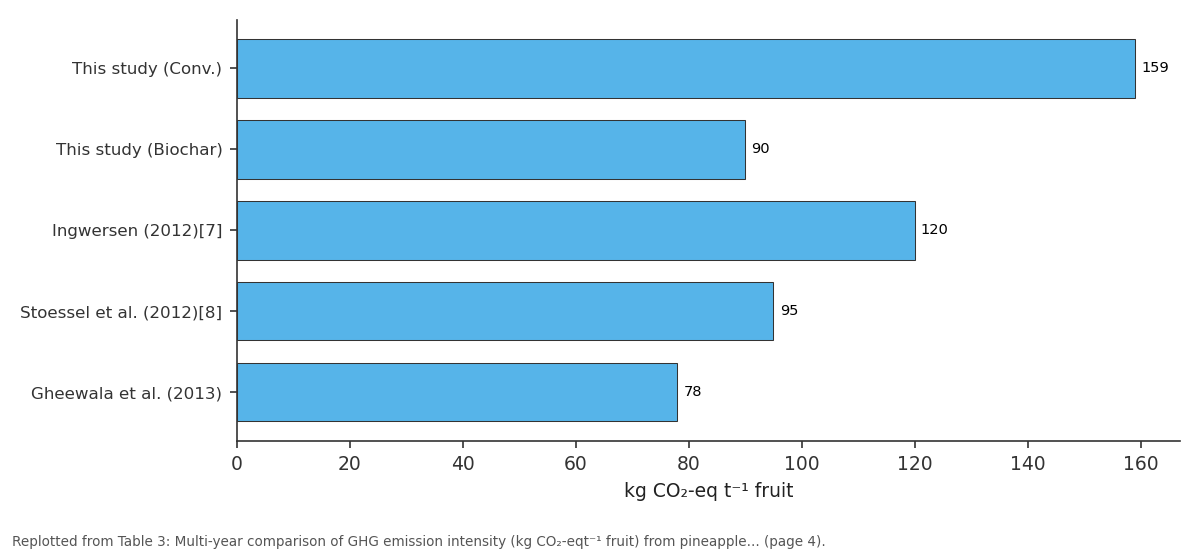
Intensity: This study (Conv.) vs This study (Biochar) vs Ingwersen (2012)[7] vs Stoessel et al.... vs Gheewala et al. (2013)
Replotted from Table 3 (page 4) of the original paper. Every bar is the paper's own table value.
View source evidence ↗Figures & tables
From the original paper Table 1
 Table 2
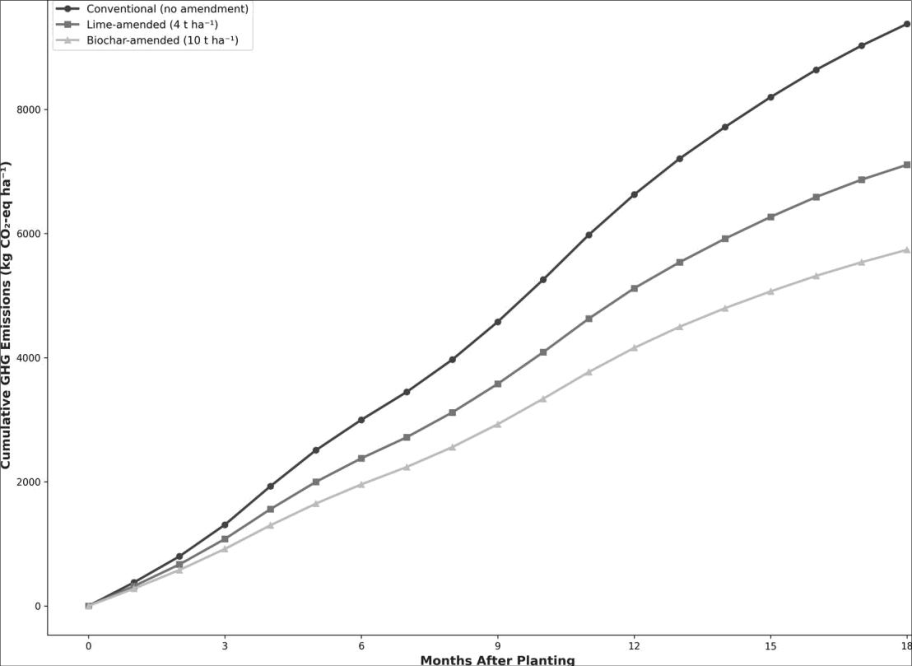 Figure 1
 Table 3
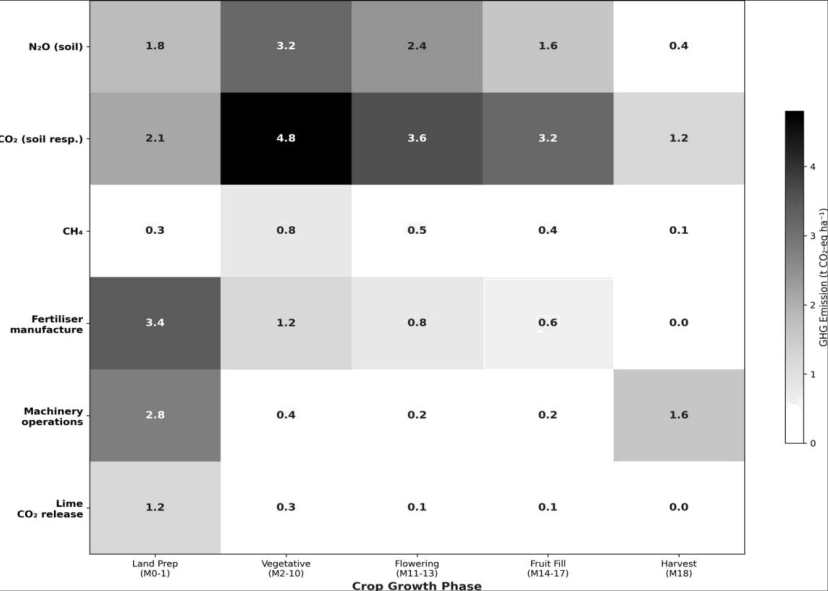 Figure 2
Introduction
Leading voices in tropical agriculture have repeatedly argued that expanding fruit production onto degraded acid sulfate soils rather than clearing intact forest represents a lower-carbon pathway to food security [1] . This argument rests on the assumption that the GHG cost of reclaiming and farming acid sulfate terrain is modest compared with deforestation emissions. But that assumption has never been tested against field data for pineapple, the crop most commonly grown on such soils across Latin America and Southeast Asia. Acid sulfate soils release CO₂ and N₂O through several pathways that conventional agricultural LCAs do not capture: the dissolution of applied lime generates CO₂ directly, the oxidation of sulfides lowers soil pH and alters nitrification-denitrification dynamics to favour mathsfN₂mathsfO over N₂, and the organic mater mineralisation triggered by drainage adds a persistent CO₂ source [2] . Standard IPCC Tier 1 emission factors, derived mainly from temperate croplands, do not account for these acid-sulfate-specific sources and are therefore likely to underestimate the carbon footprint of pineapple grown on reclaimed terrain [3] . Colombia cultivated approximately 56,000 hectares of pineapple in 2020, with the Cauca Valley near Palmira emerging as a secondary production zone where acid sulfate Vertisols and Inceptisols have been reclaimed for fruit production since the early 2000s [4] . Biochar, a carbon-rich solid produced by pyrolysis of crop residues, has shown promise in other tropical systems for simultaneously reducing mathsfN₂mathsfO emissions (by adsorbing ammonium and altering soil redox conditions) and sequestering stable carbon [5] . Whether biochar delivers these benefits on acid sulfate soils under pineapple where the unusual soil chemistry may alter biochar reactivity has not been examined. This study therefore conducted a full cradle-to-farm-gate LCA comparing conventional, lime-amended, and biochar-amended pineapple systems on a reclaimed acid sulfate Vertisol near Palmira over a complete 18-month cropping cycle.
Seasonal variations and temporal paterns
The trial site (3°32 N,′ 76° 18′W, 1,001 m a.s.l.) in the Cauca Valley receives a mean annual rainfall of 1,020 mm distributed bimodally, with peaks in March-May and September-November. Mean annual temperature is 24.2°mathsfC. GHG fluxes showed strong seasonal paterns: N₂O emissions peaked within 7-14 days of each fertiliser application (three splits at 0, 4, and 8 MAP), with the highest single-event flux recorded after the second application in July 2019 (wet season, soil moisture at 65 % water-filled pore space). Soil respiration CO₂ flux was highest during the early vegetative phase (months 2-6) when soil disturbance from land preparation had maximised organic mater exposure, and declined to near-baseline levels by month 12.
Material and Methods
Material and Methods
Material
MD2 pineapple suckers (300-350 g) were planted at 30×60 cm (43,500 plants ha⁻¹). Lime was applied as agricultural dolomite (54 % CaCO₃, 42 % MgCO₃). Biochar was produced from ricehusk feedstock by slow pyrolysis at 450°mathsfC (C content 52 %, H/C molar ratio 0.42, BET surface area 218m²g⁻¹, pH 9.2). GHG fluxes were measured using static chambers (PVC, 25-cm diameter, 15-cm height) connected to a Gasmet DX4040 FTIR gas analyser (Gasmet Technologies, Finland) for simultaneous CO₂, CH₄, and N₂O quantification at 1 ppm resolution. Soil temperature and moisture were logged continuously (Decagon 5TM sensors). The LCA followed ISO 14040/14044 guidelines with a functional unit of 1 tonne of fresh fruit at the farm gate [6] .
Methods
The experiment was a RCBD with three amendment treatments and four blocks on a 0.8-ha reclaimed acid sulfate Vertisol. Treatments were: (i) conventional no soil amendment beyond standard fertiliser (150 kg N, 60 kg P₂O₅, 120 kg K₂Oha⁻¹); (ii) lime 4 t ha⁻¹ dolomite incorporated to 20 cm at planting; (iii) biochar 10 t ha⁻¹ rice-husk biochar incorporated to 20 cm at planting. Each plot measured 15 × 12 m (180 m²) with 4-m bufers. GHG fluxes were measured weekly during months 1-6 and biweekly during months 7-18, with additional daily measurements during the 14-day windows following each of three fertiliser applications. Each measurement involved deploying three chambers per plot for a 30-minute enclosure period, sampling headspace at 0, 10, 20, and 30 min. Fluxes were calculated from the linear increase in gas concentration over time, rejecting non-linear responses (R²<0.90). Cumulative emissions were computed by linear interpolation between measurement dates. The LCA system boundary encompassed all on-farm operations (land preparation, planting, fertilisation, pest management, harvest), fertiliser and amendment manufacture and transport (distanceweighted using Colombian freight data), and machinery fuel consumption. Emission factors for fertiliser manufacture followed ecoinvent v3.8. Soil carbon stock changes (0-30 cm) were assessed from baseline and end-of-cycle soil sampling (five cores per plot, Walkley-Black method). Data were analysed by one-way ANOVA with Tukey HSD at a=0.05
Nutrient budget and input-output analysis
Fertiliser N input totalled 150 kg ha⁻¹ across all treatments. Fruit N removal was 1.7 kg per tonne of fresh fruit; at mean yields of 58.4 : t : ha⁻¹ (conventional), 64.2tan⁻¹ (lime), and 62.8 t ha⁻¹ (biochar), crop N oftake was 99, 109, and 107 kg ha⁻¹ respectively. The apparent N surplus (input minus oftake) was 51 kg ha⁻¹ (conventional), 41 (lime), and 43 (biochar). This surplus represents the pool available for gaseous loss (N₂O, NH₃, N₂) and leaching. The lower surplus under lime and biochar reflects their higher yields rather than reduced inputs, and the emission data confirm that biochar redirected a portion of this surplus toward Nu₂ (via enhanced complete denitrification) rather than mathsfN₂mathsfO
Baseline soil characterisation
The acid sulfate Vertisol had a clay texture (58 % clay, 24 % silt, 18 % sand), pH 3.8, total S 0.92 %, jarosite motles at 35-60 cm, organic C 2.14 %, total N 0.21 %, CEC 28.4 cmol kg⁻¹, and exchangeable Al³⁺ 4.2 cmol kg⁻¹. The soil was reclaimed in 2015 by deep drainage, liming (2 t ha⁻¹), and one cycle of upland rice. By the start of the trial (March 2019), topsoil pH had risen to 4.2 but jarosite persisted in the subsoil, indicating ongoing acid-sulfate potential.
Results
All three GHG species (CO₂, N₂O, CH₄) showed significant treatment efects (p<0.01 for CO₂ and N₂O; p=0.04forCH₄). Biochar reduced cumulative GHG emissions by 39 % relative to the conventional system, while lime reduced them by 21 %. The emission reduction was dominated by the N₂O pathway, where biochar achieved a 48 % cut, and by a modest net carbon sequestration in the biochar treatment (0.42tCha⁻¹ over 18 months) that partly ofset soil respiration losses.
Comprehensive Interpretation
Expressed per tonne of fruit (carbon intensity), the conventional system emited 159 kg CO₂eq t⁻¹, lime 114 kg CO₂-eqt⁻¹, and biochar 90 kg CO₂-eqt⁻¹. Biochar achieved the lowest carbon intensity through a combination of lower absolute emissions and slightly higher yields than the conventional treatment. The carbon-intensity gap between conventional and biochar (69 kg CO₂ -eqt⁻¹) is equivalent to the emissions from transporting one tonne of fruit approximately 420 km by road a non-trivial margin that could influence exportmarket carbon-labelling decisions. [7] Costa Rica Andisol 2009-10 120 Modelled Stoessel et al. (2012) [8] Global
Discussion
The field-measured carbon intensity of 159 kg CO₂-eqt⁻¹ for the conventional acid-sulfate system is substantially higher than the 78-120 kg CO₂-eqt⁻¹ range reported in previous pineapple LCAs from Costa Rica, Thailand, and global meta-analyses [7,8] . The diference is atributable almost entirely to higher N₂O emission factors: the measured N₂O-N loss fraction (2.8 % of applied N) was 2.3× the IPCC Tier 1 default of 1.25 %, consistent with the enhanced denitrification rates observed in waterlogged, iron-rich acid sulfate subsoils where Fe³⁺ serves as an alternative electron acceptor [9] . This finding corroborates the argument by Nguyen [5] that productivity assessments on acid sulfate soils must account for soil-specific constraints that standard methodologies overlook. Biochar's 48 % reduction in N₂O emissions aligns with the meta-analytic estimate of 28-54 % suppression reported by Cayuela et al. [10] for tropical soils, and the mechanism is likely twofold: sorption of NH₄ ⁺ onto biochar surfaces reduces the substrate pool for nitrificationcoupled denitrification, and the alkalinity of rice-husk biochar (pH 9.2) [11] raises soil pH locally, shifting the N₂O / (N₂O+N₂) ratio toward complete denitrification [5] . The net soil carbon gain of 0.42tCha⁻¹ in the biochar treatment over 18 months is modest but consistent with the expected stability of a biochar with H/C ratio 0.42 well below the 0.6 threshold indicative of high recalcitrance [12] . For policy, the practical recommendation is that carbonlabelling schemes for tropical fruit should require soil-typespecific emission factors rather than generic regional averages, and that biochar or equivalent soil-amendment strategies should qualify for climate-smart agriculture incentive payments when applied to acid sulfate terrain under documented emission monitoring protocols.
Conclusion
Conclusion
Acknowledgement
Acknowledgements Institutional supportThe Palmira Institute of Environmental Agricultural Sciences provided the Gasmet FTIR analyser, field infrastructure, and laboratory facilities for soil and gas analysis. Field staf acknowledgementMr. Luis Fernando Gálvez maintained the static chamber network and conducted weekly gas sampling. Ms. Carolina Rincón Zapata managed soil sampling, sample preparation, and Walkley-Black analyses.
Figures and tables from the paper
| Emission Source | Conventional | Lime | Biochar | SE |
|---|---|---|---|---|
| Soil N₂O | 3,530 a | 2,790 b | 1,840 c | 185 |
| Soil CO₂ | 2,590 a | 2,310 ab | 1,980 b | 142 |
| Soil CH₄ | 280 a | 220 ab | 180 b | 22 |
| Fertiliser mfg | 1,620 | 1,620 | 1,620 | |
| Machinery | 860 | 840 | 850 | 18 |
| Lime CO2 release | 560 | |||
| Net soil C change | 400 a | 0 b | -800 c | 95 |
| Total | 9,280 a | 7,340 b | 5,670 c | 312 |
Table text extracted from the original PDF; superscript letters are shown inline. The original table image is below.
View original table image
| Parameter | F-value | p-value | η² | CV (%) |
|---|---|---|---|---|
| Cumulative N₂O | 28.4 | <0.001 | 0.86 | 14.2 |
| Cumulative CO₂ | 8.6 | 0.008 | 0.66 | 18.4 |
| Cumulative CH₄ | 4.8 | 0.038 | 0.52 | 22.1 |
| Total GHG | 32.1 | <0.001 | 0.88 | 11.8 |
| Carbon intensity | 18.7 | <0.001 | 0.81 | 13.6 |
| Fruit yield | 6.2 | 0.018 | 0.58 | 8.4 |
Table text extracted from the original PDF; superscript letters are shown inline. The original table image is below.
View original table image
| Study | Region | Soil Type | Year | Intensity | Notes |
|---|---|---|---|---|---|
| This study (Conv.) | Colombia | Acid sulfate | 2019-20 | 159 | Field-measured |
| This study (Biochar) | Colombia | Acid sulfate | 2019-20 | 90 | Field-measured |
| Ingwersen (2012)[7] | Costa Rica | Andisol | 2009-10 | 120 | Modelled |
| Stoessel et al. (2012)[8] | Global avg | Mixed | 2010 | 95 | Meta-analysis |
| Gheewala et al. (2013) | Thailand | Alluvial | 2011 | 78 | Field + model |
Table text extracted from the original PDF; superscript letters are shown inline. The original table image is below.
View original table image
References
13 in the original paper- Lal R. Soil carbon sequestration impacts on global climate change and food security. Science. 2004;304(5677):16231627.
- Dent DL, Pons LJ. A world perspective on acid sulphate soils. Geoderma. 1995;67(3-4):263-276.
- IPCC. 2019 Refinement to the 2006 IPCC Guidelines for National Greenhouse Gas Inventories. Vol. 4: Agriculture, Forestry and Other Land Use. IPCC. 2019:1-110.
- Agronet. Red de Información y Comunicación del Sector Agropecuario Colombiano. Ministerio de Agricultura. 2021.
- Nguyen TNH. Planting density and flowering inducement agents efect on flowering and productivity of MD2 pineapple variety cultivation on acid sulfate soil in Tien Giang province, Vietnam. South Asian J Agric Sci. 2023;3(1):155-158.
- ISO 14040:2006. Environmental management life cycle assessment principles and framework. International Organization for Standardization. 2006:1-20.
- Ingwersen WW. Life cycle assessment of fresh pineapple from Costa Rica. J Clean Prod. 2012;35:152-163.
- Stoessel F, Juraske R, Pfister S, Hellweg S. Life cycle inventory and carbon and water foodprint of fruits and vegetables: application to a Swiss retailer. Environ Sci Technol. 2012;46(6):3253-3262.
- Bremner JM. Sources of nitrous oxide in soils. Nutr Cycl Agroecosystems. 1997;49(1-3):7-16.
- Cayuela ML, van Zwieten L, Singh BP, Jefery S, Roig A, Sánchez-Monedero MA. Biochar's role in mitigating soil nitrous oxide emissions: a review and meta-analysis. Agric Ecosyst Environ. 2014;191:5-16.
- Spokas KA. Review of the stability of biochar in soils: predictability of O:C molar ratios. Carbon Manag. 2010;1(2):289-303.
- Gheewala SH, Silalertruksa T, Nilsalab P, Mungkung R, Perret SR, Chaiyawannakarn N. Water footprint and impact of water consumption for food, feed, fuel crops production in Thailand. Water. 2014;6(6):1698-1718.
- Smith P, Martino D, Cai Z et al. Greenhouse gas mitigation in agriculture. Philos Trans R Soc Lond B Biol Sci. 2008;363(1492):789-813.