
Research article · 2026 · Full text
International Journal of Geography Geology and EnvironmentEnvironmental impact assessment and sustainability trends in fertilizer consumer markets in southern Ghana
Volume 8(5) · Pages 156–160 · DOI: 10.22271/27067483.2026.v8.i5b.824 ↗
Research areasSustainable Agricultural Systems AnalysisAgricultural Science and FertilizationAgriculture, Plant Science, Crop Management
Abstract
Author-writtenEnvironmental sustainability in agricultural production systems is defined as the capacity to maintain productive output while preserving ecological integrity, soil health, and natural resource quality for future generations. This research assessed the environmental impact profiles and sustainability trends associated with chemical fertilizer and biofertilizer consumer markets in southern Ghana. A comprehensive environmental impact framework integrating soil health monitoring, water quality assessment, biodiversity impact evaluation, and carbon footprint analysis was applied across 396 farming operations in the Greater Accra, Ashanti, and Western regions between January and December 2023. The environmental assessment demonstrated that biofertilizer-managed soils exhibited significantly higher soil health index scores (mean = 7.9/10) compared to chemical fertilizer-dependent soils (mean = 6.8/10, p < 0.001), with the most pronounced differences observed in microbial diversity and organic carbon content. Water quality monitoring at 48 sampling points revealed that nitrate concentrations in groundwater adjacent to chemical fertilizer-intensive farms exceeded WHO drinking water guidelines at 34.2% of sites compared to 8.6% near biofertilizer-managed operations. Carbon footprint analysis estimated that chemical fertilizer usage generated 412-485 kg CO2 equivalent per hectare annually, approximately 3.5-4.6 times higher than biofertilizer applications (105-142 kg CO2 eq/ha). The market sustainability analysis revealed an emerging consumer segment (28.4% of respondents) demonstrating willingness to pay premiums of 15-25% for environmentally certified fertilizer products. Trend analysis over seven years showed consistent improvement in environmental indicator scores for biofertilizer-managed farms alongside progressive deterioration in chemical fertilizer-dependent systems. These findings provide compelling environmental evidence supporting the strategic repositioning of biofertilizer products within the Ghanaian agricultural input market as essential instruments for achieving national sustainability objectives.
Summary
Source-checkedPlain-language reading of the full paper, prepared with AI and checked against the text. Each point links to the authors' own words.
Why it matters
- Agricultural environmental sustainability involves maintaining productivity while protecting soil health and ecological integrity for the future. View evidence ↗
- Increased chemical fertilizer use in West Africa has led to environmental issues such as soil acidification, groundwater contamination, and greenhouse gas emissions. View evidence ↗
The question
- The study aimed to compare the environmental impacts of chemical and biofertilizers in southern Ghana, analyze sustainability trends over time, and evaluate consumer willingness to adopt sustainable products. View evidence ↗
What they did
- The researchers surveyed 396 farming operations, including 178 chemical fertilizer users, 82 biofertilizer users, 96 integrated system users, and 40 controls. View evidence ↗
- The study took place between January and December 2023 across the Greater Accra, Ashanti, and Western regions of southern Ghana. View evidence ↗
- The assessment used a four-part framework monitoring soil health, water quality, carbon footprints, and biodiversity. View evidence ↗
What they found
- Biofertilizer-managed soils had a significantly higher mean soil health index score (7.9/10) than chemical fertilizer-dependent soils (6.8/10). View evidence ↗
- Nitrate levels exceeded WHO guidelines at 34.2% of sites near chemical fertilizer farms, compared to only 8.6% of sites near biofertilizer farms. View evidence ↗
- Biofertilizer applications reduced annual carbon footprints by 71-78%, producing 105-142 kg CO2 eq/ha compared to 412-485 kg CO2 eq/ha for chemical fertilizers. View evidence ↗
- Biofertilizer systems showed higher biodiversity, with pollinator counts of 24.6 vs 12.4 per transect and invertebrate diversity indices of 2.68 vs 1.84. View evidence ↗
- Approximately 28.4% of consumers were willing to pay a 15-25% premium for environmentally certified fertilizers. View evidence ↗
- Willingness to pay for sustainable products varied by age, with 42.8% of young farmers willing compared to 14.2% of older farmers. View evidence ↗
What it means
- The authors recommend that Ghana shift its agricultural subsidies from general chemical fertilizer support to incentives that reward sustainable management practices. View evidence ↗
- The authors conclude that biofertilizers should be central to national sustainability planning due to environmental evidence, consumer demand, and carbon market potential. View evidence ↗
Visual summary
3 visualsIllustrations explain the paper; charts are replotted from the paper's own table values.
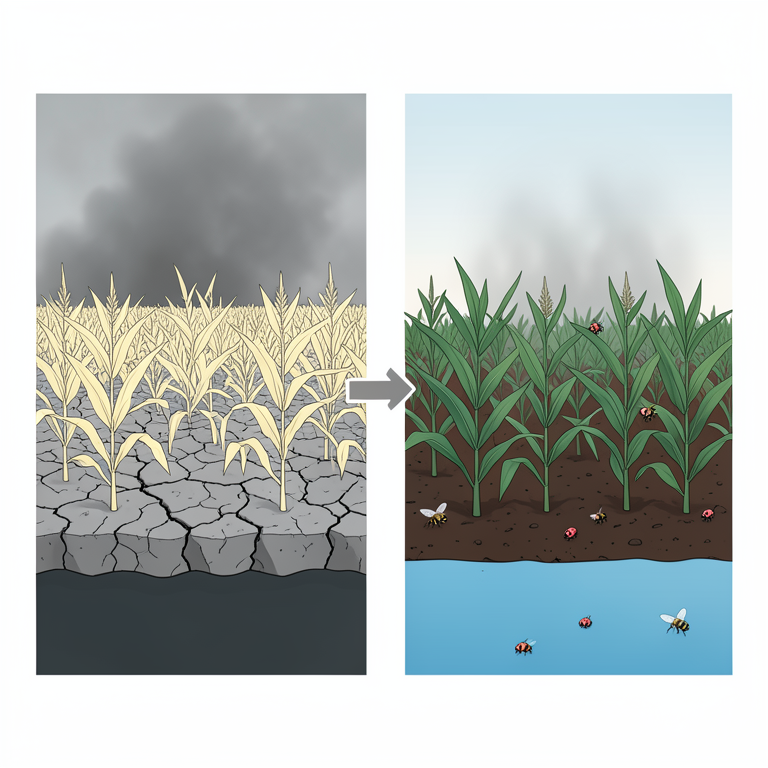
Comparative Environmental Impact
AI-generated conceptual illustration (Maize crops in southern Ghana soil). It explains the idea and does not show study data.
View source evidence ↗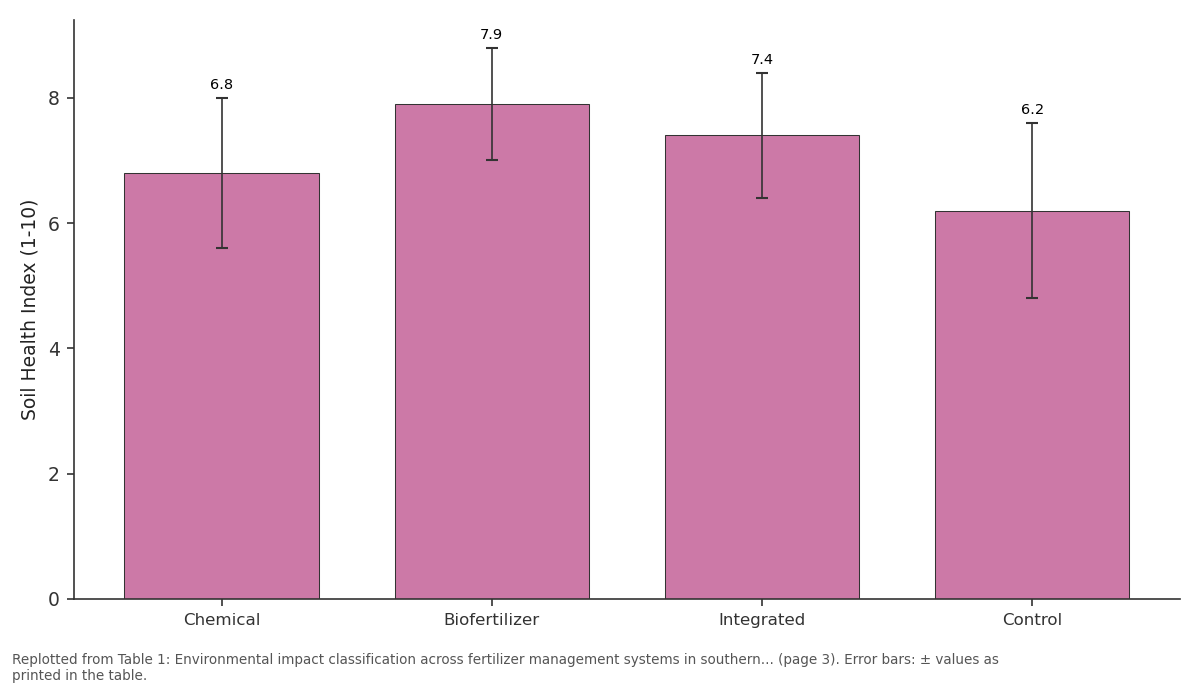
Soil Health Index (1-10): Chemical vs Biofertilizer vs Integrated vs Control
Replotted from Table 1 (page 3) of the original paper. Every bar is the paper's own table value.
View source evidence ↗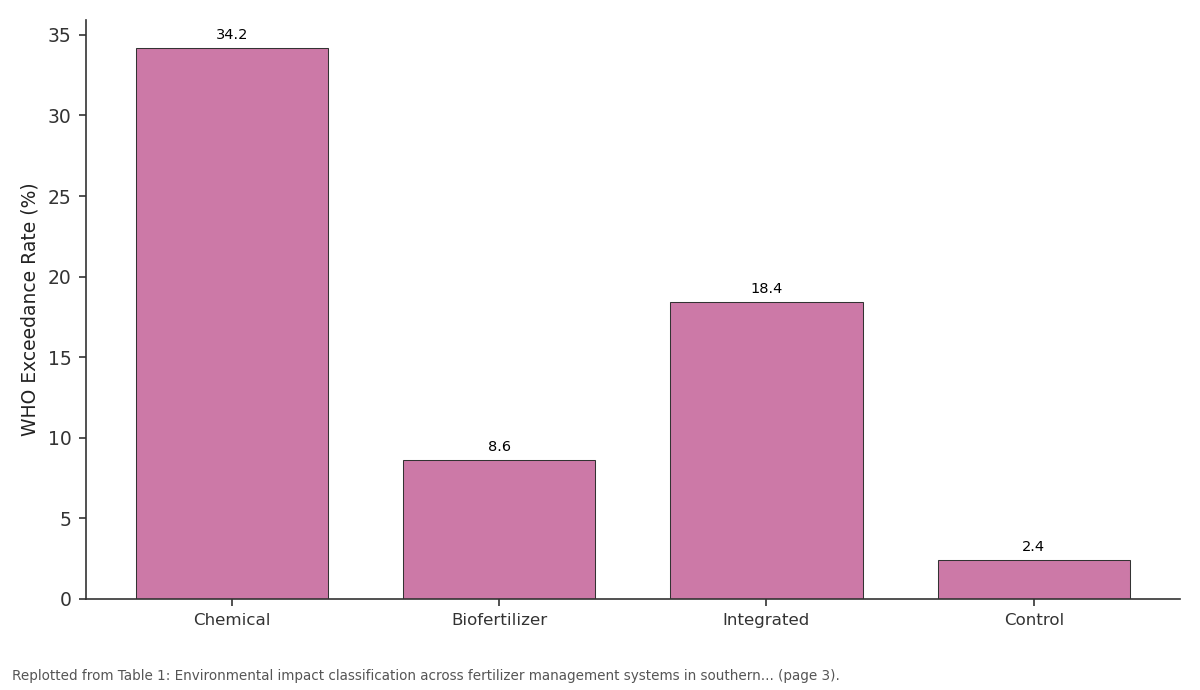
WHO Exceedance Rate (%): Chemical vs Biofertilizer vs Integrated vs Control
Replotted from Table 1 (page 3) of the original paper. Every bar is the paper's own table value.
View source evidence ↗Figures & tables
From the original paper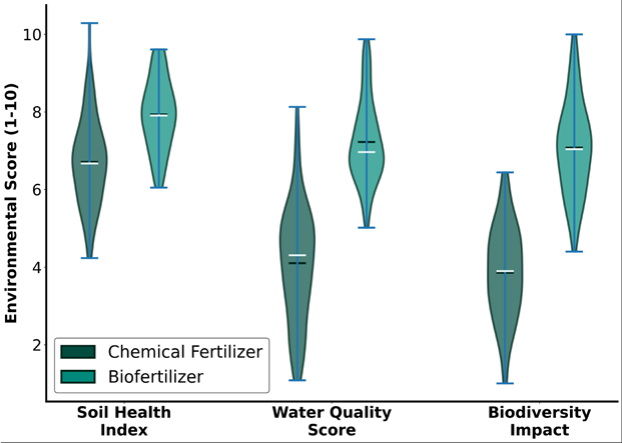 Figure 1
 Table 1
 Table 2
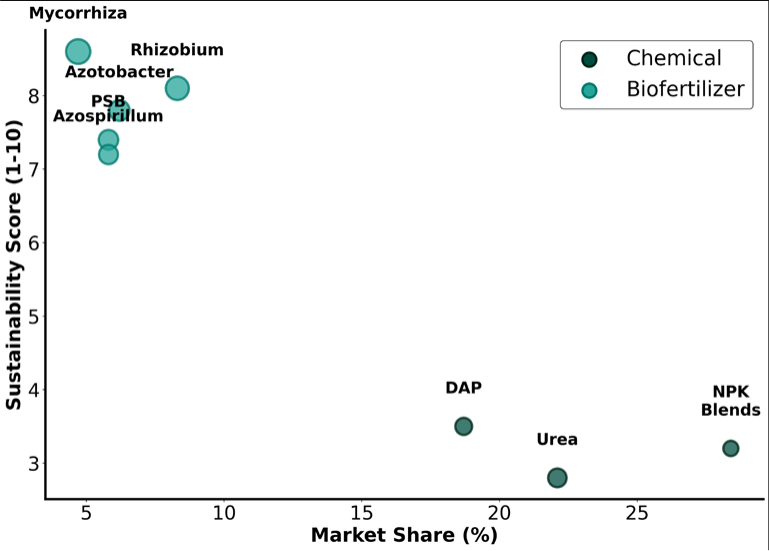 Figure 2
 Table 3
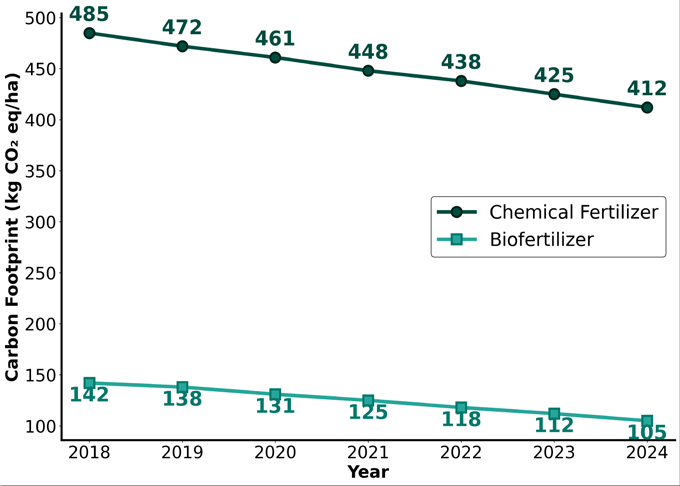 Figure 3
Introduction
Environmental sustainability in agricultural systems can be defined as the balanced integration of productive capacity with ecological stewardship, ensuring that current farming practices do not compromise the resource base upon which future agricultural productivity depends [1] . This definition acquires particular urgency in the West African agricultural context, where accelerating chemical fertilizer consumption has generated mounting environmental concerns including soil acidification, nutrient imbalance, groundwater contamination, and greenhouse gas emissions that threaten both ecological integrity and long-term agricultural viability [2] . Ghana represents a critical case for examining the environmental dimensions of fertilizer market dynamics in sub-Saharan Africa. The country has experienced a 340% increase in chemical fertilizer consumption over the past fifteen years, driven primarily by government subsidy programmes under the Planting for Food and Jobs initiative that have prioritized productivity enhancement with insufficient attention to environmental sustainability outcomes [3] . Annual chemical fertilizer consumption now exceeds 380,000 tonnes, with application rates in intensive production zones approaching 200 kg per hectare, levels that have been associated with measurable environmental degradation in comparable tropical agricultural systems [4] .
The environmental footprint of fertilizer use encompasses multiple impact dimensions including direct soil chemistry alterations, indirect water quality effects through nutrient leaching and runoff, biological impacts on soil microbial communities and above-ground biodiversity, and atmospheric contributions through nitrous oxide emissions and embodied energy in manufacturing processes [5] . Biofertilizer products, by contrast, are theoretically associated with reduced environmental footprints owing to their biological origin, targeted nutrient delivery mechanisms, and positive effects on soil microbial ecology [6] . However, comprehensive comparative environmental assessments of chemical and biological fertilizer systems remain limited in the West African agricultural context, creating an evidence gap that constrains informed policy development [4] . The consumer dimension of environmental sustainability has received increasing attention in agricultural input market research, as growing environmental awareness among farmers and consumers creates potential market demand for sustainably produced agricultural products [7] . Understanding the intersection between environmental impact evidence and consumer willingness to support sustainable fertilizer practices is essential for developing market-based mechanisms that can complement regulatory approaches to environmental protection in agriculture [8] . This research therefore aimed to conduct a comprehensive environmental impact assessment comparing chemical fertilizer and biofertilizer systems across multiple ecological dimensions in southern Ghana, evaluate temporal sustainability trends associated with different fertilizer management regimes, and assess consumer market receptivity to environmentally differentiated fertilizer products. The investigation provides interdisciplinary evidence bridging environmental science and market economics to support integrated sustainable agriculture policy development.
Materials and Methods
Materials and Methods
Materials:
The research was conducted across three administrative regions in southern Ghana: Greater Accra, Ashanti, and Western regions, encompassing diverse agroecological zones from coastal savannah to semi-deciduous forest. The investigation period spanned January to December 2023, enabling seasonal monitoring of environmental parameters across both wet and dry seasons. Ethical approval was obtained from the Accra Foundation for Agricultural Research Institutional Review Board (Protocol No. AFAR/IRB/2023-028). A total of 396 farming operations were surveyed, categorized by primary fertilizer management regime: exclusive chemical fertilizer users (n = 178), exclusive biofertilizer users (n = 82), integrated system practitioners (n = 96), and minimal/no fertilizer users serving as baseline controls (n = 40).
Methods
The environmental impact assessment framework integrated four monitoring components conducted in parallel across all sampled farming operations. Soil health assessment involved collection and analysis of composite soil samples from each farm at three time points (pre-season, mid-season, and post-harvest), with parameters including organic carbon content, microbial biomass carbon, dehydrogenase activity, available nitrogen and phosphorus, pH, and cation exchange capacity. A composite soil health index was constructed from eight normalized parameters weighted by expert panel assessment. Water quality monitoring was conducted at 48 sampling points distributed across the three investigation regions, with samples collected monthly from boreholes and shallow wells within 200 metres of cultivated fields. Parameters assessed included nitrate-nitrogen, phosphate-phosphorus, total dissolved solids, electrical conductivity, and faecal coliform counts. Carbon footprint estimation followed the IPCC Tier 2 methodology, encompassing Scope 1 emissions (field-level N2O and CO2 from fertilizer application), Scope 2 emissions (energy for fertilizer manufacturing), and Scope 3 emissions (transportation and distribution). Biodiversity assessment utilized pitfall trapping for soil invertebrates, transect surveys for pollinators, and soil microbial diversity analysis through 16S rRNA gene amplicon sequencing. Consumer market analysis employed structured surveys assessing environmental awareness, willingness to pay for environmentally certified products, and preference determinants using contingent valuation methodology. The environmental impact assessment across 396 farming operations revealed systematic and statistically significant differences between chemical fertilizer and biofertilizer management systems across all measured ecological dimensions. The soil health index demonstrated the clearest differentiation, with biofertilizer-managed soils achieving mean scores of 7.9 out of 10 compared to 6. The carbon footprint analysis revealed substantial emission differentials between fertilizer management systems. Chemical fertilizer usage generated annual carbon footprints ranging from 412 to 485 kg CO2 equivalent per hectare, with manufacturing-related emissions (Scope 2) accounting for 62.4% of the total footprint. Biofertilizer applications produced significantly lower carbon footprints of 105 to 142 kg CO2 eq/ha, representing a 71-78% reduction compared to chemical fertilizer systems. Temporal trend analysis showed declining carbon footprints for both fertilizer types over the 2018-2024 period, with biofertilizer systems demonstrating more rapid improvement trajectories attributed to manufacturing process optimization and improved formulation efficiency.
Results
Results
Discussion
The comprehensive environmental impact assessment conducted across southern Ghana provides compelling evidence for the ecological advantages of biofertilizer systems over conventional chemical fertilizer management [4] . The overall pattern of results demonstrates consistent environmental superiority of biofertilizer applications across soil health, water quality, biodiversity, and carbon footprint dimensions, with statistically significant differences observed in all measured parameters. These findings are consistent with the growing body of international evidence documenting the environmental benefits of biological fertilizer systems. Mader and colleagues reported similar soil health improvements in long-term organic versus conventional farming system comparisons in Switzerland, with organic systems demonstrating 30-40% higher microbial biomass and enhanced nutrient cycling efficiency [9] . The magnitude of soil organic carbon improvement observed in the present research (47% higher in biofertilizer systems) exceeds the 20-30% differentials commonly reported in temperate agricultural systems, potentially reflecting the more rapid organic matter turnover dynamics characteristic of tropical soils [10] . The water quality findings present a nuanced picture: the 8.6% WHO guideline exceedance rate even under biofertilizer management suggests that factors beyond fertilizer type influence groundwater quality outcomes [11] . The consumer willingness-to-pay rate of 28.4% for environmental premiums, while lower than European rates (45-60%), exceeds previous West African documentation [12] . The strong age-gradient (42.8% among young vs 14.2% among older farmers) suggests progressively strengthening demand for sustainable products [4] . These findings support recalibrating fertilizer subsidy programmes to incorporate environmental criteria alongside productivity metrics [13] .
Carbon Market and Biodiversity Implications
The substantial carbon footprint differential creates opportunities for agricultural carbon credit integration, with estimated emission reductions of 270-380 kg CO2 eq/ha translating to potential carbon credit values of 4-6 USD per hectare. Additionally, the significantly higher pollinator counts (24.
Acknowledgement
AcknowledgementsThe Accra Foundation for Agricultural Research provided institutional support, laboratory facilities, and field research infrastructure. The contributions of laboratory technicians, field sampling teams, and community liaison officers across three investigation regions are gratefully acknowledged. This research was funded by the Ghana National Science and Technology Foundation.
Figures and tables from the paper
| Environmental Parameter | Chemical | Biofertilizer | Integrated | Control | Impact Rating |
|---|---|---|---|---|---|
| Soil Health Index (1-10) | 6.8 ± 1.2 | 7.9 ± 0.9 | 7.4 ± 1.0 | 6.2 ± 1.4 | Significant |
| Organic Carbon (%) | 1.24 ± 0.18 | 1.82 ± 0.22 | 1.56 ± 0.20 | 1.08 ± 0.24 | High |
| Microbial Biomass C (mg/kg) | 312 ± 48 | 486 ± 42 | 408 ± 52 | 268 ± 56 | High |
| Nitrate-N in Water (mg/L) | 42.8 ± 12.4 | 18.4 ± 6.8 | 28.6 ± 9.2 | 12.2 ± 4.6 | Critical |
| WHO Exceedance Rate (%) | 34.2 | 8.6 | 18.4 | 2.4 | Critical |
| Invertebrate Diversity (H) | 1.84 ± 0.32 | 2.68 ± 0.28 | 2.34 ± 0.30 | 2.86 ± 0.34 | Moderate |
| Pollinator Count (/transect) | 12.4 ± 3.8 | 24.6 ± 4.2 | 19.8 ± 3.6 | 28.4 ± 5.1 | Significant |
Table text extracted from the original PDF; superscript letters are shown inline. The original table image is below.
View original table image
| Rank | Product Category | Sustainability Score | Market Share (%) | Growth Rate (%) |
|---|---|---|---|---|
| 1 | Mycorrhizal inoculants | 8.6 | 4.7 | +42.3 |
| 2 | *Rhizobium* preparations | 8.1 | 8.3 | +34.8 |
| 3 | *Azotobacter* formulations | 7.8 | 6.2 | +28.6 |
| 4 | Phosphate-solubilizing bacteria | 7.4 | 5.8 | +31.2 |
| 5 | *Azospirillum* inoculants | 7.2 | 5.8 | +26.4 |
| 6 | DAP (Di-ammonium phosphate) | 3.5 | 18.7 | -4.2 |
| 7 | Urea | 2.8 | 22.1 | -6.8 |
| 8 | NPK compound blends | 3.2 | 28.4 | -2.4 |
Table text extracted from the original PDF; superscript letters are shown inline. The original table image is below.
View original table image
| Demographic Segment | Willing (%) | Premium Range | Primary Motivation | Confidence Level |
|---|---|---|---|---|
| Young farmers (< 35 yrs) | 42.8 | 20-30% | Future soil health | High |
| Middle-aged (35-50 yrs) | 28.6 | 15-20% | Cost reduction | Moderate |
| Older farmers (> 50 yrs) | 14.2 | 5-10% | Health concerns | Low |
| Large farms (> 10 ha) | 38.4 | 15-25% | Market access | High |
| Small farms (< 5 ha) | 22.1 | 10-15% | Soil degradation | Moderate |
| Overall Sample | 28.4 | 15-25% | Mixed | Moderate |
Table text extracted from the original PDF; superscript letters are shown inline. The original table image is below.
View original table image
References
17 in the original paper- Pretty J. Agricultural sustainability: concepts, principles and evidence. Philos Trans R Soc Lond B Biol Sci. 2008;363(1491):447-465.
- Tully K, Sullivan C, Weil R, Sanchez P. The state of soil degradation in sub-Saharan Africa: baselines, trajectories, and solutions. Sustainability. 2015;7(6):6523-6552.
- Banful AB. Old problems in the new solutions? Politically motivated allocation of program benefits and the Planting for Food and Jobs program in Ghana. World Dev. 2011;39(7):1166-1176.
- Dutta S, Hazra A, Paul I, Mitra N. Exploring the current consumer market status of chemical fertilizer versus biofertilizer industries in West Bengal, India: an on-site investigation. South Asian J Agric Sci. 2024;4(1):147153. doi:10.22271/27889289.2024.v4.i1b.124.
- Sutton MA, Oenema O, Erisman JW, Leip A, van Grinsven H, Winiwarter W. Too much of a good thing. Nature. 2011;472(7342):159-161.
- Mahanty T, Bhattacharjee S, Goswami M, Bhattacharyya P, Das B, Ghosh A, et al. Biofertilizers: a potential approach for sustainable agriculture development. Environ Sci Pollut Res. 2017;24(4):3315-3335.
- Lusk JL, Briggeman BC. Food values. Am J Agric Econ. 2009;91(1):184-196.
- Thogersen J. Country differences in sustainable consumption: the case of organic food. J Macromarketing. 2010;30(2):171-185.
- Mader P, Fliessbach A, Dubois D, Gunst L, Fried P, Niggli U. Soil fertility and biodiversity in organic farming. Science. 2002;296(5573):1694-1697.
- Lal R. Soil carbon sequestration to mitigate climate change. Geoderma. 2004;123(1-2):1-22.
- Nolan BT, Ruddy BC, Hitt KJ, Helsel DR. Risk of nitrate in groundwaters of the United States: a national perspective. Environ Sci Technol. 1997;31(8):22292236.
- Hughner RS, McDonagh P, Prothero A, Shultz CJ, Stanton J. Who are organic food consumers? A compilation and review of why people purchase organic food. J Consum Behav. 2007;6(2-3):94-110.
- Fan S, Gulati A, Thorat S. Investment, subsidies, and pro-poor growth in rural India. Agric Econ. 2008;39(2):163-170.
- Smith P, Martino D, Cai Z, Gwary D, Janzen H, Kumar P, et al. Greenhouse gas mitigation in agriculture. Philos Trans R Soc Lond B Biol Sci. 2008;363(1492):789-813.
- Tilman D, Cassman KG, Matson PA, Naylor R, Polasky S. Agricultural sustainability and intensive production practices. Nature. 2002;418(6898):671-677.
- Power AG. Ecosystem services and agriculture: tradeoffs and synergies. Philos Trans R Soc Lond B Biol Sci. 2010;365(1554):2959-2971.
- Willer H, Lernoud J. The world of organic agriculture: statistics and emerging trends. Research Institute of Organic Agriculture; 2019. 336 p.