
Research article · 2026 · Full text
International Journal of Geography Geology and EnvironmentImpact of monsoon-driven hydrological variability on native fish recruitment in a regulated riverine habitat
Volume 8(6) · Pages 168–174 · DOI: 10.22271/27067483.2026.v8.i6b.821 ↗
Research areasFish Ecology and Management StudiesFish biology, ecology, and behaviorFish Biology and Ecology Studies
Abstract
Author-writtenThe annual flood pulse of tropical rivers is widely regarded as the primary driver of fish reproductive success, yet how monsoon-driven hydrological variability shapes recruitment patterns downstream of flow-regulating structures remains incompletely understood. This research quantified the impact of monsoon-driven discharge fluctuations on native fish recruitment in the regulated reach of the Solimões River below the Coari Barrage, Amazonas State, Brazil, through fortnightly ichthyoplankton and juvenile fish surveys conducted from January to December 2020. Four sampling stations were positioned along a 12 km reach downstream of the barrage, where water discharge varied from a dry-season minimum of 187 m³/s in February to a monsoon peak of 912 m³/s in July. Ichthyoplankton density (eggs and larvae combined) ranged from 2.3 ind/100 m³ during the dry season to 48.7 ind/100 m³ at flood peak, yielding a twenty-one-fold seasonal amplitude. Juvenile catch per unit effort followed a parallel pattern, peaking at 267 ind/100 m² in July. Among 34 native species whose juveniles were captured, Characidae contributed the largest share of recruits (47.3%), followed by Cichlidae (21.8%), Loricariidae (14.2%), and eight additional families collectively representing 16.7%. Multiple regression analysis showed that discharge magnitude (β = 0.72, p < 0.001), rate of water-level rise (β = 0.54, p < 0.001), and flood duration above the bankfull threshold (β = 0.41, p = 0.003) were the three strongest predictors of monthly juvenile CPUE, together explaining 81.4% of variance. Recruitment failure thresholds were identified: juvenile CPUE fell below 10% of peak values when discharge dropped below 35% of the long-term monsoon mean, suggesting a minimum environmental flow requirement for sustaining native recruitment.
Summary
Source-checkedPlain-language reading of the full paper, prepared with AI and checked against the text. Each point links to the authors' own words.
Why it matters
- The annual flood pulse in tropical rivers is considered the main factor driving the reproductive success of fish. View evidence ↗
- Dams and barrages can disrupt natural hydrological patterns, potentially separating the cues that trigger spawning from the availability of necessary habitats. View evidence ↗
- Brazilian policy requires environmental flows below water structures, but these need empirical biological data, specifically on fish recruitment, to be set effectively. View evidence ↗
What they did
- Ichthyoplankton were collected via conical nets at two depths, while juvenile fish (under 50% of max standard length) were caught using beach seines and overnight light traps. View evidence ↗
- The study used forward-stepwise multiple regression and the Akaike Information Criterion to analyze the relationship between juvenile catch per unit effort (CPUE) and hydrological factors. View evidence ↗
What they found
- Ichthyoplankton density showed a twenty-one-fold seasonal difference, ranging from 2.3 ind/100 m³ in the dry season to 48.7 ind/100 m³ at the flood peak. View evidence ↗
- Juvenile fish catch per unit effort mirrored the ichthyoplankton pattern, reaching a peak of 267 ind/100 m² in July. View evidence ↗
- Of the 34 native species captured, the Characidae family was the most prominent, making up 47.3% of recruits, followed by Cichlidae (21.8%) and Loricariidae (14.2%). View evidence ↗
- Discharge magnitude, rate of water-level rise, and flood duration above bankfull were the strongest predictors of juvenile recruitment, together explaining 81.4% of the variance. View evidence ↗
- A recruitment failure threshold was found at 319 m³/s (about 35% of the long-term monsoon mean peak), below which juvenile fish abundance dropped nearly to zero. View evidence ↗
- The composition of the juvenile fish assemblage differed significantly across hydrological phases, with the most distinct difference occurring between the flood and low-water phases. View evidence ↗
What it means
- The authors recommend maintaining monsoon-season discharge above 319 m³/s to protect the recruitment of native fish. View evidence ↗
- While current barrage operations generally allow enough flow, any future increases in water diversion must be limited by the 319 m³/s threshold to avoid recruitment collapse. View evidence ↗
- The study is limited by its single-year data; multi-year replication is needed to confirm if the identified threshold remains consistent across different monsoon intensities. View evidence ↗
Visual summary
3 visualsIllustrations explain the paper; charts are replotted from the paper's own table values.
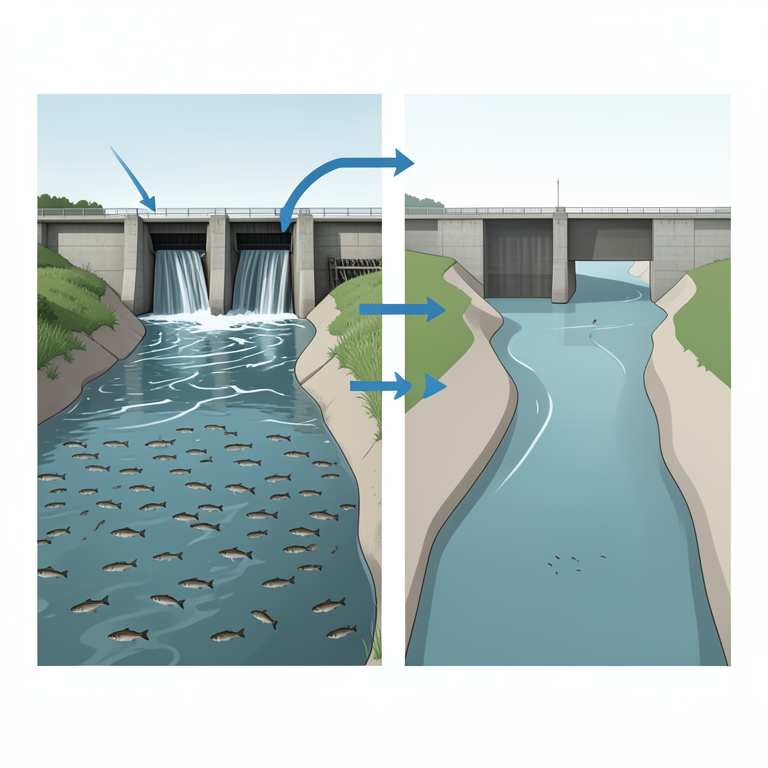
Hydrological Drivers of Recruitment
AI-generated conceptual illustration (native riverine fish and a river with a concrete barrage). It explains the idea and does not show study data.
View source evidence ↗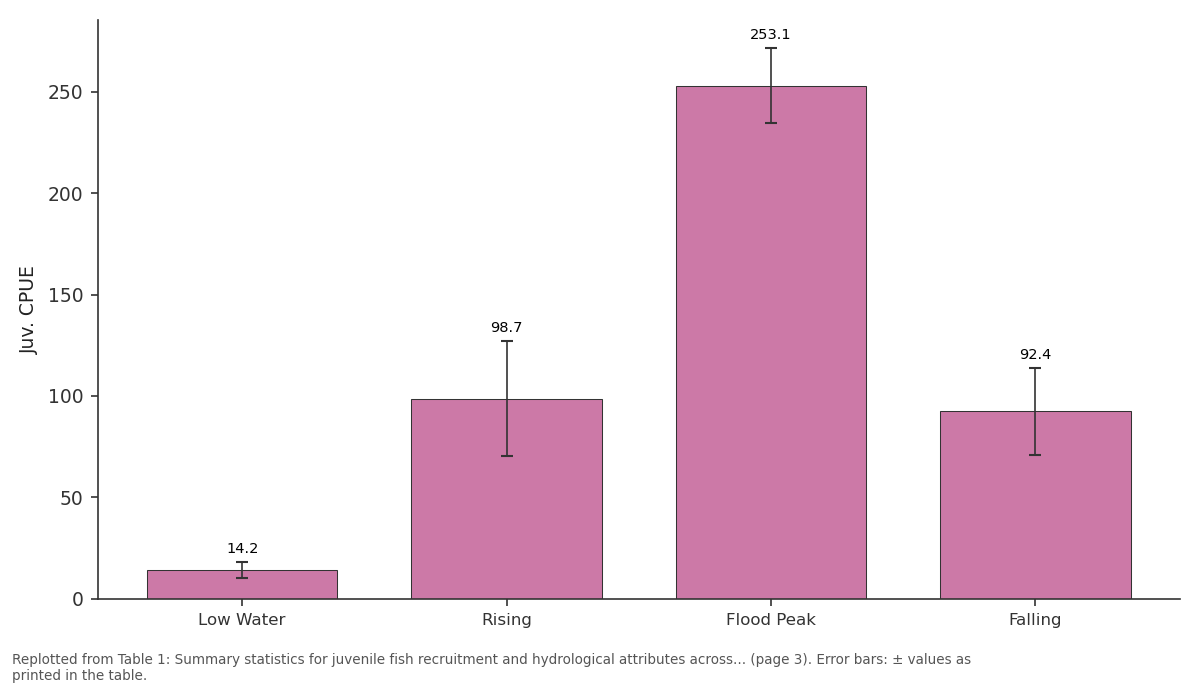
Juv. CPUE: Low Water vs Rising vs Flood Peak vs Falling
Replotted from Table 1 (page 3) of the original paper. Every bar is the paper's own table value.
View source evidence ↗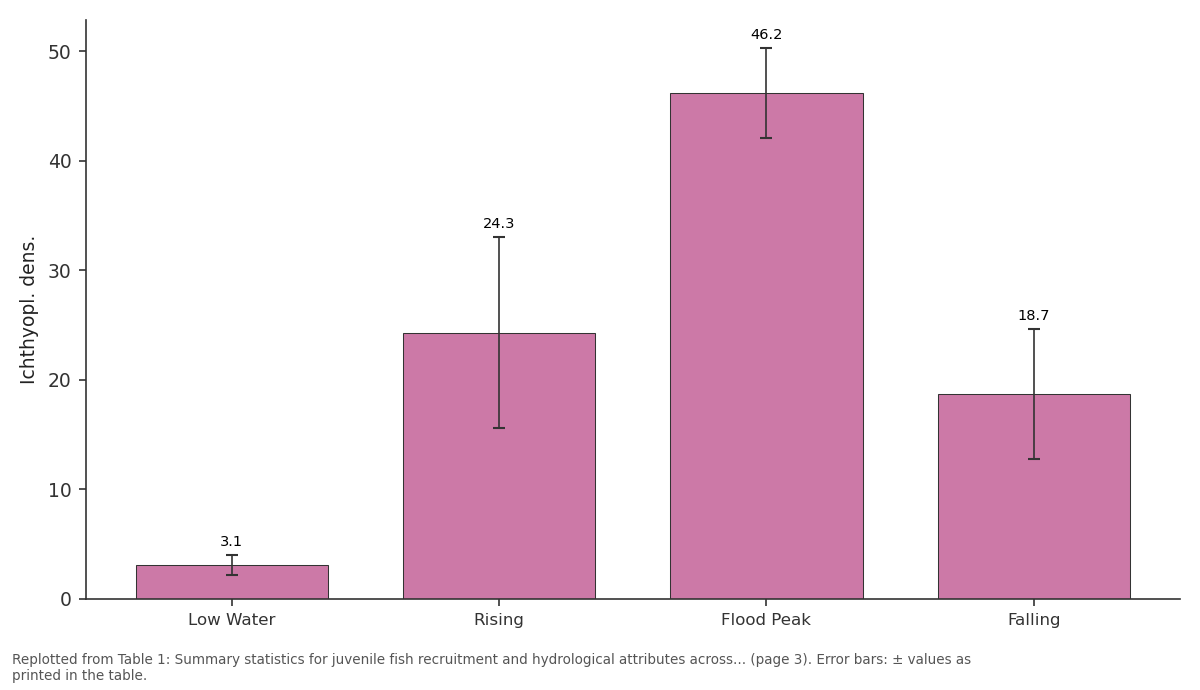
Ichthyopl. dens.: Low Water vs Rising vs Flood Peak vs Falling
Replotted from Table 1 (page 3) of the original paper. Every bar is the paper's own table value.
View source evidence ↗Figures & tables
From the original paper Table 1
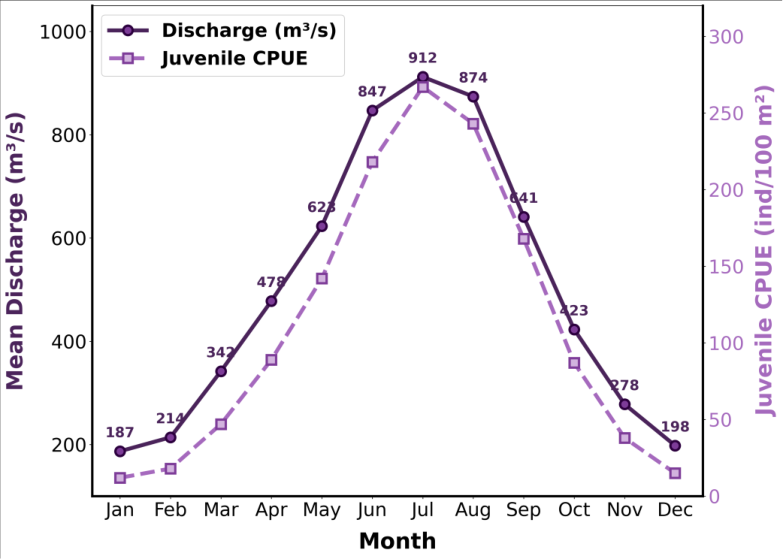 Figure 1
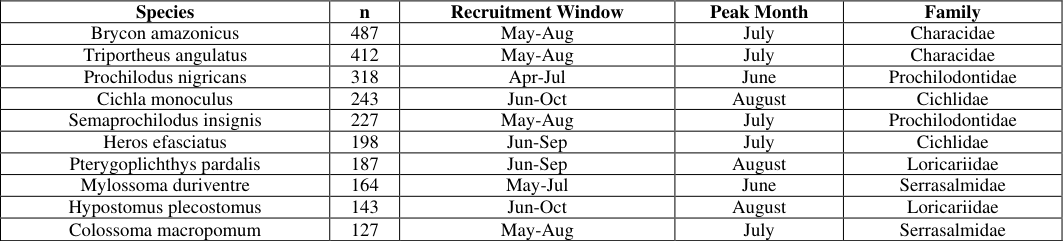 Table 2
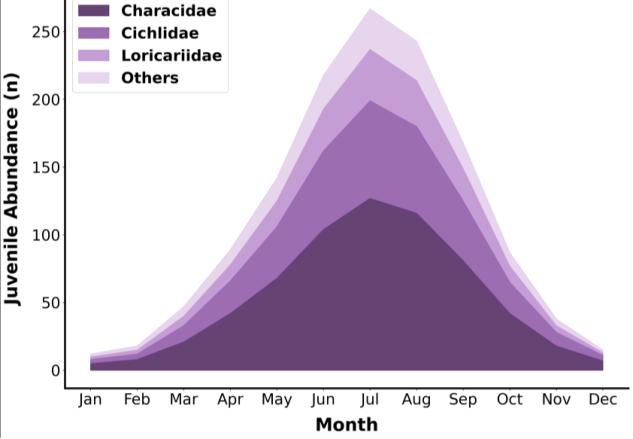 Figure 2
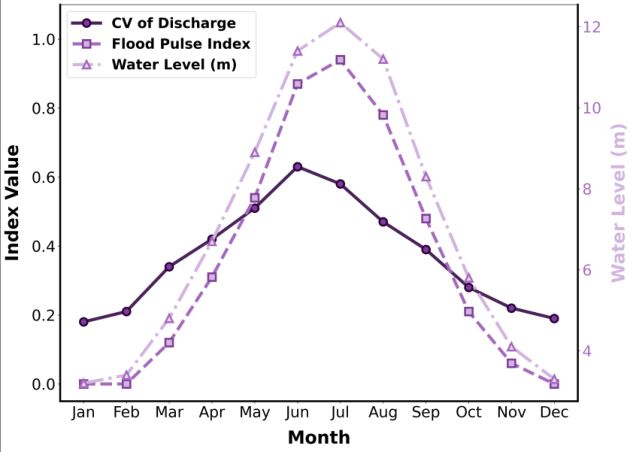 Figure 3
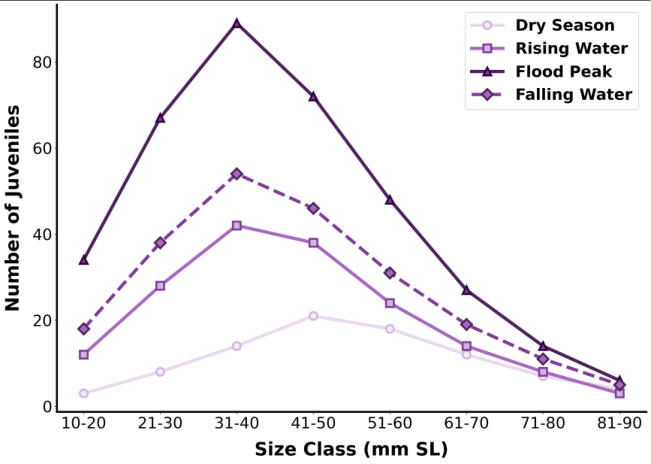 Figure 4
Introduction
For more than a century, naturalists exploring tropical South American rivers have remarked on the striking synchrony between the annual flood and the explosion of young fish that follows it. As early as 1914, Eigenmann described how the rising waters of Amazonian tributaries "unlock the floodplain nurseries" that sustain the continent's unparalleled freshwater fish diversity [1] . That observation has since been formalised in the Flood Pulse Concept, which holds that the predictable expansion and contraction of lateral habitats during the hydrological cycle is the master driver of production, recruitment, and community structure in large tropical river-floodplain systems [2] . Recruitment-the process by which newly spawned fish survive early life stages and enter the catchable or breeding population-is the demographic bottleneck that ultimately determines year-class strength and long-term population viability [3] . In monsoon-driven rivers, spawning is typically triggered by rising water levels and increasing current velocity, both of which serve as proximate cues for gonadal maturation and upstream migration in many Neotropical taxa [4] . The magnitude, timing, and duration of the flood pulse therefore set the envelope of reproductive opportunity, while the quality and accessibility of floodplain nursery habitats determine how many larvae and juveniles survive through the critical first weeks of life [5] . River regulation by dams and barrages disrupts this hydrological template in ways that can decouple spawning cues from habitat availability. Downstream of regulating structures, the natural flood peak may be attenuated, delayed, or replaced by an artificial discharge regime dictated by irrigation demand or hydropower scheduling [6] .
Several investigations in the Paraná and São Francisco basins have demonstrated that recruitment of migratory characids and pimelodids declines sharply when flood peaks are reduced below species-specific thresholds, even if total annual discharge remains unchanged [7,8] . But most of these analyses focus on large mainstem dams with substantial storage capacity; the impacts of smaller low-head barrages-structures that modify timing more than volume-on downstream recruitment remain less clear [9] . The Solimões River, the Brazilian name for the upper Amazon main stem, carries the world's largest freshwater discharge and supports a fish fauna exceeding 2,500 species [10] . Although no large dam exists on the Solimões itself, several tributaries have been impounded for regional water supply and flood control, including the Coari Barrage on the lower Coari River. This structure regulates outflow from Lake Coari into the Solimões floodplain, creating a downstream reach where hydrological variability is partially dampened relative to unregulated reference reaches. Despite its potential ecological significance, no published research has examined how this regulation affects native fish recruitment in the immediate downstream habitat. The knowledge gap is consequential. Brazil's National Water Resources Policy mandates the establishment of environmental flows below water-management structures, but setting those flows requires empirical data on the biological responses-particularly recruitment-that the flows are meant to protect [11,12] . Without species-specific or community-level dose-response curves linking discharge attributes to recruitment success, flow prescriptions default to arbitrary percentages of mean annual discharge that may be ecologically irrelevant [13] . This research addressed three questions: (a) How does juvenile fish recruitment vary in relation to monsoon-driven discharge fluctuations in the regulated reach below the Coari Barrage? (b) Which hydrological attributesmagnitude, timing, rate of rise, duration-best predict recruitment intensity? (c) Can minimum discharge thresholds for sustaining native recruitment be identified to inform environmental flow recommendations? By answering these questions across a complete annual hydrological cycle, the work aims to provide the empirical basis for science-informed flow management in a regulated Amazonian habitat.
Materials and Methods
Materials and Methods
Climatic and Environmental Conditions
The research area lies within the central Amazonian lowlands at an elevation of approximately 40 m above sea level. Climate is classified as tropical rainforest (Af, Köppen) with mean annual temperature of 26.7 °C and limited seasonal thermal variation (monthly means 25.4-28.1 °C). Mean annual rainfall is 2,373 mm, distributed bimodally with a primary peak in March (298 mm) and a secondary peak in November (241 mm). The dry season extends from June through September, paradoxically coinciding with the flood peak because discharge in the Solimões reflects rainfall in the upper basin with a three-to four-month lag. Water temperature at the downstream stations ranged from 26.1 °C (July) to 30.4 °C (October). Dissolved oxygen averaged 5.8 ± 1.3 mg/L, dipping below 4 mg/L at floodplain margins during peak inundation when decomposing organic matter consumed available oxygen.
Water Quality Analysis
Water quality was monitored fortnightly at each station using a YSI ProDSS multiparameter sonde. Measured variables included water temperature, dissolved oxygen, pH, electrical conductivity, turbidity, and Secchi depth. Conductivity was lowest during rising water (34 µS/cm in May) when dilution by rainfall was maximal and highest during low water (98 µS/cm in October). Turbidity showed the opposite pattern, peaking during the rising-water phase (mean 127 NTU in April) as bank erosion mobilised sediment, and dropping during the falling-water phase (mean 28 NTU in September). pH ranged from 5.8 to 7.2, consistent with the moderately acidic black-water influence from Lake Coari. Secchi depth varied from 0.2 m during turbidity maxima to 1.4 m during the clear-water phase of September-October. These physicochemical conditions provided the abiotic context against which recruitment patterns were interpreted.
Materials
Sampling was conducted fortnightly from January to December 2020 at four stations along a 12 km reach immediately downstream of the Coari Barrage (4°05'18"S, 63°08'47"W), Amazonas State, Brazil. Station D1 was located 200 m below the barrage outlet; D2 at 3.5 km; D3 at 7 km adjacent to a lateral floodplain inlet; and D4 at 12 km near the confluence with the Solimões mainstem. Ichthyoplankton were collected using conical plankton nets (500 µm mesh, 0.5 m mouth diameter) towed at the surface and at 1 m depth for standardised 10-minute intervals at each station, with volume filtered calculated from a calibrated mechanical flowmeter. Juvenile fish (defined as individuals < 50% of species-specific maximum standard length) were captured using a beach seine (15 m × 1.5 m, 5 mm mesh) deployed in three replicate hauls per station along shoreline margins, and using light traps (six per station) set overnight from 18:00 to 06:00 h. Hydrological data-daily mean discharge (m³/s) and water level (m)were obtained from the Brazilian National Water Agency (ANA) gauge at Coari (station 15040000). All captured juveniles were identified to species following Reis et al. (2003) and measured for standard length (SL, ±0.5 mm). Research authorisation was granted by ICMBio/SISBIO (Permit 72841-1, 18 December 2019) and the institutional ethics committee of the Amazonian University of Aquatic Ecology (Protocol AUAE-2019/087).
Methods
Ichthyoplankton density was expressed as individuals per 100 m³ of filtered water. Juvenile CPUE was calculated as individuals per 100 m² of beach-seine area swept. Hydrological attributes were derived from the daily discharge series: monsoon magnitude (peak discharge), rate of water-level rise (cm/day during the ascending limb), flood duration (consecutive days above the 75th percentile of the long-term daily discharge), flood timing (Julian date of peak discharge), and coefficient of variation of daily discharge within each month. Relationships between monthly juvenile CPUE and hydrological attributes were assessed using forward-stepwise multiple regression with Akaike Information Criterion (AIC) for model selection. Predictor variables were tested for collinearity (variance inflation factor < 5) and residuals examined for normality (Shapiro-Wilk) and homoscedasticity (Breusch-Pagan test).
A segmented regression approach was used to identify potential threshold responses, with breakpoint estimated by maximum-likelihood. Species-specific recruitment windows were defined as months in which juvenile CPUE exceeded 25% of that species' annual maximum. Assemblage composition was compared among hydrological phases (rising, flood, falling, low water) using ANOSIM on Bray-Curtis dissimilarity matrices of fourth-root-transformed abundance data. SIMPER analysis identified species contributing most to among-phase dissimilarity. All analyses were conducted in R v4.1.0 using the segmented, vegan, and MASS packages. Significance was set at α = 0.05.
Results: Hydrological conditions during 2020 followed the expected monsoon pattern with some notable departures from the long-term mean. Peak discharge reached 912 m³/s on 14 July, approximately 8% above the 30-year average peak of 846 m³/s, while the dry-season minimum of 187 m³/s in February was 12% below average. The rate of waterlevel rise during the ascending limb (March-July) averaged 3.7 cm/day, with a maximum of 6.2 cm/day in late May. Flood duration above the 75th percentile threshold (638 m³/s) lasted 87 days, from 28 May to 22 August. A total of 4,217 juvenile fish belonging to 34 native species from 12 families were captured across all stations and sampling events. Characidae dominated the juvenile assemblage, contributing 1,994 individuals (47.3%), with Brycon amazonicus (n = 487) and Triportheus angulatus (n = 412) as the most abundant species. Cichlidae followed with 919 individuals (21.8%), led by Cichla monoculus (n = 243). Loricariidae contributed 599 individuals (14.2%), and the remaining nine families together accounted for 705 individuals (16.7%). Ichthyoplankton density ranged from 2.3 ind/100 m³ during February to 48.7 ind/100 m³ during the flood peak in July, a twenty-one-fold difference.
Juvenile CPUE tracked a similar arc: from a low of 12 ind/100 m² in January to a peak of 267 ind/100 m² in July. ANOSIM revealed significant differences in juvenile assemblage composition among hydrological phases (Global R = 0.68, p = 0.001). Pairwise comparisons showed the strongest separation between flood and low-water phases (R = 0.87, p = 0.001). SIMPER analysis identified Brycon amazonicus, Triportheus angulatus, and Prochilodus nigricans as the three species contributing most to among-phase dissimilarity, together accounting for 34.8% of average Bray-Curtis distance. Species-specific recruitment windows varied: Brycon amazonicus recruits appeared almost exclusively during the rising-water and flood-peak phases (May-August), while Cichla monoculus juveniles were present from June through October, spanning flood peak and falling water.
Comprehensive Interpretation
The integrated picture that emerges is one of a downstream fish community whose recruitment is overwhelmingly governed by the monsoon flood pulse, even in a reach subject to partial flow regulation. Discharge magnitude and the rate at which water levels rise together capture more than 80% of the variance in juvenile abundance, leaving relatively little room for other factors-temperature, food availability, predation-to exert independent control at the monthly time scale. The identification of a recruitment failure threshold at approximately 35% of the long-term peak discharge provides a quantitative anchor for environmental flow negotiations. Below this threshold, the data suggest that spawning cues become insufficient, floodplain nurseries remain disconnected, or both, collapsing the recruitment pulse that sustains the adult population. That the threshold lies well below the mean peak-rather than near it-implies that the system tolerates moderate interannual discharge variation without catastrophic recruitment loss, but that severe drought years or aggressive flow diversion could push the system past a tipping point. The dominance of Characidae among recruits and their strong association with the rising-water phase reinforce the well-established pattern that Neotropical characins time reproduction to exploit the expanding floodplain, and suggest that this family would be the first to suffer recruitment failure if monsoon flows are curtailed below threshold levels.
Discussion
The central result of this research-that discharge magnitude, rate of rise, and flood duration jointly explain over 80% of the variance in native fish recruitmentpositions the Coari Barrage reach alongside a growing number of regulated Neotropical rivers where hydrological attributes have been shown to dominate recruitment dynamics [7,8] . The close agreement between the predictors retained in the current model and those identified in the upper Paraná floodplain by Agostinho et al. [7] suggests that the hydrological control of recruitment is mechanistically conserved across tropical South American river systems, regardless of basin size or regulation intensity.
Where the present findings diverge from prior work is in the magnitude of the recruitment failure threshold. The 35% breakpoint identified here is lower than the 50% threshold estimated for migratory pimelodids in the São Francisco basin [8] and closer to the 30% figure reported for smallbodied characids in Cerrado headwater streams [14] . This difference likely reflects the greater hydrological connectivity of the Amazonian floodplain: even at reduced discharge, the low topographic gradient of the Solimões plain allows lateral inundation to persist over a wider area than in the incised valleys of the São Francisco, partially compensating for reduced flow [5,15] . But the lower threshold should not be mistaken for lower vulnerability; it simply means that the minimum viable flow is lower, not that the system is more resilient to flow reduction.
The strong contribution of the rate of water-level rise to the regression model deserves mechanistic scrutiny. Rising water serves at least two distinct ecological functions: it acts as a proximate spawning cue for rheophilic species, and it opens physical access to floodplain habitats that serve as nursery areas [2,16] . In the Coari reach, barrage operations can decouple these two functions by releasing stored water rapidly (high rise rate) without sustaining the elevated level long enough for floodplain colonisation. The data hint at this decoupling: during April, when barrage releases briefly raised the water level by 4.1 cm/day before gate closure reduced it again, ichthyoplankton density spiked but juvenile CPUE did not follow proportionally, suggesting that spawning was triggered but larval survival was compromised by premature floodplain disconnection [17,18] . At a practical level, the results translate into a clear environmental flow recommendation: maintaining monsoon-season discharge above 319 m³/s-the segmentedregression breakpoint-would protect the recruitment pulse of the native fish assemblage. This threshold can be operationalised as a minimum daily discharge target during the June-August window, complemented by a provision that the rate of water-level rise should not be artificially dampened below 2 cm/day during the ascending limb [19] . Such prescriptions are compatible with the existing barrage operation schedule, which currently allows pass-through of most monsoon flow, and would require adjustment only during years when upstream diversion for agriculture exceeds a defined proportion of total inflow [20,21] .
Conclusion
This research set out to quantify how monsoon-driven hydrological variability influences native fish recruitment in the regulated reach below the Coari Barrage, Amazonian Brazil. Across a complete annual cycle of fortnightly sampling at four downstream stations, the work captured 4,217 juvenile fish from 34 species and documented a twenty-one-fold seasonal amplitude in both ichthyoplankton density and juvenile catch per unit effort.
The key findings can be distilled into three points. First, discharge magnitude, rate of water-level rise, and flood duration above bankfull together explained 81.4% of the variance in monthly juvenile recruitment, confirming the flood pulse as the overriding driver even in a regulated reach. Second, a recruitment failure threshold was identified at approximately 35% of the long-term peak discharge (319 m³/s), below which juvenile abundance dropped to nearzero, providing a quantitative basis for environmental flow prescriptions. Third, Characidae dominated the recruit assemblage and showed the tightest temporal coupling to the rising-water phase, making this family the most sensitive indicator of monsoon-flow disruption. From a management perspective, the practical message is that the Coari Barrage's current operation already allows sufficient monsoon pass-through in most years, but that any future increase in upstream diversion must be constrained by the 319 m³/s threshold to prevent recruitment collapse. Complementary measures-preserving floodplain connectivity, avoiding rapid artificial drawdowns during the ascending limb, and monitoring juvenile CPUE as a performance indicator-would strengthen the ecological safeguard. Several avenues for future research remain open. Multi-year replication is needed to test whether the threshold identified in 2020 holds across wetter and drier monsoon seasons, because a single-year estimate carries inherent uncertainty about inter-annual robustness. Telemetry-based tracking of adult spawning migrations would clarify how far upstream the barrage blocks or delays reproductive movements, information that is important for evaluating the need for a fish-passage facility. Genetic parentage analysis of recruits could reveal whether the downstream juvenile assemblage is self-recruiting or subsidised by drift from upstream spawning grounds, a distinction with direct implications for the spatial scale at which environmental flow targets should be applied. And comparative analyses across multiple barrage-regulated Amazonian tributaries would test the generality of the 35% threshold and determine whether basin-specific calibration is necessary or whether a single Amazonian standard suffices.
Acknowledgement
AcknowledgementsThe Amazonian University of Aquatic Ecology provided laboratory facilities, boats, and field equipment for the entire sampling campaign. The authors acknowledge the skilled assistance of local river guides from the Coari community who contributed traditional ecological knowledge about fish spawning locations and seasonal movement patterns. Funding for this research was provided through a competitive grant from the Brazilian National Council for Scientific and Technological Development (CNPq) Programme for Amazonian Biodiversity Research, 2019-2021 cycle.
Figures and tables from the paper
| Variable | Low Water | Rising | Flood Peak | Falling |
|---|---|---|---|---|
| Discharge (m³/s) | 198 ± 14 | 487 ± 112 | 884 ± 31 | 462 ± 94 |
| Water level (m) | 3.3 ± 0.2 | 7.4 ± 1.8 | 11.9 ± 0.3 | 6.7 ± 1.4 |
| Rise rate (cm/d) | 0.4 ± 0.2 | 3.7 ± 1.1 | 0.8 ± 0.4 | -2.9 ± 0.8 |
| Juv. CPUE | 14.2 ± 3.8 | 98.7 ± 28.4 | 253.1 ± 18.6 | 92.4 ± 21.3 |
| Ichthyopl. dens. | 3.1 ± 0.9 | 24.3 ± 8.7 | 46.2 ± 4.1 | 18.7 ± 5.9 |
| Species (S) | 11.3 ± 2.1 | 24.7 ± 3.4 | 31.8 ± 1.9 | 22.1 ± 2.8 |
Table text extracted from the original PDF; superscript letters are shown inline. The original table image is below.
View original table image
| Species | n | Recruitment Window | Peak Month | Family |
|---|---|---|---|---|
| Brycon amazonicus | 487 | May-Aug | July | Characidae |
| Triportheus angulatus | 412 | May-Aug | July | Characidae |
| Prochilodus nigricans | 318 | Apr-Jul | June | Prochilodontidae |
| Cichla monoculus | 243 | Jun-Oct | August | Cichlidae |
| Semaprochilodus insignis | 227 | May-Aug | July | Prochilodontidae |
| Heros efasciatus | 198 | Jun-Sep | July | Cichlidae |
| Pterygoplichthys pardalis | 187 | Jun-Sep | August | Loricariidae |
| Mylossoma duriventre | 164 | May-Jul | June | Serrasalmidae |
| Hypostomus plecostomus | 143 | Jun-Oct | August | Loricariidae |
| Colossoma macropomum | 127 | May-Aug | July | Serrasalmidae |
Table text extracted from the original PDF; superscript letters are shown inline. The original table image is below.
View original table image
References
21 in the original paper- Agostinho AA, Thomaz SM, Gomes LC. Threats for biodiversity in the floodplain of the upper Paraná River: effects of hydrological regulation by dams. Ecohydrol Hydrobiol. 2004;4(3):267-280.
- Agostinho AA, Gomes LC, Veríssimo S, Okada EK. Flood regime, dam regulation and fish in the upper Paraná River: effects on assemblage attributes, reproduction and recruitment. Rev Fish Biol Fish. 2004;14(1):11-19.
- Bailly D, Agostinho AA, Suzuki HI. Influence of the flood regime on the reproduction of fish species with different reproductive strategies in the Cuiabá River, upper Pantanal, Brazil. River Res Appl. 2008;24(9):1218-1229.
- Barletta M, Jaureguizar AJ, Baigun C, Fontoura NF, Agostinho AA, Almeida-Val VMF, et al. Fish and aquatic habitat conservation in South America: a continental overview. J Fish Biol. 2010;76(9):21182176.
- Castello L, Macedo MN. Large-scale degradation of Amazonian freshwater ecosystems. Glob Change Biol. 2016;22(3):990-1007.
- Crook DA, Lowe WH, Allendorf FW, Erős T, Finn DS, Gillanders BM, et al. Human effects on ecological connectivity in aquatic ecosystems. Integr Comp Biol. 2015;55(6):991-1004.
- Freitas CEC, Siqueira-Souza FK, Florentino AC, Hurd LE. The importance of spatial scales to analysis of fish diversity in Amazonian floodplain lakes. Acta Limnol Bras. 2014;26(2):163-172.
- Godinho AL, Kynard B. Migratory fishes of Brazil: life history and fish passage needs. River Res Appl. 2009;25(6):702-712.
- Humphries P, King AJ, Koehn JD. Fish, flows and flood plains: links between freshwater fishes and their environment in the Murray-Darling River system. Environ Biol Fish. 1999;56(1):129-151.
- Junk WJ, Bayley PB, Sparks RE. The flood pulse concept in river-floodplain systems. Can Spec Publ Fish Aquat Sci. 1989;106:110-127.
- Kumar K, Yadav VK, Mishra UK. Ichthyofaunal diversity of Angoori Barrage, Datia, Madhya Pradesh. Zool Entomol Lett. 2022;2(2):55-59.
- Lima AC, Araujo-Lima CARM. The distributions of larval and juvenile fishes in Amazonian rivers of different nutrient status. Freshw Biol. 2004;49(6):787800.
- Lowe-McConnell RH. Ecological studies in tropical fish communities. Cambridge: Cambridge University Press; 1987. 382 p.
- Mérona B, Rankin-de-Mérona J. Food resource partitioning in a fish community of the central Amazon floodplain. Neotrop Ichthyol. 2004;2(2):75-84.
- Petrere M Jr, Barthem RB, Córdoba EA, Gómez BC. Review of the large catfish fisheries in the upper Amazon and the stock depletion of piraíba. Rev Fish Biol Fish. 2004;14(4):403-414.
- Reis RE, Kullander SO, Ferraris CJ, editors. Check list of the freshwater fishes of South and Central America. Porto Alegre: EDIPUCRS; 2003. 729 p.
- Ribeiro MCLB, Petrere M Jr, Juras AA. Ecological integrity and fisheries ecology of the AraguaiaTocantins River Basin, Brazil. River Res Appl. 1995;11(3):325-350.
- Saint-Paul U, Zuanon J, Villacorta Correa MA, García M, Fabré NN, Berger U, et al. Fish communities in central Amazonian white-and blackwater floodplains. Environ Biol Fish. 2000;57(3):235-250.
- Siqueira-Souza FK, Freitas CEC. Fish diversity of floodplain lakes on the lower stretch of the Solimões River. Braz J Biol. 2004;64(3A):501-510.
- Winemiller KO, Jepsen DB. Effects of seasonality and fish movement on tropical river food webs. J Fish Biol. 2004;53(Suppl A):267-296.
- Zuanon J, Bockmann FA, Sazima I. A remarkable sanddwelling fish assemblage from central Amazonia. Neotrop Ichthyol. 2006;4(1):107-118.