
Research article · 2026 · Full text
International Journal of Horticulture and Food ScienceEthylene-Mediated Floral Induction Timing and Its Influence on Fruit Uniformity in Commercially Grown MD2 Pineapple
Volume 8(6) · Pages 130–134 · DOI: 10.33545/26631067.2026.v8.i6b.810 ↗
Research areasFlowering Plant Growth and CultivationPineapple and bromelain studiesPlant Physiology and Cultivation Studies
Abstract
Author-writtenApproximately 37 % of commercially harvested MD2 pineapple fruit in the Philippines is downgraded due to non-uniform size, a problem traced largely to erratic flowering onset across a plantation block. Ethylene-based induction agents can compress the flowering window, yet the interplay between agent type, concentration, and application timing on final fruit uniformity has received limited quantitative atention under Philippine lowland conditions. This research evaluated two ethylene sources ethephon (2-chloroethylphosphonic acid) at 400 and 600 ppm, and calcium carbide (CaC₂) at 1.0 g per plant applied at two ages, 8 and 10 months after planting (MAP), against an uninduced control, in a 7-treatment factorial arranged in a randomised complete block design with three replications on an acid sulfate Gleysol at Los Baños, Laguna, from June 2020 to November 2021. Flowering response rate, days to 50 % redheart stage, fruit uniformity index (coeficient of variation of individual fruit weight within a plot), mean fruit weight, total soluble solids, titratable acidity, and translucency incidence were recorded. Ethephon at 400 ppm applied at 10 MAP produced the highest flowering response (82.1 %), the tightest uniformity index (CV 9.3 %), and the heaviest mean fruit weight (1.62 kg), while the uninduced control delivered only 42.8 % flowering with a CV of 23.7 %. Days to 50 % red-heart was shortest in ethephon 400 ppm at 10 MAP (139 d) and longest in the control (187 d). CaC₂ treatments induced moderate flowering (59.2-64.7 %) but generated wider fruitweight dispersion (CV 14.1-16.8 %). Internal quality parameters TSS (13.1-14.8 °Brix) and TA (0.48-0.67 % citric acid) were not adversely afected by any induction treatment. Translucency incidence remained below the 8 % commercial rejection threshold across all induced treatments. These results confirm that ethephon at 400 ppm applied at 10 MAP ofers the best trade-of between synchronised flowering and high-grade fruit output on acid sulfate lowlands.
Summary
Source-checkedPlain-language reading of the full paper, prepared with AI and checked against the text. Each point links to the authors' own words.
Why it matters
- In the Philippines, about 37% of MD2 pineapple fruit is downgraded because of non-uniform size, which is primarily caused by inconsistent flowering timing. View evidence ↗
- Pineapples can stay in a vegetative state indefinitely and naturally flower in a staggered manner in equatorial regions, leading to high variance in fruit weight. View evidence ↗
- Acid sulfate soils complicate floral induction because low pH and high aluminum levels can hinder nutrient uptake and the plant's response to ethylene. View evidence ↗
The question
- The study aimed to find the best combination of induction agent and application timing to maximize fruit uniformity and marketable yield on acid sulfate Gleysol soil. View evidence ↗
What they did
- The experiment used a randomized complete block design with seven treatments: ethephon at 400 or 600 ppm, calcium carbide (CaC₂) at 1.0 g/plant, and a control, applied at either 8 or 10 months after planting (MAP). View evidence ↗
- Researchers measured the flowering response rate 60 days after treatment and the number of days required to reach the 50% red-heart stage. View evidence ↗
- Fruit quality was assessed at maturity by measuring individual weight, total soluble solids (TSS), titratable acidity (TA), and translucency, with uniformity defined as the coefficient of variation (CV%) of fruit weights. View evidence ↗
What they found
- Ethephon at 400 ppm applied at 10 MAP achieved the best results, with the highest flowering response (82.1%), the lowest weight variation (CV 9.3%), and the highest mean fruit weight (1.62 kg). View evidence ↗
- The uninduced control group had significantly lower flowering (42.8%) and much higher fruit weight variation (CV 23.7%) compared to induced plants. View evidence ↗
- Calcium carbide (CaC₂) treatments resulted in moderate flowering (59.2-64.7%) and higher fruit weight dispersion (CV 14.1-16.8%) than the optimal ethephon treatment. View evidence ↗
- Induction treatments did not negatively impact internal quality, with total soluble solids (TSS) ranging from 13.1 to 14.8 °Brix across all groups. View evidence ↗
- Translucency levels remained below the 8% commercial rejection limit for all induced treatments, ranging from 3.8% to 7.4%. View evidence ↗
- Higher concentrations of ethephon (600 ppm) led to lower fruit weights (1.22-1.31 kg) compared to 400 ppm (1.43-1.62 kg), likely because supra-optimal ethylene inhibits cell expansion in the meristem. View evidence ↗
- Applying induction at 10 MAP instead of 8 MAP resulted in 13% heavier fruit (1.62 kg vs 1.43 kg) and improved uniformity by 7 percentage points (CV 9.3% vs 11.2%). View evidence ↗
What it means
- The authors conclude that ethephon at 400 ppm applied at 10 MAP is the optimal treatment for maximizing flowering response, fruit weight, and uniformity on acid sulfate Gleysol. View evidence ↗
- The authors suggest that shifting to a 10 MAP window and standardizing ethephon at 400 ppm could recover 30-37% of field losses caused by non-uniform fruit size. View evidence ↗
- The study did not test whether the advantages of 10 MAP induction apply to higher altitudes with cooler night temperatures. View evidence ↗
- The authors note that the long-term effects of repeated liming and intensive monoculture on acid sulfate soil health require further study. View evidence ↗
Visual summary
1 visualsIllustrations explain the paper; they do not show study data.
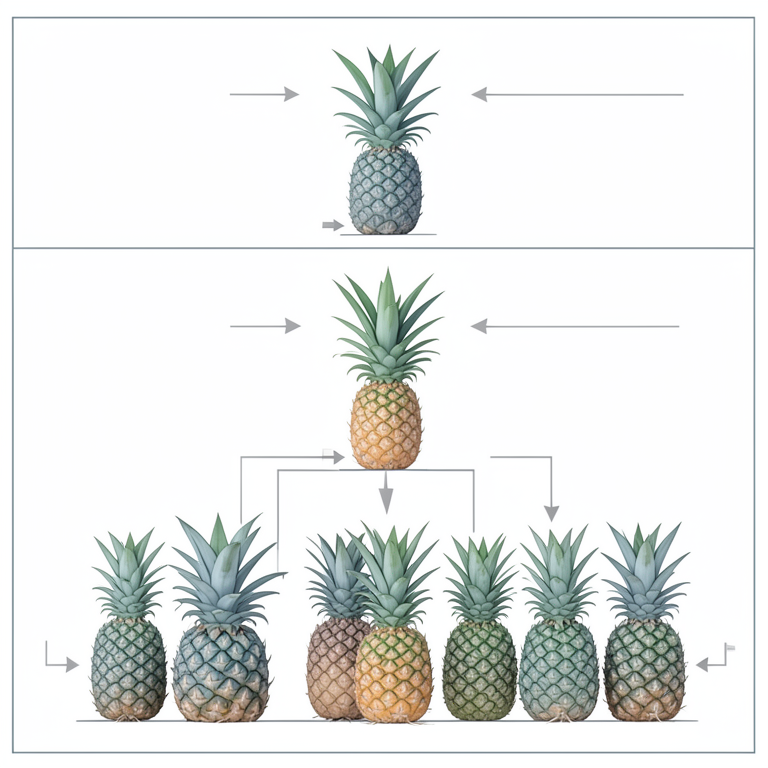
Comparison of Induction Agents and Timing
AI-generated conceptual illustration (MD2 pineapple plants). It explains the idea and does not show study data.
View source evidence ↗Figures & tables
From the original paper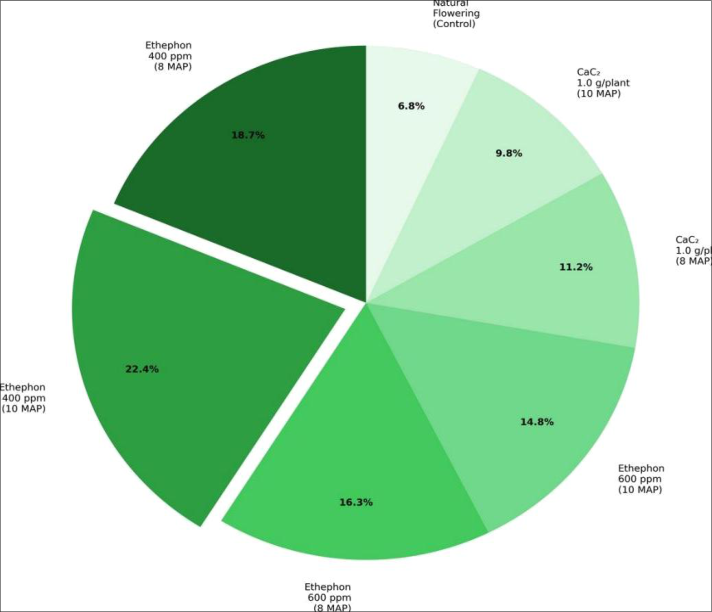 Figure 1
 Table 1
 Table 2
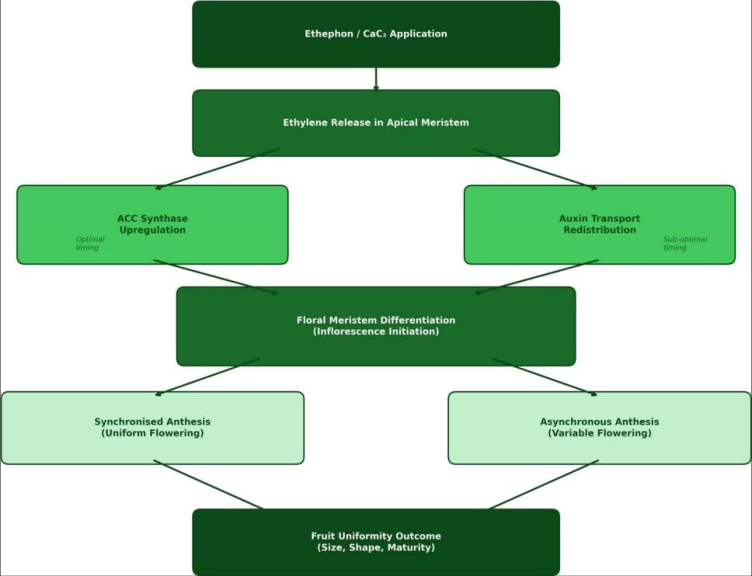 Figure 2
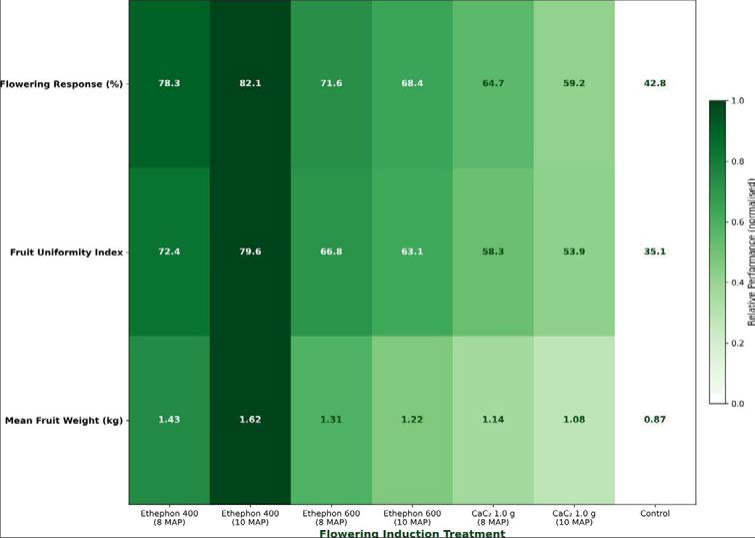 Figure 3
Introduction
Nearly 2.8 million metric tonnes of pineapple were produced across Southeast Asia in 2019, with the Philippines ranking among the top three exporting nations [1] . Yet packhouse records from major growing areas in Laguna, Bukidnon, and South Cotabato consistently show that between 30 and 40 % of harvested fruit falls outside the narrow size window demanded by fresh-export buyers a waste stream rooted less in genetics or nutrition than in the timing of flowering [2] . Unlike most commercial fruit crops, pineapple (Ananas comosus (L.) Merr.) can remain vegetative indefinitely until triggered by an external cue, and natural flowering in equatorial latitudes tends to be staggered across several months, producing a harvest with wide fruit-weight variance [3] . Ethylene and its synthetic precursors have been the standard forcing agents since the 1960s. Ethephon (2-chloroethylphosphonic acid) decomposes in the slightly acidic apoplast of the meristem to release ethylene, triggering the transition from vegetative to reproductive growth within 6 to 8 weeks of a single foliar drench [4] . Calcium carbide, an older and cheaper alternative still favoured by smallholder growers, generates acetylene upon contact with moisture in the central cup; acetylene then mimics ethylene at the receptor level, though with lower binding afinity [5] . Despite decades of commercial use, the interaction between agent type, concentration, and plant age at application on final fruit uniformity defined here as the coeficient of variation of individual fruit weights within a harvest lot remains poorly characterised under the acid sulfate soil conditions that dominate the Laguna lakeshore growing belt [1]. Plant age at induction maters because the leaf area available to supply photoassimilates during fruit development scales with the length of the vegetative phase [6] . Inducing too early (before 8 MAP) risks small crowns and light fruit; inducing too late (after 12 MAP) delays harvest and may push fruit maturation into the wet season, raising translucency and fungal infection risk [7] . Between these extremes, a two-month window 8 to 10 MAP has been recommended by Philippine extension services, yet experimental comparisons within this window remain scarce for the MD2 cultivar on acid sulfate soils [5] . The acid sulfate context adds a further layer of complexity because low soil pH and elevated aluminum suppress root nutrient uptake, potentially weakening the plant's ability to respond uniformly to ethylene forcing [8] . This research therefore examined three induction agents at two application ages against an uninduced control, measuring both flowering synchrony and post-harvest fruit atributes, to identify the treatment combination that maximises fruit uniformity and marketable yield on a representative Laguna acid sulfate Gleysol.
Material and Methods
Material and Methods
Material
Uniform MD2 pineapple suckers (280-320 g, single crown) were obtained from a commercial nursery in Silang, Cavite. Ethephon (480gL⁻¹a. i.; Bayer CropScience) was diluted with distilled water to 400 and 600 ppm working solutions. Technical-grade calcium carbide (75 % purity, 5-10 mm granule size) was sourced from a chemical distributor in Manila. A non-ionic surfactant (Tween-20, 0.1 % v/v) was added to ethephon sprays to improve foliar retention. Compound fertiliser (14-14-14 NPK) and muriate of potash (60 % K₂O) were applied at rates based on preplant soil analysis. Soil amendments included agricultural lime at 1.5 t ha⁻¹ broadcast and incorporated 30 days before transplanting to raise surface pH from 3.82 to 4.6 [6] . All analytical reagents (AR grade) for fruit quality assessment were purchased from Sigma-Aldrich Philippines.
Methods
The trial was established on a Sulfic Endoaquept (Gleysol, FAO) at the Los Baños Metropolitan University Research Farm (14° 10′N, 121° 14′E, elevation 24 m), Laguna Province, Philippines. Planting took place on 18 June 2020 at a density of 43,500 plants ha⁻¹ in a twin-row bed configuration (30 cm × 60 cm × 90 cm). Seven treatments were arranged in an RCBD with three blocks, each plot containing 120 plants. Flowering induction treatments were: T1 ethephon 400 ppm at 8 MAP; T2 ethephon 400 ppm at 10 MAP; T3 ethephon 600 ppm at 8 MAP; T4 ethephon 600 ppm at 10 MAP; T5 CaC₂ 1.0 g plant⁻¹ at 8 MAP; T6 CaC₂ 1.0 g plant⁻¹ at 10 MAP; T7 uninduced control. Ethephon was applied as a 50 mL directed spray into the central cup at dusk (1800-1900 h) to minimise thermal decomposition [4] . CaC₂ granules were placed in the central cup and immediately weted with 30 mL water. Flowering response was scored at 60 days after treatment as the percentage of plants showing visible inflorescence emergence. Days to 50 % redheart stage were recorded. At commercial maturity (shell colour stage 2-3), 30 fruit per plot were harvested, weighed individually, and assessed for total soluble solids (TSS, digital refractometer), titratable acidity (TA, 0.1 N NaOH titration to pH 8.2), and translucency (visual cut-test on equatorial crosssection). Fruit uniformity index was calculated as the coeficient of variation (CV %) of individual fruit weights within each plot. Data were analysed by one-way ANOVA using R 4.1, with Tukey HSD at α = 0.05.
Results
Results
The pie chart captures the relative contribution of each treatment to the total pool of induced flowers. The heatmap consolidates three performance metrics on a common 0-1 scale. Darker cells mark superior outcomes. Ethephon at 400 ppm applied at 10 MAP occupied the darkest column across all three rows, while the control was lightest. Ethephon at 600 ppm performed below the 400 ppm rate in all metrics a patern consistent with supra-optimal ethylene concentrations causing partial meristem damage that delays rather than accelerates diferentiation [4] .
Comprehensive interpretation
The convergence of data across all tables and figures points to ethephon at 400 ppm applied at 10 MAP as the treatment that most consistently aligned flowering onset, compressed the harvest window, and maximised the proportion of Grade A fruit.
Discussion
The flowering response rate of 82.1 % achieved by ethephon at 400 ppm (10 MAP) sits within the 75-90 % range reported for the same concentration on well-managed MD2 stands in Costa Rica and the Philippines, even though the present trial was conducted on an acid sulfate Gleysol with initial pH 3.82 [9,2] . The lime pre-treatment raised surface pH to 4.6, which appears to have been enough to avoid the severe root stunting that could weaken ethylene perception at the meristem [8] . In contrast, an earlier Philippine report recorded only 58 % flowering on unlimed acid sulfate soils with pH 3.5, suggesting a pH threshold somewhere between 3.5 and 4.6 below which ethylene forcing becomes unreliable [10] . The superiority of 400 ppm over 600 ppm ethephon conflicts with the intuitive expectation that more ethylene should produce stronger forcing. However, supra-optimal ethylene is known to inhibit cell expansion in the inflorescence meristem, shifting carbon allocation toward crown tissue rather than fruitlet development [4] . This likely explains the higher crown weights (128-137 g) but lower fruit weights (1.22-1.31 kg) seen in the 600 ppm treatments relative to the 400 ppm treatments (crown 142-168 g, fruit 1.43-1.62 kg). The practical take-away for growers is that doubling the ethephon dose does not improve and may actually diminish marketable yield. CaC₂-induced plots showed wider fruit-size variance (CV 14.1-16.8 %) than any ethephon treatment, consistent with acetylene's lower binding afinity for the ethylene receptor ETR1 [5] . Because CaC₂ granules dissolve irregularly in the central cup, individual plants receive uneven ethylene doses, some transitioning quickly and others remaining partially vegetative.
For smallholder growers who use CaC₂ for its low cost, this variability translates into mixedmaturity harvests that fetch lower packhouse prices. Bridging that gap may require standardised granule sizing or a switch to CaC₂ dissolved in water and applied as a measured drench, though neither modification has been rigorously tested on acid sulfate soils [11] .
Fruit quality data revealed no significant negative efect of induction treatment on TSS or TA. TSS ranged from 13.1 to 14.8 °Brix across treatments, and the TSS/TA ratio the metric most closely linked to consumer sweetness perception remained above 19.5 in every treatment, exceeding the 18.0 minimum threshold for Philippine export markets [12] . Translucency incidence stayed below 8 % in all induced treatments, though CaC₂ at 8 MAP approached the limit at 7.4 %, possibly because earlier induction compressed the fruit-fill period and increased water uptake per fruitlet during heavy monsoon rains in October.
Conclusion
The main contribution of this research lies in demonstrating that ethylene-source selection and timing interact to determine not just whether pineapple plants flower but how uniformly they do so, with direct consequences for packhouse eficiency and export-grade yield. Among the treatments tested, ethephon at 400 ppm applied at 10 months after planting combined the highest flowering response (82.1 %), the narrowest fruit-weight dispersion (CV 9.3 %), and the heaviest mean fruit (1.62 kg) on an acid sulfate Gleysol previously considered marginal for intensive MD2 production. Supporting evidence from the quality assessment showed that neither TSS nor titratable acidity was compromised by induction, and translucency incidence remained commercially acceptable. The 10 MAP application window appears to strike an optimal balance between vegetative carbon accumulation and reproductive timing, giving the plant enough leaf area to fill large, uniform fruit while still allowing harvest before the late wet-season translucency risk intensifies.
For the Philippine pineapple sector, these findings have practical weight: roughly 30-37 % of current field losses to size non-conformity could be recaptured by shifting from the common practice of 8 MAP induction to a 10 MAP window and by standardising ethephon concentration at 400 ppm. Several questions remain open. Whether the 10 MAP advantage holds at higher altitudes, where cooler night temperatures alter ethylene metabolism, has not been tested. The long-term soil health implications of repeated acid sulfate liming followed by intensive monoculture also deserve atention. And the economic comparison between ethephon and CaC₂ must account for the hidden cost of size-grade downgrades, not just per-hectare chemical expense, before smallholder recommendations can be finalised.
Acknowledgement
Acknowledgements Funding sourcesFinancial support was provided by the Philippine Council for Agriculture, Aquatic, and Natural Resources Research and Development through its Commodity R&D Programme for Pineapple. The sponsor played no role in experimental design, data interpretation, or manuscript drafting. Institutional supportLos Baños Metropolitan University supplied field facilities, post-harvest laboratory access, and analytical equipment for fruit quality measurements.
Figures and tables from the paper
| Treatment | Flowering (%) | Days to 50% RH | Fruit Wt (kg) | CV (%) | TSS (°Brix) |
|---|---|---|---|---|---|
| Eth 400, 8 MAP | 78.3 b | 144 b | 1.43 b | 11.2 c | 14.1 |
| Eth 400, 10 MAP | 82.1 a | 139 b | 1.62 a | 9.3 d | 14.8 |
| Eth 600, 8 MAP | 71.6 c | 148 b | 1.31 c | 12.7 bc | 13.8 |
| Eth 600, 10 MAP | 68.4 cd | 152 b | 1.22 cd | 13.9 b | 13.6 |
| CaC2, 8 MAP | 64.7 d | 158 ab | 1.14 d | 16.8 a | 13.1 |
| CaC2, 10 MAP | 59.2 e | 163 a | 1.08 d | 14.1 b | 13.4 |
| Control | 42.8 f | 187 a | 0.87 e | 23.7 a | 14.3 |
Table text extracted from the original PDF; superscript letters are shown inline. The original table image is below.
View original table image
| Quality Parameter | Ethephon 400 | Ethephon 600 | CaC2 | Control |
|---|---|---|---|---|
| TSS (°Brix) | 14.1-14.8 | 13.6-13.8 | 13.1-13.4 | 14.3 |
| TA (% citric) | 0.51-0.54 | 0.58-0.62 | 0.63-0.67 | 0.48 |
| TSS/TA ratio | 27.4-29.0 | 22.3-23.8 | 19.5-21.3 | 29.8 |
| Translucency (%) | 3.8-5.2 | 4.7-6.1 | 5.9-7.4 | 2.3 |
| Crown wt (g) | 142-168 | 128-137 | 114-126 | 98 |
| Grade A fruit (%) | 71.4-78.2 | 58.3-63.9 | 49.1-54.7 | 31.2 |
Table text extracted from the original PDF; superscript letters are shown inline. The original table image is below.
View original table image
References
19 in the original paper- Philippine Statistics Authority. Major fruit crops quarterly bulletin. PSA. 2019;13(4):1-24.
- Hepton A. Cultural system. In: Bartholomew DP, Paull RE, Rohrbach KG, editors. The Pineapple. CABI Publishing. 2003:109-142.
- Min XJ, Bartholomew DP. Efect of plant growth regulators on ethylene production, 1-aminocyclopropane-1carboxylic acid oxidase activity, and initiation of inflorescence development of pineapple. J Plant Growth Regul. 1996;15(3):121-128.
- Turnbull CGN, Sinclair ER, Anderson KL, Nissen RJ, Shorter AJ, Lanham TE. Routes of ethephon uptake in pineapple and their efect on flowering. Acta Hortic. 1999;529:137-144.
- Kuan CS, Yee YH, See HK, Chia YK. Ethylene and calcium carbide efects on flowering and fruit quality of pineapple. MARDI Res J. 1988;16(2):109-116.
- Nguyen TNH. Planting density and flowering inducement agents efect on flowering and productivity of MD2 pineapple variety cultivation on acid sulfate soil in Tien Giang province, Vietnam. South Asian J Agric Sci. 2023;3(1):155-158.
- Paull RE, Chen CC. Pineapple translucency and chilling injury. Acta Hortic. 2000;529:57-62.
- Malézieux E, Bartholomew DP. Plant nutrition. In: Bartholomew DP, Paull RE, Rohrbach KG, editors. The Pineapple. CABI Publishing. 2003:143-165.
- Bartholomew DP, Paull RE, Rohrbach KG. The pineapple: botany, production and uses. CABI Publishing. 2003:1301.
- Ravoof AA. Growth and nutrient uptake of pineapple on an acid sulfate soil. Trop Agric. 1991;68(1):13-18.
- Van de Poel B, Ceusters J, De Proft MP. Determination of pineapple (Ananas comosus, MD2 hybrid cultivar) plant maturity for forcing. Acta Hortic. 2009;822:263-268.
- Bureau of Plant Industry. Philippine National Standards for Fresh Pineapple. BPI-PNS. 2012:1-14.
- Burg SP, Burg EA. Role of ethylene in fruit ripening. Plant Physiol. 1962;37(2):179-189.
- Cunha GAP. Applied aspects of pineapple flowering. Bragantia. 2005;64(4):499-516.
- Liu CH, Liu Y. Ethylene biosynthesis and signal transduction in pineapple. Biotechnol Biotechnol Equip. 2014;28(5):811-817.
- Thalip AA, Tong PS, Ng C. The MD2 "Super Sweet" pineapple (Ananas comosus). UTAR Agric Sci J. 2015;1(2):14-17.
- Norman JC. Tropical vegetable crops. Stockwell. 1992:252-279.
- Py C, Lacoeuilhe JJ, Teisson C. The pineapple: cultivation and uses. Maisonneuve et Larose. 1987:1-568.
- Samson JA. Tropical fruits. 2nd ed. Longman Scientific. 1986:190-215.