
Research article · 2026 · Full text
International Journal of Geography Geology and EnvironmentHydrochemical analysis and evaluation of groundwater quality for irrigation suitability in Baliapal block of Balasore district, Odisha, India.
Volume 8(7) · Pages 173–182 · DOI: 10.22271/27067483.2026.v8.i7b.823 ↗
Research areasWater Quality and Pollution AssessmentWater Quality and Resources StudiesGroundwater and Isotope Geochemistry
Abstract
Author-writtenThe present study aims to approach the quality of groundwater of Baliapal Block of Balasore District, Odisha. The degradation of groundwater can put at risk for human consumption and irrigation purpose. Hence it is important to assess groundwater quality regularly. A study was conducted in a part of the coastline of North-Odisha to examine the hydrogeochemistry, spatial distribution, correlation with various ions and controlling factors of groundwater chemistry. Hence, a total of 100 groundwater samples were collected and analysed for EC, TDS, TH, HCO3−, CO3 2−, Cl−, SO42−, NO3–, F-, PO4 3-, Ca2+, Mg2+, Na+ and K+. To assess the groundwater quality for irrigation purpose, parameters like Sodium Adsorption Ratio (SAR), Soluble Sodium Percentage (SSP), Residual Sodium Carbonate (RSC), Magnesium Absorption Ratio (MAR), Permeability Index (PI), Potential Soil Salinity (PS) and Kelley’s Ratio (KR) values were calculated. As per the U.S. Salinity diagram, most of the groundwater samples fall in C2-S1 and C3-S1 category indicating medium to high salinity which is safe for irrigation purpose for all types of soils. 10 number of samples were fall in C3-S2 category whereas one sample each fall in both C2-S2 and C4-S3 category. Piper diagram, Wilcox diagram, Gibb’s diagram and Chadha diagram were plotted to know about the rock-water geochemistry and irrigation purpose of water.
Summary
Source-checkedPlain-language reading of the full paper, prepared with AI and checked against the text. Each point links to the authors' own words.
Why it matters
- Groundwater is a critical resource in India, particularly for agriculture, which serves as the foundation of the national economy. View evidence ↗
- Regular assessment of groundwater quality is necessary because degradation can jeopardize both human health and agricultural irrigation. View evidence ↗
- In the Balasore coastal basin, high agricultural consumption has led to falling groundwater levels and the intrusion of seawater. View evidence ↗
The question
- The study aims to evaluate the groundwater quality of the sandy aquifer in the Baliapal block of Balasore, Odisha, to determine its suitability for drinking and irrigation. View evidence ↗
What they did
- Researchers collected 100 groundwater samples from tube wells during the 2022 pre-monsoon period, following APHA (2012) standards. View evidence ↗
- Irrigation suitability was evaluated by calculating several indices, including the Sodium Adsorption Ratio (SAR), Permeability Index (PI), and Residual Sodium Carbonate (RSC). View evidence ↗
- The study utilized Piper, Wilcox, Gibbs, and Chadha diagrams to analyze rock-water geochemistry and irrigation suitability. View evidence ↗
What they found
- The groundwater is generally neutral to slightly alkaline, with pH values ranging from 6.16 to 7.78 and a mean of 7.13. View evidence ↗
- All 100 groundwater samples were classified as 'excellent' based on their Sodium Adsorption Ratio (SAR) values, indicating no sodium-related hazard to soils. View evidence ↗
- Residual Sodium Carbonate (RSC) analysis showed that 97% of samples are suitable (< 1.25 meq/L) and 3% are moderately suitable (1.25–2.5 meq/L) for irrigation. View evidence ↗
- Potential Salinity (PS) analysis found 69% of samples to be excellent to good (< 5), 28% good to injurious (5-10), and 3% injurious to unsatisfactory (> 10). View evidence ↗
- Gibbs plot analysis indicates that the groundwater chemistry is primarily 'rock-dominated,' meaning local geological materials control the water's composition. View evidence ↗
- Strong positive correlations were found between SAR and KR (r = 0.92) and SAR and %Na (r = 0.86), highlighting sodium's role in controlling these indices. View evidence ↗
What it means
- The authors conclude that the overall groundwater quality in the study area is favorable for agricultural use. View evidence ↗
- The authors state that seawater intrusion significantly influences chloride dissolution in the region. View evidence ↗
Visual summary
1 visualsIllustrations explain the paper; they do not show study data.
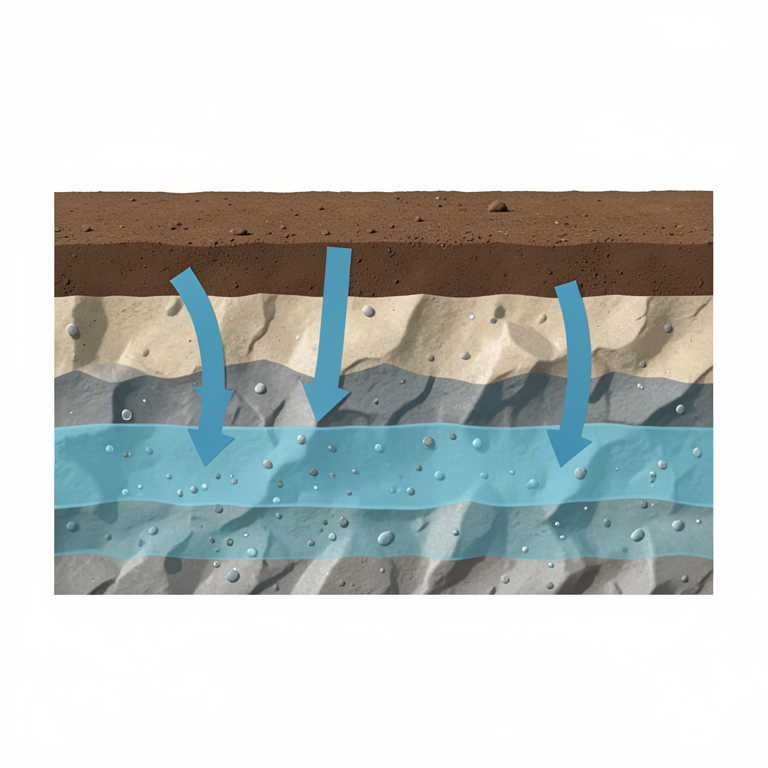
Groundwater Chemistry Control
AI-generated conceptual illustration (Cross-section of soil and rock layers with an underground aquifer). It explains the idea and does not show study data.
View source evidence ↗Figures & tables
From the original paper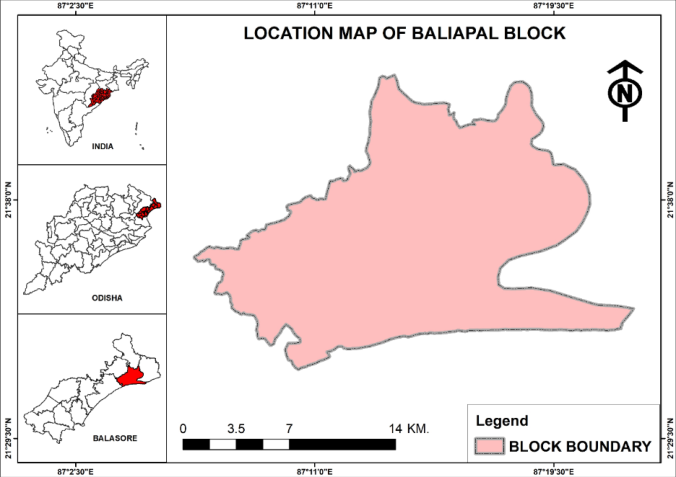 Figure 1
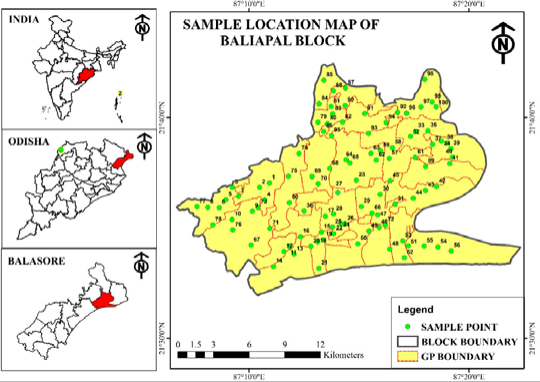 Figure 2
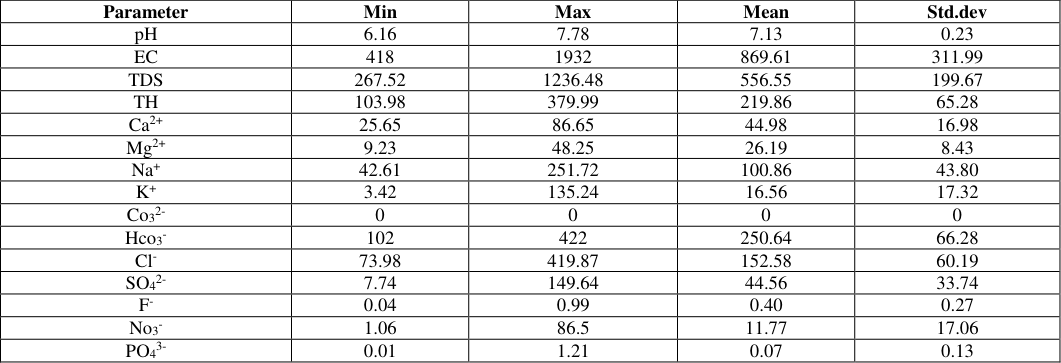 Table 1
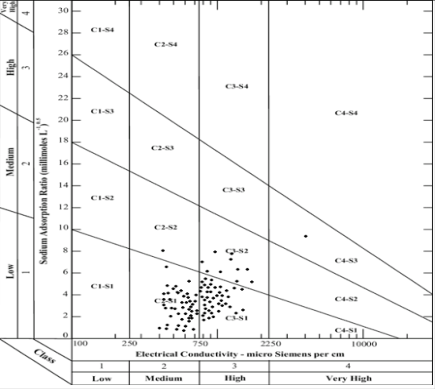 Figure 3
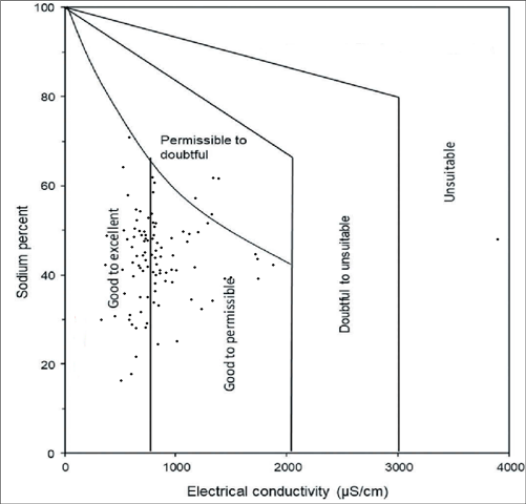 Figure 4
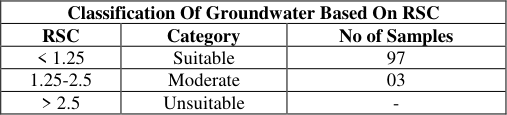 Table 2
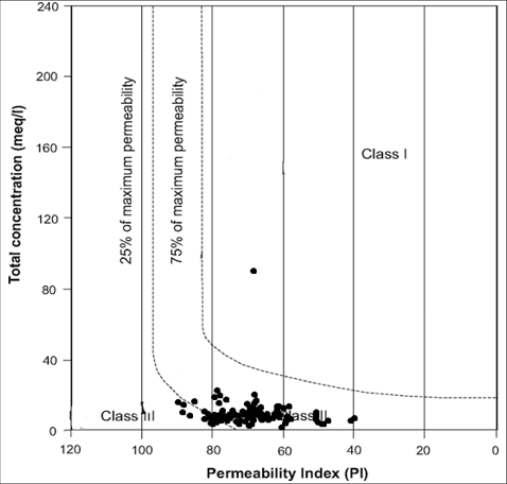 Figure 5
 Table 3
 Table 5
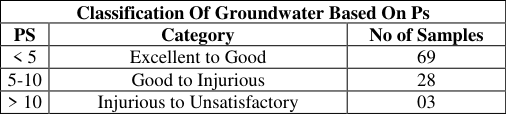 Table 4
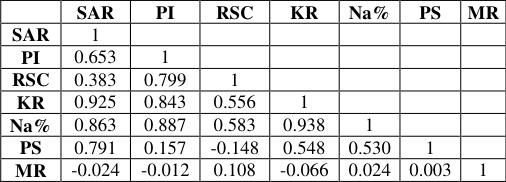 Table 6
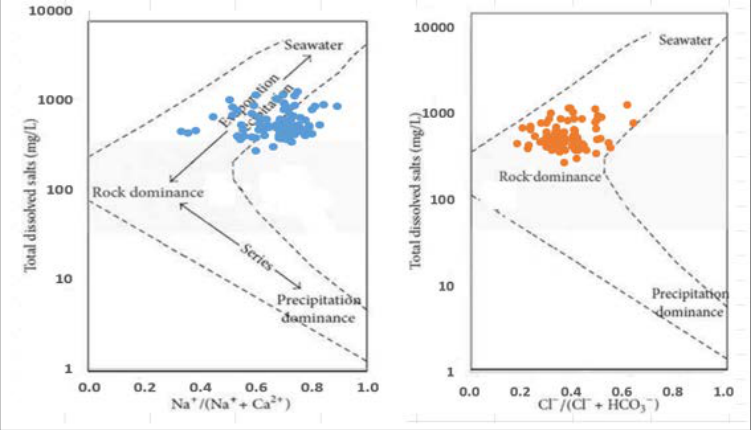 Figure 6
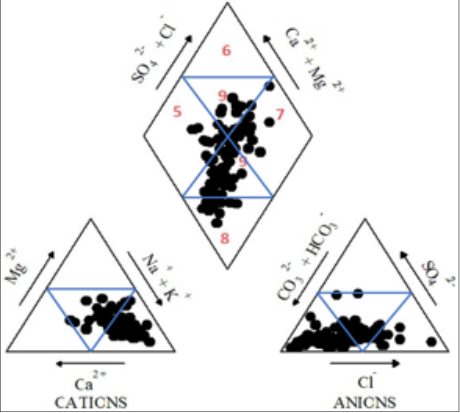 Figure 7
Introduction
Groundwater is an essential natural resource that supports life in India and across the globe. India ranks among the highest consumers of groundwater, mainly for agriculture and household needs such as drinking water. Since agriculture is the backbone of the Indian economy, the demand for groundwater remains very high. In many rural regions, people depend largely on hand pumps and tube wells for both irrigation and daily water use. Data from the National Sample Survey shows that around 56% of households rely on hand pumps or tube wells for drinking water, while 14% use open wells and nearly 25% receive water through piped supply systems. The degradation of groundwater can put at risk for irrigation purpose and human health. Hence it is important to assess groundwater quality regularly. Analysis of groundwater hydrogeochemistry, control characteristics, water quality, and nitrate-related health risks in Longkou Bay, has been studied in North China (Adimalla, 2019) [1] . Changes in water resources as a result of climate change will increase pressure for sustainable water management, especially in regions that are already water stressed and/or under pressure. According to Pandey et al., (2023) & Karunanidhi et al., (2020) [12,19] , the demand for fresh water has significantly increased over the past few decades due to the fast industrialization and population rise, a case study in the Shanmuganadhi River basin of South India. Rapid urbanisation, particularly in emerging economies like India, has had an impact on groundwater accessibility and availability because of overuse and improper waste management, particularly in metropolitan areas of Uttarpradesh, India (Elumalai et al., 2020) [8] . Several studies have been carried out to examine the pollution levels in the eastern and coastal portions of the Mahanadi Basin, Odisha. (Haque et al., 2021) [10] . the groundwater state of a region is significantly influenced by the topography, including its geology, Geomorphology, Soil, and hydraulic gradient (Mahanta & Goswami, 2024) [14] . The research of groundwater development utilising RS and GIS approaches has been studied in the lower stretches of Subarnarekha River, Odisha (Jaishi et al., 2024) [11] . It is possible to evaluate the water quality of any given place or particular source using physical, chemical, and biological properties. According to Li et al., (2024), if these metrics' values exceed certain thresholds, it could be harmful to people's health. The regulating factors that influence an aquifer's groundwater availability are its geographic area, infiltration index, and specific yield (Mahanta et al., 2018) [15] . But as anthropogenic groundwater withdrawals outpace natural recharge, groundwater supplies are running out in Baitarani River Basin of Odisha (Mahanta, 2017) [16] . Droughts and rising temperatures are examples of climatic stresses that also have an impact on groundwater supplies (Rahman et al., 2021; USEPA, 2012) [21] . Groundwater depletion is linked to changes in the land-atmosphere energy feedback, saline water intrusion, and deteriorating water quality (Rajan & Nandimandalam, 2024) [22] . Recharge of groundwater only happens when precipitation surpasses evapotranspiration. With the sloping topography and hard rock soil, the frequency and severity of intense rain fall events have increased recently (Naik et al., 2022; Li et al., 2024) [17] , which is anticipated to lead to increased runoff losses. Due to inappropriate groundwater use for agriculture, the GRACE (Gravity Recovery and Climate Experiment) satellite mission records show significant groundwater depletion in north and northwest India (Baruah et al., 2024; Sahoo et al., 2024) [3,23] . Approximately 80% of the 45 million people who live in Odisha rely on groundwater for their drinking water. Because of groundwater consumption for agriculture, groundwater levels in the heavily populated Balasore coastal basin are dropping and seawater intrusion has been observed (Das et al., 2023; Haque et al., 2021) [6,10] . The main cause of the lower number of research comparing studies on surface water to those on groundwater regarding the effects of anthropogenic and climatic stresses is a lack of data (Mahanta et al., 2018; Mahanta, 2017) [15,16] . The main sources of data on the impact of anthropogenic and hydrological factors on groundwater systems, however, are time series of groundwater levels from monitoring networks (Rajan & Nandimandalam, 2024; Zafar et al., 2022) [22,27] . This study aims to assess the groundwater quality of sandy aquifer of Balipal block in coastal area of Balasore district in north-eastern Odisha and determine whether the water is suitable for drinking water and for many purposes including irrigation. The main objective of this study is to monitor the groundwater in the study area using GIS technology and take necessary measures to improve the groundwater for drinking and for many other purposes.
Materials and Methods
Materials and Methods
Study area
The study area is located in the administrative unit of Balipal block of Balasore district in north coastal Odisha. The study area spans an area of about 202 km 2 and is marked by the Survey of India toposheet numbers F45P/2, F45P/3 and F45P/6. The area lies between 21º31′N to 21º42′N and 87º07′E to 87º22′E. The administrative blocks such as Jaleswar to the north, Bhograi to the east, Basta and Balasore sadar to the west, and the Bay of Bengal to the south (CGWB, 2016). The location map of the study area is shown in Fig. 1. The average daily temperature in this region is around 32.3 °C in summer and 16.5 °C in winter. The average precipitation in the pre-monsoon period in 2022 is estimated to be approximately 1429.21 mm. Sample location map of the study area is shown in Fig. 2.
Sample collection and physicochemical analysis
A total of 100 groundwater samples were collected from tube wells in various parts of the study area in the premonsoon of 2022 using the analysis method recommended by American Public Health Association (APHA), 2012. Before collecting the water samples, the tube wells were pumping for five to ten minutes for removing any stagnant water. Subsequently, 1 litre polyethylene bottles with a sterilized and pre-cleaned capacity stored the water samples and stored at 4 °C for analysis using standard procedures recommended by APHA. Every bottle had an accurate label with pertinent information written on it. At the sample collection site, measurements of pH, TDS, and temperature were made by using a portable device (Hanna HI 9811-5). A GPS device is used to determine the coordinates of the sample. Sample bottles were filled with sample water. Wear gloves if collecting samples by hand. In the study region, most of the hand pumps used for irrigation and drinking were less than 40 meters deep. The analysis of all chemical parameters was carried out in accordance with the procedures outlined by APHA (2012). Sulfate (SO₄²⁻) and nitrate (NO₃⁻) concentrations were quantified using a UV-Visible spectrophotometer. Chloride (Cl⁻) content was determined by the argentometric titration method employing silver nitrate (AgNO₃). Total hardness (TH, expressed as CaCO₃) and calcium ion (Ca²⁺) concentrations were measured through EDTA titration. Magnesium hardness (MgH) was obtained by calculating the difference between total hardness and calcium hardness (MgH = TH -CaH). The concentration of magnesium ions (Mg²⁺) was then estimated from the magnesium hardness value using the equivalent weight of magnesium and the normality of the EDTA solution. The concentrations of total hardness (TH, expressed as CaCO₃) and calcium (Ca²⁺) were determined using the standard EDTA complexometric titration method. Sodium (Na⁺) and potassium (K⁺) concentrations were quantified with a Systronics flame photometer following standard analytical procedures. Bicarbonate (HCO₃⁻) was analyzed by acid titration using sulfuric acid (H₂SO₄) as the titrant and methyl orange as the indicator. Fluoride (F⁻) concentration was measured using an ionselective electrode (ISE) method employing an Orion fluoride electrode coupled with an Orion electrometer, in accordance with previously reported procedures (Adimalla, 2019; Rahman, 2021) [1,21] . Calibration of the instrument was performed using a series of fluoride standards (0.1-10 mg L⁻¹) prepared by serial dilution of a 100 mg L⁻¹ sodium fluoride stock solution. Prior to measurement, 2 mL of Total Ionic Strength Adjustment Buffer (TISAB III) was added to 20 mL of each sample to maintain a constant ionic strength and minimize potential interference during fluoride determination.
Statistical Method
Groundwater quality evaluation for irrigation purposes involves the systematic analysis of hydrochemical characteristics using statistical techniques. Water samples are collected from selected wells distributed across the study area to represent the spatial variability of groundwater conditions. The collected samples are examined for important physicochemical parameters, including pH, electrical conductivity (EC), total dissolved solids (TDS), major cations such as sodium (Na⁺), potassium (K⁺), calcium (Ca²⁺), and magnesium (Mg²⁺), major anions including chloride (Cl⁻), sulfate (SO₄²⁻), and bicarbonate (HCO₃⁻), as well as trace metals where necessary. Descriptive statistical tools are applied to summarize the dataset by determining measures such as average values, standard deviations, and observed ranges. In addition, correlation analysis is used to investigate the degree of association among water quality variables and to identify factors influencing groundwater chemistry. The interpretation of these statistical results helps determine the suitability of groundwater for irrigation and supports the development of appropriate water management practices. Such an approach provides a reliable framework for understanding groundwater quality and contributes to the sustainable utilization of water resources in agricultural regions.
Results and Discussion
Results and Discussion
Hydrochemical results
The hydrochemical characteristics of the groundwater samples are presented in Table 1. The pH values range from 6.16 to 7.78, with a mean value of 7.13, indicating that the groundwater is generally neutral to slightly alkaline in nature. Total Dissolved Solids (TDS) concentrations vary between 267.52 and 1236.48 mg/L, with an average of 556.55 mg/L, suggesting that the groundwater predominantly falls within the freshwater category. Electrical conductivity (EC), which reflects the concentration of dissolved ions and the salinity status of water, ranges from 418 to 1932 µmho/cm, with a mean value of 869.61 µmho/cm. Elevated EC values may be attributed to the dissolution and leaching of minerals from aquifer materials. Total hardness (TH) values range from 103.98 to 379.99 mg/L, with an average of 219.86 mg/L, indicating that the groundwater is generally hard to very hard in character. Fluoride concentrations vary from 0.04 to 0.99 mg/L, with a mean concentration of 0.40 mg/L, which may be associated with the dissolution of fluoride-bearing minerals present in the alluvial deposits. Nitrate concentrations range between 1.06 and 86.50 mg/L, averaging 11.77 mg/L. The occurrence of elevated nitrate levels at certain locations is likely linked to intensive agricultural practices and the excessive application of nitrogen-based fertilizers.
| Parameter | Min | Max | Mean | Std.dev |
|---|---|---|---|---|
| pH | 6.16 | 7.78 | 7.13 | 0.23 |
| EC | 418 | 1932 | 869.61 | 311.99 |
| TDS | 267.52 | 1236.48 | 556.55 | 199.67 |
| TH | 103.98 | 379.99 | 219.86 | 65.28 |
| Ca2+ | 25.65 | 86.65 | 44.98 | 16.98 |
| Mg2+ | 9.23 | 48.25 | 26.19 | 8.43 |
| Na+ | 42.61 | 251.72 | 100.86 | 43.80 |
| K+ | 3.42 | 135.24 | 16.56 | 17.32 |
| Co32- | 0 | 0 | 0 | 0 |
| Hco3- | 102 | 422 | 250.64 | 66.28 |
| Cl- | 73.98 | 419.87 | 152.58 | 60.19 |
| SO42- | 7.74 | 149.64 | 44.56 | 33.74 |
| F- | 0.04 | 0.99 | 0.40 | 0.27 |
| No3- | 1.06 | 86.5 | 11.77 | 17.06 |
| PO43- | 0.01 | 1.21 | 0.07 | 0.13 |
Table text extracted from the original PDF; superscript letters are shown inline. The original table image is below.
View original table image
Sodium Adsorption Ratio (SAR)
The Sodium Adsorption Ratio (SAR) is a widely used index for assessing the suitability of groundwater for irrigation. It indicates the relative concentration of sodium ions in comparison to calcium and magnesium ions and is used to evaluate the potential impact of irrigation water on soil structure, permeability, and infiltration characteristics (Mahanta, 2017; Mahanta et al., 2018; Mahanta & Goswami, 2024) [16,17,18] . The results of the present study reveal that all 100 groundwater samples fall within the excellent category based on SAR values. This classification suggests that the groundwater poses no sodium-related hazard to agricultural soils and is therefore considered suitable for irrigation purposes.
SAR = Na
All values are expressed in meq/L. The US Salinity Laboratory (USSL) diagram is widely used to evaluate the suitability of water for irrigation by assessing both salinity and sodium hazards. In this classification, the Sodium Adsorption Ratio (SAR) is plotted against Electrical Conductivity (EC) (Fig. 3). The results indicate that 47% of the groundwater samples fall within the C2S1 category, while 41% belong to the C3S1 category. Additionally, 10% of the samples are classified as C3S2, whereas only 1% each fall under the C2S2 and C4S3 categories. The predominance of samples in the C2S1 and C3S1 classes suggests low sodium hazard with medium to high salinity levels, making them generally suitable for irrigation under appropriate management practices. Overall, the groundwater quality of the study area is considered favourable for agricultural use. Percent Sodium (%Na) is a widely used indicator for evaluating the suitability of water for irrigation. It expresses the proportion of sodium ions relative to the total concentration of major cations present in water and is useful for assessing the potential impact of sodium on soil permeability, structure, and agricultural productivity (Mahanta et al., 2018; USEPA, 2014) [17] . The analysis of groundwater samples from the study area revealed that 12% of the samples fall within the good category, 71% are classified as permissible, and 17% are categorized as doubtful for irrigation use. These results indicate that the majority of the groundwater samples are suitable for irrigation, although a considerable proportion may require careful management to prevent adverse effects on soil properties and crop growth.
%Na = (Na
All values are expressed in meq/L. The Wilcox diagram (Wilcox, 1948) [26] is widely employed to evaluate the suitability of groundwater for irrigation by relating sodium percentage (Na %) to electrical conductivity (EC) (Fig. 4). Based on these parameters, irrigation water is categorized into five classes: excellent to good, good to permissible, permissible to doubtful, doubtful to unsuitable, and unsuitable. Elevated sodium concentrations in irrigation water may adversely affect soil structure by promoting soil dispersion, which reduces permeability and water infiltration, ultimately impacting crop productivity. Therefore, the assessment of sodium percentage is essential for sustainable agricultural water management (Jaishi et al., 2024) [11] . The results of the present study indicate that 46% of the groundwater samples belong to the excellent category, 49% fall within the good category, 4% are classified as permissible, and only 1% are categorized as doubtful. These findings suggest that the majority of the groundwater samples are suitable for irrigation purposes with minimal sodiumrelated hazards.
Permeability Index (PI)
The Permeability Index (PI) is an important criterion for evaluating the suitability of groundwater for irrigation, as it reflects the influence of dissolved ions on soil permeability and the long-term maintenance of soil structure. This index helps assess the potential impact of irrigation water on soil degradation, particularly due to the presence of sodium and bicarbonate ions. The calculated PI values indicate that groundwater in the study area is generally appropriate for irrigation purposes. Based on the classification results, 48% of the samples fall within the suitable category, while the remaining 52% are classified as good. These findings suggest that the majority of groundwater samples are unlikely to adversely affect soil permeability and can be safely utilized for agricultural irrigation. PI =
Here all values are in meq/l. According to the Permeability Index (PI) classification proposed by Doneen (1964) [7] , the irrigation suitability of groundwater samples was evaluated and illustrated in Fig. 5. The results indicate that the majority of the samples fall within Class II (permissible) and Class III (unsuitable) categories, while only one sample is classified under Class I (good) for irrigation use. The Permeability Index reflects the potential impact of irrigation water on soil permeability, which is primarily governed by the concentrations of sodium (Na⁺), calcium (Ca²⁺), magnesium (Mg²⁺), and bicarbonate (HCO₃⁻) ions. Elevated levels of these constituents can alter soil structure and infiltration characteristics, thereby influencing the long-term suitability of water for agricultural applications. The Permeability Index (PI) is an important parameter for evaluating the suitability of irrigation water, as it reflects the potential influence of water quality on soil permeability. Elevated PI values may alter soil physical properties, affecting water movement, infiltration capacity, and drainage conditions. Continuous monitoring of PI is therefore essential for sustainable agricultural management, as adverse changes in soil permeability can reduce crop productivity and increase the risk of surface runoff and soil degradation.
Residual Sodium Carbonate (RSC)
Residual Sodium Carbonate (RSC) is an important parameter for assessing irrigation water quality, reflecting the potential for sodium and carbonate accumulation in the soil, which may impact soil structure and crop health. RSC is calculated based on the concentrations of sodium, calcium, and magnesium in the water. Elevated RSC values indicate a higher risk of sodium toxicity and soil dispersion, making it a critical factor in evaluating water for irrigation purposes.
Residual Sodium Carbonate (RSC)
is a key indicator used to evaluate the suitability of water for irrigation. It measures the excess concentration of carbonate and bicarbonate ions relative to calcium and magnesium ions, which can influence soil properties and crop productivity. High RSC values promote the precipitation of calcium and magnesium, resulting in a relative increase in sodium concentration in the soil. This process can adversely affect soil structure, reduce permeability, and hinder water infiltration. Consequently, irrigation water with elevated RSC levels may contribute to sodium accumulation and soil degradation, making RSC an essential criterion for assessing irrigation water quality and its long-term impact on agricultural sustainability. The formula of RSC is given below;
RSC = (HCO
All values are reported in meq/L. The analysis of RSC values indicates that 97% of the groundwater samples have values below 1.25 meq/L, classifying them as suitable for irrigation use. Approximately 3% of the samples fall within the range of 1.25-2.5 meq/L, indicating a moderate level of suitability for irrigation. No sample recorded an RSC value greater than 2.5 meq/L, the threshold generally considered unsuitable for agricultural irrigation. These findings suggest that the majority of the groundwater in the study area can be safely utilized for irrigation without posing significant risks to soil quality (Table 2). [3] .
| Classification Of Groundwater Based On RSC | — | — |
|---|---|---|
| RSC | Category | No of Samples |
| < 1.25 | Suitable | 97 |
| 1.25-2.5 | Moderate | 03 |
| > 2.5 | Unsuitable | - |
Table text extracted from the original PDF; superscript letters are shown inline. The original table image is below.
View original table image
Here all values are in meq/l. Kelley's Ratio (KR) is widely used to evaluate the suitability of water for irrigation by assessing the relative concentration of sodium with respect to calcium and magnesium ions. A KR value less than 1 indicates that sodium levels are comparatively low, making the water suitable for irrigation. Conversely, values greater than 1 reflect sodium dominance, which may promote soil dispersion, reduce permeability, and adversely affect crop productivity. Therefore, KR serves as an important indicator of the potential impact of irrigation water on soil quality and agricultural sustainability. In the To understand the hydrochemical facies, different water types, and geochemical evolution of the region, the Piper (1944) [20] diagram was plotted (Li et al., 2024). According to the classification, the predominant water types are in "Field 5" (magnesium bicarbonate type), "Field 9" (mixed type), "Field 7" (sodium chloride type) and "Field 8" (sodium bicarbonate type) which is depicted in Fig. 7.
Figures and tables from the paper
| Classification Of Groundwater Based On KR | — | — |
|---|---|---|
| KR | Category | No of Samples |
| < 1 | Good | 50 |
| > 1 | Unsuitable | 50 |
Table text extracted from the original PDF; superscript letters are shown inline. The original table image is below.
View original table image
| Classification Of Groundwater Based On Mr | — | — |
|---|---|---|
| MR | Category | No of Samples |
| < 50 | Suitable | 54 |
| > 50 | Unsuitable | 46 |
Table text extracted from the original PDF; superscript letters are shown inline. The original table image is below.
View original table image
| Classification Of Groundwater Based On Ps | — | — |
|---|---|---|
| PS | Category | No of Samples |
| < 5 | Excellent to Good | 69 |
| 5-10 | Good to Injurious | 28 |
| > 10 | Injurious to Unsatisfactory | 03 |
Table text extracted from the original PDF; superscript letters are shown inline. The original table image is below.
View original table image
| — | SAR | PI | RSC | KR | Na% | PS | MR |
|---|---|---|---|---|---|---|---|
| SAR | 1 | ||||||
| PI | 0.653 | 1 | |||||
| RSC | 0.383 | 0.799 | 1 | ||||
| KR | 0.925 | 0.843 | 0.556 | 1 | |||
| Na% | 0.863 | 0.887 | 0.583 | 0.938 | 1 | ||
| PS | 0.791 | 0.157 | -0.148 | 0.548 | 0.530 | 1 | |
| MR | -0.024 | -0.012 | 0.108 | -0.066 | 0.024 | 0.003 | 1 |
Table text extracted from the original PDF; superscript letters are shown inline. The original table image is below.
View original table image
References
27 in the original paper- Adimalla N. Spatial distribution, exposure, and potential health risk assessment from nitrate in drinking water from semi-arid region of South India. Hum Ecol Risk Assess. 2019;26(2):310-334. DOI:10.1080/10807039.2018.1508329.
- American Public Health Association, American Water Works Association, Water Environment Federation. Standard methods for the examination of water and wastewater. 21st ed. Washington (DC): American Public Health Association; 2012.
- Baruah MP, Singha K, Jha P. Heavy metal concentration in agricultural soil near industrial clusters around Raipur city: a geochemical appraisal. Environ Qual Manag. 2024. DOI:10.1002/tqem.22190.
- Bureau of Indian Standards. Indian Standard drinking water specification. 1st rev. New Delhi: Bureau of Indian Standards; 2012. p. 1-8.
- Central Ground Water Board. Groundwater quality scenario in India. New Delhi: Government of India; 2016.
- Das R, Rao NS, Sahoo H, Sakram G. Nitrate contamination in groundwater and its health implications in a semi-urban region of Titrol block, Jagatsinghpur district, Odisha, India. Phys Chem Earth Parts A/B/C. 2023;132:103424. DOI:10.1016/j.pce.2023.103424.
- Doneen LD. Notes on water quality in agriculture. Water Sci Eng. 1964;1(1):1-10.
- Elumalai V, Nethononda VG, Manivannan V, Rajmohan N, Li P, Elango L. Groundwater quality assessment and application of multivariate statistical analysis in Luvuvhu catchment, Limpopo, South Africa. J Afr Earth Sci. 2020;171:103967. DOI:10.1016/j.jafrearsci.2020.103967.
- Gibbs RJ. Mechanisms controlling world water chemistry. Science. 1970;170(3962):1088-1090.
- Haque ME, Zahan RN, Reza S. Iron in groundwater: quality evaluation, health risk, and spatial distribution in Rangpur City Corporation. Arab J Geosci. 2021;14(7). DOI:10.1007/s12517-021-06450-7.
- Jaishi HP, Mahanta B, Ali I, Baishya K, Roy DK, Sarma M. Evaluation of groundwater quality using heavy metal pollution indices and estimation of health risk. Int J Environ Anal Chem. 2024:1-23. DOI:10.1080/03067319.2024.2382365.
- Karunanidhi D, Aravinthasamy P, Subramani T, Muthusankar G. Revealing drinking water quality issues and possible health risks based on water quality index (WQI) method in the Shanmuganadhi River basin of South India. Environ Geochem Health. 2021;43(2):931948. DOI:10.1007/s10653-020-00613-3.
- Li Z, Li J, Huang J, Li Y. Nitrate contamination in groundwater and its health risk assessment: a case study of Quanzhou, a typical coastal city in Southeast China. Environ Earth Sci. 2024;83(10). DOI:10.1007/s12665024-11608-z.
- Mahanta N, Goswami S. Groundwater vulnerability to fluoride pollution and health risk assessment in the western part of Odisha, India. Environ Sci Pollut Res Int. 2024;31(24):35878-35896. DOI:10.1007/s11356-02433620-3.
- Mahanta N, Sahoo HK, Barik PK, Mahanta PS. Groundwater quality assessment around Baripada area, Mayurbhanj District, Odisha, India. Environ Geochem. 2018;21(1-2):19-24.
- Mahanta N. Groundwater investigation by resistivity method in the drought-prone Kuchinda and Bamra Blocks, Sambalpur District, Odisha, India. Int J Earth Sci Eng. 2017;10(2):242-246.
- Naik MR, Mahanty B, Sahoo SK, Jha VN, Sahoo NK. Assessment of groundwater geochemistry using multivariate water quality index and potential health risk in industrial belt of central Odisha, India. Environ Pollut. 2022;303:119161. DOI:10.1016/j.envpol.2022.119161.
- Pal SC, Saha A, Jaydhar AK. Groundwater vulnerability assessment of elevated heavy metal contamination related health hazard in coastal multi-aquifers of Sundarban Biosphere Reserve, India. J Hydrol. 2024:131353. DOI:10.1016/j.jhydrol.2024.131353.
- Pandey S, Kumari N, Nawajish SA. Land use land cover (LULC) and surface water quality assessment in and around selected dams of Jharkhand using water quality index (WQI) and geographic information system (GIS). J Geol Soc India. 2023;99(2):205-218. DOI:10.1007/s12594-023-2288-y.
- Piper AM. A graphic procedure in the geochemical interpretation of water analysis. Am Geophys Union Trans. 1944;25(6):914-923.
- Rahman A, Mondal NC, Tiwari KK. Anthropogenic nitrate in groundwater and its health risks in the view of background concentration in a semi-arid area of Rajasthan, India. Sci Rep. 2021;11(1). DOI:10.1038/s41598-021-88600-1.
- Rajan S, Nandimandalam JR. Environmental health risk assessment and source apportion of heavy metals using chemometrics and pollution indices in the upper Yamuna River basin, India. Chemosphere. 2024;346:140570. DOI:10.1016/j.chemosphere.2023.140570.
- Sahoo T, Panda J, Swain S, Sahoo SK, Maurya M, Hembram M, et al. Integrated geochemical analysis of groundwater quality and human health risks by using multivariate statistical methods: a case study of Mayurbhanj District, Odisha, India. Research Square. 2024. DOI:10.21203/rs.3.rs-4204728/v1.
- United States Environmental Protection Agency. Risk assessment guidance for Superfund, volume 1: human health evaluation manual (Part A). EPA/540/1-89/002. Washington (DC): Office of Emergency and Remedial Response; 2014.
- United States Environmental Protection Agency. Integrated risk information system. 2012.
- Wilcox LV. The quality of water for irrigation use. US Department of Agriculture Technical Bulletin No. 962. Washington (DC): US Department of Agriculture; 1948.
- Zafar MM, Sulaiman MA, Prabhakar R, Kumari A. Evaluation of the suitability of groundwater for irrigational purposes using irrigation water quality indices and geographical information systems (GIS) at Patna (Bihar), India. Int J Energy Water Resour. 2022. DOI:10.1007/s42108-022-00193-1.