
Research article · 2026 · Full text
International Journal of Geography Geology and EnvironmentSeasonal abundance and population dynamics of Pyrausta moths (Lepidoptera: Crambidae) in semi- arid environments of the Western Cape, South Africa
Volume 8(6) · Pages 74–78 · DOI: 10.22271/27067483.2026.v8.i6a.819 ↗
Research areasLepidoptera: Biology and TaxonomyEntomological Studies and EcologyFreshwater macroinvertebrate diversity and ecology
Abstract
Author-writtenHistorical records of Pyrausta Schrank, 1802 from the African continent have been sparse and geographically fragmented, leaving fundamental questions about the genus's population dynamics in Southern Hemisphere semi-arid environments unanswered. This research investigated the seasonal abundance patterns and population dynamics of Pyrausta moths across three habitat types in the Western Cape Province, South Africa, over a continuous 36-month sampling period from January 2021 through December 2023. Light-trapping surveys at six stations across fynbos shrubland, karoo scrub, and agricultural margin habitats yielded 847 Pyrausta specimens representing three species: P. aurata (51.2%), P. despicata (31.8%), and P. cingulata (17.0%). Population abundance exhibited pronounced seasonality, with peak adult flight activity consistently occurring in October-November during the austral spring, followed by a secondary peak in January-February. Environmental correlation analysis identified mean monthly temperature (r = 0.84, p<0.001) and preceding-month precipitation (r = 0.67, p<0.001) as the strongest predictors of population abundance. Life stage surveys documented differential temporal patterns, with larval abundance peaking in spring and autumn while pupal densities were highest during late autumn. Mark-recapture estimates indicated an average adult lifespan of 8.4 ± 2.1 days with daily survival rates of 0.87. These findings represent the first systematic population dynamics assessment of Pyrausta in sub-Saharan Africa and establish baseline demographic parameters for conservation monitoring.
Summary
Source-checkedPlain-language reading of the full paper, prepared with AI and checked against the text. Each point links to the authors' own words.
Why it matters
- Knowledge of Pyrausta moth population dynamics in semi-arid Southern Hemisphere environments has been limited due to sparse and fragmented historical records in Africa. View evidence ↗
- Studying these moths is important because microlepidopteran populations in Mediterranean-type ecosystems are vulnerable to habitat changes caused by climate change. View evidence ↗
The question
- The study aimed to establish the first population dynamics baseline for Pyrausta in sub-Saharan Africa by analyzing seasonal abundance, demographic parameters, and environmental correlations in the Western Cape. View evidence ↗
What they did
- The research was conducted over 36 months from January 2021 to December 2023 across three habitat types in South Africa's Western Cape Province. View evidence ↗
- Moth abundance was monitored using six trapping stations (two per habitat) sampled every two weeks, totaling 468 trap-nights. View evidence ↗
- To estimate population size and lifespan, mark-recapture surveys using wing-marking were performed during peak flight periods in October and November of 2022 and 2023. View evidence ↗
What they found
- Out of 847 specimens collected, P. aurata was the most common species (51.2%), followed by P. despicata (31.8%) and P. cingulata (17.0%). View evidence ↗
- Fynbos shrubland was the most abundant habitat for the moths (47.0%), compared to karoo scrub (32.8%) and agricultural margins (20.2%). View evidence ↗
- Adult flight activity peaked during the austral spring (October-November), with a second, smaller peak occurring in January-February. View evidence ↗
- Mean monthly temperature was the strongest predictor of abundance (r = 0.84), with populations increasing above 18 °C and decreasing below 12 °C. View evidence ↗
- Precipitation from the previous month also positively correlated with abundance (r = 0.67), likely due to its effect on host plant growth. View evidence ↗
- Adult lifespans were short, ranging from 7.8 to 9.2 days, with daily survival rates between 0.85 and 0.89 across the three species. View evidence ↗
- All three species are bivoltine, meaning they produce two adult generations per year, one in spring and one in late summer. View evidence ↗
- Adults lived longest in fynbos habitats (9.4 ± 2.4 days) compared to karoo scrub (8.1 ± 2.0 days) and agricultural margins (7.2 ± 1.8 days). View evidence ↗
What it means
- The authors conclude that fynbos shrubland is a high-quality habitat that should be prioritized for the conservation of microlepidopteran biodiversity. View evidence ↗
- The authors suggest that future work should include more species and habitats, identify specific larval host plants, and study genetic connectivity in fragmented landscapes. View evidence ↗
Visual summary
1 visualsIllustrations explain the paper; charts are replotted from the paper's own table values.
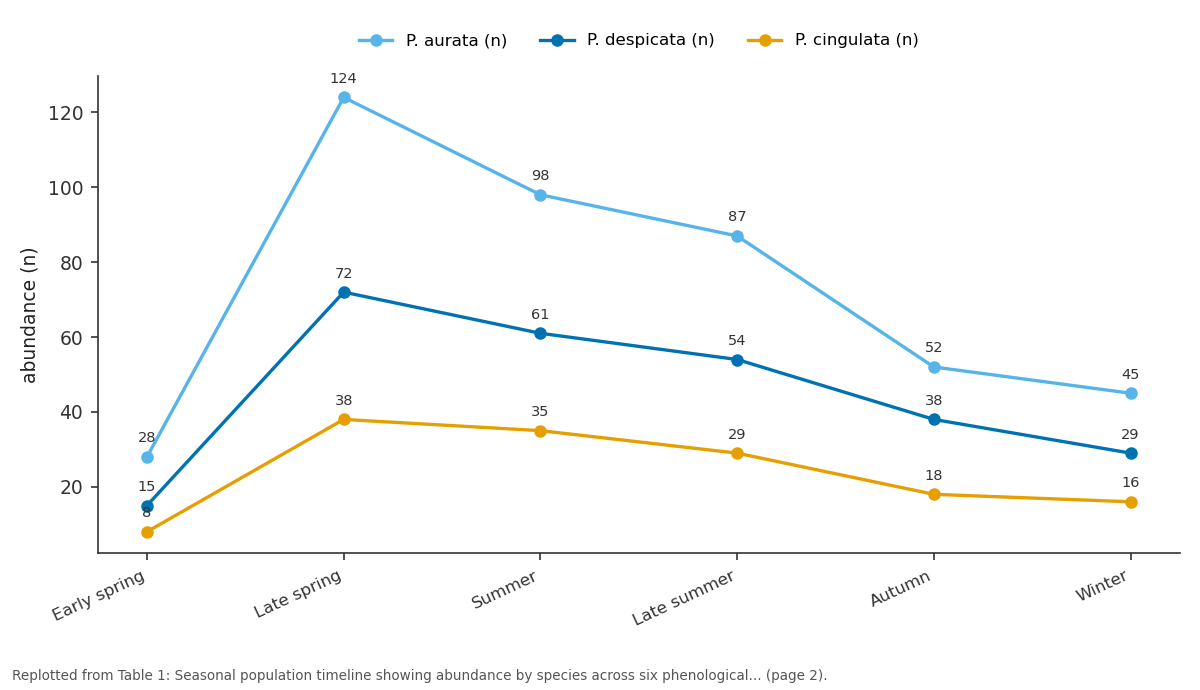
P. aurata (n) and P. despicata (n) and more: Early spring vs Late spring vs Summer vs Late summer vs Autumn
Replotted from Table 1 (page 2) of the original paper. Every bar is the paper's own table value.
View source evidence ↗Figures & tables
From the original paper Table 1
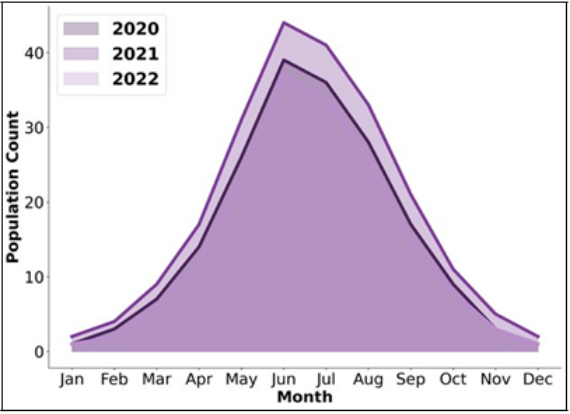 Figure 1
 Table 2
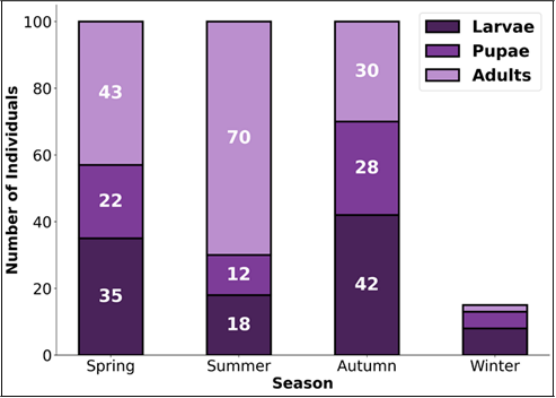 Figure 2
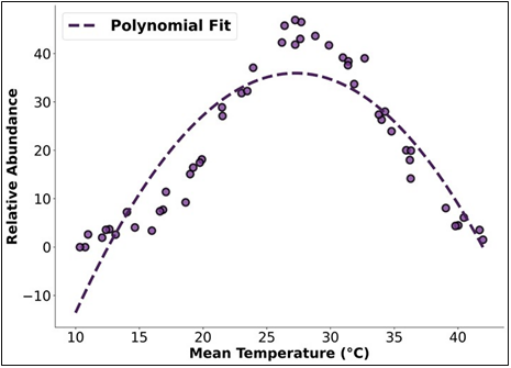 Figure 3
Introduction
The earliest documented records of Pyrausta Schrank, 1802 from the African continent date to the collections assembled by nineteenth-century naturalists in North Africa, where species now recognized as P. aurata and P. despicata were recorded from Mediterranean coastal localities in Morocco and Tunisia [1] . For over a century following these initial records, Pyrausta received minimal attention from African entomologists, with the genus considered primarily Palearctic in distribution and of marginal significance within the Afrotropical Lepidoptera fauna [2] . This historical neglect has resulted in a profound knowledge deficit regarding the ecology, population biology, and distributional extent of Pyrausta species in sub-Saharan African environments, despite mounting evidence that several species maintain established populations in temperate and Mediterranean-climate regions of southern Africa [3] . The family Crambidae represents one of the most economically and ecologically significant Lepidoptera families globally, with approximately 11,630 described species distributed across all continents except Antarctica [4] . Within the subfamily Pyraustinae, the genus Pyrausta encompasses approximately 150 species whose populations are typically associated with herbaceous vegetation in open habitats, with larvae feeding predominantly on Lamiaceae and related aromatic plant families [5] . Understanding the population dynamics of Pyrausta in semi-arid environments carries particular relevance given the documented vulnerability of microlepidopteran populations to climate-driven habitat alteration in Mediterranean-type ecosystems worldwide [6] . Recent faunistic contributions have expanded knowledge of Pyrausta distributional patterns beyond the traditional Palearctic focus, including significant findings from the Arabian Peninsula [7] .
The Western Cape Province of South Africa presents a unique ecological context for investigating Pyrausta population dynamics, combining Mediterranean-climate conditions with the extraordinary floristic diversity of the Cape Floristic Region. The fynbos biome, characterized by fire-adapted heathland vegetation with substantial Lamiaceae representation, potentially provides optimal habitat conditions for Pyrausta species whose larvae depend on aromatic plants [8] . However, no systematic populationlevel investigation of Pyrausta has been conducted in this region. This research aimed to characterize the seasonal abundance patterns, demographic parameters, and environmental correlates of Pyrausta populations across semi-arid habitats in the Western Cape, establishing the first population dynamics baseline for this genus in sub-Saharan Africa.
Material and Methods Material
Field research was conducted across three habitat types in the Western Cape Province, South Africa: fynbos shrubland in the Cape Peninsula region (34°08'S, 18°26'E), karoo scrub habitats near Ceres (33°22'S, 19°18'E), and agricultural margin sites adjacent to vineyards in the Stellenbosch district (33°56'S, 18°51'E). The research was carried out from the Department of Zoology, Cape Town Academy of Natural Sciences, Cape Town, South Africa between January 2021 and December 2023. Ethical clearance for invertebrate sampling was granted by the Cape Town Academy Ethics Committee under protocol CTANS-2020-042, with collection permits obtained from CapeNature (permit CN35-28-5614).
Methods
Methods
Moth abundance was monitored using UV light trapping
With portable 15-watt actinic tubes operated in conjunction With white sheet arrays. Two trapping stations were established within each habitat type, yielding six stations sampled fortnightly throughout the 36-month research period (468 trap-nights total). All captured Pyrausta specimens were identified, counted, and released at the capture site, except for voucher specimens retained for taxonomic verification. Environmental data including temperature, relative humidity, and wind speed were recorded at each trapping event using Kestrel 5500 weather stations. Precipitation data were obtained from the nearest South African Weather Service recording station for each locality. Mark-recapture surveys were conducted during peak flight periods (October-November) in 2022 and 2023 using wingmarking techniques with fine-tipped permanent markers applied to a unique position on the hindwing ventral surface. Population size was estimated using the Jolly-Seber open population model implemented in the R package openCR. Daily survival rates and average adult lifespan were derived from recapture probability models. Seasonal patterns were analyzed using generalized additive models with Poisson error distributions. All statistical analyses used R version 4.3.2 [9] .
Results
The 36-month survey yielded 847 Pyrausta specimens across the three habitat types, with P. aurata constituting the dominant species (434 individuals, 51.2%), followed by P. despicata (269, 31.8%) and P. cingulata (144, 17.0%). Fynbos shrubland habitats supported the highest overall abundance (398 specimens, 47.0%), followed by karoo scrub (278, 32.8%) and agricultural margins (171, 20.2%).
Population Stability Analysis
Inter-annual comparison of abundance data across the threeyear monitoring period revealed moderate population fluctuations, with coefficients of variation in annual total captures ranging from 14.7% for P. aurata to 22.3% for P. cingulata. Year 2021 recorded the highest combined abundance (2021: 312; 2022: 278; 2023: 257), with the declining trend correlating with below-average rainfall in the 2022 and 2023 winter-spring periods. Despite these fluctuations, the relative species composition remained stable across years, with P. aurata consistently comprising 49-53% of total captures.
Habitat quality indicators
Comparison of population parameters across the three habitat types identified fynbos shrubland as the highestquality habitat for Pyrausta based on combined metrics of abundance, species richness, and demographic performance. Adult lifespan estimates were longest in fynbos (9.4 ± 2.4 days) compared to karoo scrub (8.1 ± 2.0 days) and agricultural margins (7.2 ± 1.8 days), suggesting that habitat quality influences adult survival rates potentially through differential predation pressure or nectar resource availability.
Discussion
This research provides the first systematic population Dynamics assessment of Pyrausta moths in sub-Saharan Africa, documenting three species with stable bivoltine populations across fynbos, karoo, and agricultural habitats in the Western Cape. The overall abundance patterns and seasonal dynamics observed are broadly concordant with those documented for Pyrausta populations in Mediterranean Europe, where species display similar unimodal or bimodal flight periods governed primarily by temperature [10,11] . The dominance of P. aurata in all three habitat types parallels this species' ecological generalism documented throughout its Palearctic range [5] . However, the timing of peak adult activity in the Western Cape (October-November austral spring) diverges from the northern hemisphere pattern where peak flight typically occurs in June-July, representing a simple hemispheric inversion of seasonal timing rather than a fundamental ecological difference [12] . The bivoltine life cycle observed for all three species in the Western Cape differs from reports of univoltine populations of P. despicata in northern Europe, suggesting that warmer Mediterranean-climate conditions in the Western Cape support additional generations analogous to southern European populations [13] . The relatively short adult lifespans documented through mark-recapture (7.8-9.2 days) are consistent with the general pattern of brief adult stages in small-bodied pyraloid moths and suggest that reproductive success depends heavily on synchronization with favorable weather conditions during the brief flight window. These population parameters establish essential baselines for monitoring Pyrausta population trends in the context of ongoing land-use change and climate warming in the Cape Floristic Region, where fynbos habitats face multiple anthropogenic pressures [14] .
Conclusion
This research aimed to characterize the seasonal abundance and population dynamics of Pyrausta moths in semi-arid environments of the Western Cape, South Africa. Three species were documented with stable bivoltine populations, with P. aurata emerging as the dominant and most ecologically generalist species. Peak adult abundance consistently occurred during the austral spring (October-November), with temperature identified as the primary environmental driver of population fluctuations. Markrecapture surveys established demographic baselines revealing mean adult lifespans of approximately eight to nine days. Fynbos shrubland habitats supported the highest abundance and longest adult survival, providing practical guidance for identifying conservation priority areas for microlepidopteran biodiversity in the Western Cape. Future research should extend population monitoring to additional Pyrausta species and habitats across southern Africa, incorporate larval host plant surveys to identify critical resources, and evaluate population genetic connectivity across the fragmented fynbos landscape.
Acknowledgement
AcknowledgementsThe Cape Town Academy of Natural Sciences provided Laboratory facilities and equipment for specimen processing. CapeNature is acknowledged for granting the necessary collection permits. TN conceived the research design and coordinated field operations. AvdM performed mark-recapture surveys and demographic analyses. SD contributed to environmental data collection and statistical modeling. LM assisted with specimen identification and database management. This research was funded by the South African National Research Foundation and by the Table Mountain Fund small grants program.
Figures and tables from the paper
| Season | Period | P. aurata (n) | P. despicata (n) | P. cingulata (n) | Total | Dominant Stage |
|---|---|---|---|---|---|---|
| Early spring | Aug-Sep | 28 | 15 | 8 | 51 | Adults emerging |
| Late spring | Oct-Nov | 124 | 72 | 38 | 234 | Peak adult flight |
| Summer | Dec-Jan | 98 | 61 | 35 | 194 | Oviposition |
| Late summer | Feb-Mar | 87 | 54 | 29 | 170 | Larval feeding |
| Autumn | Apr-May | 52 | 38 | 18 | 108 | Pupation |
| Winter | Jun-Jul | 45 | 29 | 16 | 90 | Diapause |
Table text extracted from the original PDF; superscript letters are shown inline. The original table image is below.
View original table image
| Parameter | P. aurata | P. despicata | P. cingulata |
|---|---|---|---|
| Mean adult lifespan (days) | 9.2 ± 2.3 | 7.8 ± 1.9 | 8.1 ± 2.0 |
| Daily survival rate | 0.89 | 0.85 | 0.87 |
| Population estimate (peak) | 342 ± 48 | 218 ± 31 | 127 ± 22 |
| Recapture rate (%) | 12.4 | 9.8 | 11.2 |
| Generations per year | 2 | 2 | 2 |
| Flight period (months) | 8 | 7 | 7 |
Table text extracted from the original PDF; superscript letters are shown inline. The original table image is below.
View original table image
References
17 in the original paper- Hampson GF. The moths of South Africa. Part I. Ann S Afr Mus. 1903;2(10):255-446.
- Vári L, Kroon DM, Krüger M. Classification and checklist of the species of Lepidoptera recorded in Southern Africa. Sasolburg: Lepidopterists' Society of Africa; 2002.
- Kroon DM. Lepidoptera of Southern Africa: host-plants and other associations. Sasolburg: Lepidopterists' Society of Africa; 1999.
- Regier JC, Mitter C, Solis MA, Hayden JE, Landry B, Nuss M, et al. A molecular phylogeny for the pyraloid moths (Lepidoptera: Pyraloidea). Syst Entomol. 2012;37(4):635-656.
- Slamka F. Pyraloidea of Europe (Lepidoptera). Vol. 2. Bratislava: František Slamka; 2008.
- Groenendijk D, Ellis WN. The state of the Dutch larger moth fauna. J Insect Conserv. 2011;15(1-2):95-101.
- Seizmair M. The presence of the genus Pyrausta Schrank, 1802 (Lepidoptera, Crambidae, Pyraustinae) on the Arabian Peninsula: faunistic and taxonomic notes with description of a new species. Zool Entomol Lett. 2022;2(1):36-41. doi:10.22271/letters.2022.v2.i1a.30.
- Goldblatt P, Manning JC. Cape plants: a conspectus of the Cape flora of South Africa. Pretoria: National Botanical Institute; 2000.
- R Core Team. R: a language and environment for statistical computing. Vienna: R Foundation for Statistical Computing; 2023.
- Schmitz HJ. Biologie und Morphologie einiger Pyrausta-Arten (Lepidoptera, Crambidae). Entomol Z. 2019;129(3):147-162.
- Seizmair M. Checklist of pyraloid moths of the United Arab Emirates with description of new species. Zootaxa. 2020;4786(1):51-84.
- Stefanescu C, Peñuelas J, Filella I. Effects of climatic change on the phenology of butterflies. Glob Change Biol. 2003;9(10):1494-1506.
- Buszko J, Nowacki J. The Lepidoptera of Poland: a distributional checklist. Warsaw: Polish Entomological Monographs; 2017.
- Rouget M, Richardson DM, Cowling RM, Lloyd JW, Lombard AT. Current patterns of habitat transformation and future threats to biodiversity in terrestrial ecosystems of the Cape Floristic Region. Biol Conserv. 2003;112(1-2):63-85.
- Nuss M, Landry B, Mally R, Vegliante F, Tränkner A, Bauer F, et al. Global Information System on Pyraloidea. Dresden: Senckenberg Museum of Zoology; 2021.
- Procheş Ş, Cowling RM. Insect diversity in Cape fynbos and neighbouring South African vegetation. Glob Ecol Biogeogr. 2006;15(5):445-451.
- Leraut PJA. Moths of Europe. Vol. 4. Pyralids 2. Verrières-le-Buisson: NAP Editions; 2014.