
Research article · 2026 · Full text
International Journal of Horticulture and Food ScienceGenetic diversity studiesof bottle gourd[Lagenaria siceraria (Mol.) Stand.]genotypes using PCA
Volume 8(7) · Pages 91–95 · DOI: 10.33545/26631067.2026.v8.i7b.801 ↗
Research areasAdvances in Cucurbitaceae ResearchGenetics and Plant BreedingAgricultural Practices and Plant Genetics
Abstract
Author-writtenThe investigation was conducted to evaluate the genetic architecture and diversity among 24 bottle gourd [Lagenaria siceraria (Mol.) Stand.] genotypes, comprising 15 advance lines, six local cultivars, and three released varieties. The experiment was laid out in a Randomized Block Design (RBD) with three replications during the spring season of 2024 at GBPUA&T, Pantnagar. Principal Component Analysis (PCA) was employed to simplify the multidimensional data into significant components. Results revealed that the first nine principal components, with eigenvalues ranging from 1.93 to 0.85, accounted for the majority of the phenotypic variation. PC1 (22.01%) was predominantly associated with vine length (0.4655), internodal length (0.3794), and fruit yield per plant (0.3272). PC2 (15.02%) was primarily influenced by phenological traits such as days to first fruit harvest (0.3468) and biochemical parameters like antioxidant activity (0.3084). The PCA biplot exhibited a uniform distribution of genotypes across all four quadrants, with accessions situated further from the origin indicating higher genetic divergence. This study underscores the efficacy of PCA in identifying stable, superior genotypes and character combinations. These findings provide a strategic framework for breeders to select diverse parental lines for hybridization, aiming to develop high-yielding recombinants with improved nutritional profiles.
Summary
Source-checkedPlain-language reading of the full paper, prepared with AI and checked against the text. Each point links to the authors' own words.
Why it matters
- Bottle gourd is a crop from the Cucurbitaceae family grown during the warm season for its fruit. View evidence ↗
- As a cross-pollinated crop, bottle gourd exhibits significant variation in traits that are economically important. View evidence ↗
- Understanding how different traits contribute to genetic divergence allows breeders to select specific trait combinations for crossing, reducing wasted time and labor. View evidence ↗
The question
- The study aimed to evaluate genetic diversity among bottle gourd genotypes from various locations to identify superior genotypes for future use. View evidence ↗
What they did
- The researchers evaluated 24 bottle gourd genotypes, which included 15 advance lines, six local cultivars, and three released varieties. View evidence ↗
- The experiment used a Randomized Block Design with three replications during the spring of 2024 at GBPUA&T, Pantnagar. View evidence ↗
- Principal Component Analysis (PCA) was used to reduce complex, multidimensional data into a few significant components. View evidence ↗
What they found
- The first nine principal components, with eigenvalues between 1.93 and 0.85, explained most of the phenotypic variation. View evidence ↗
- The first principal component (PC1) explained 22.01% of the variation and was most strongly linked to vine length, internodal length, and fruit yield per plant. View evidence ↗
- The second principal component (PC2) explained 15.02% of the variation and was mainly influenced by antioxidant activity and the time to first fruit harvest. View evidence ↗
- In the PCA biplot, accessions closer to the origin were found to be less diverse and more superior across the studied parameters compared to those further away. View evidence ↗
What it means
- The authors conclude that their results provide a framework for breeders to select superior genotypes based on quality and yield traits for more effective breeding programs. View evidence ↗
- The study recommends using these findings to select diverse parental lines for hybridization to create high-yielding recombinants with better nutritional profiles. View evidence ↗
Visual summary
3 visualsIllustrations explain the paper; charts are replotted from the paper's own table values.
PCA Concept for Crop Traits
AI-generated conceptual illustration (bottle gourd plants (Lagenaria siceraria)). It explains the idea and does not show study data.
View source evidence ↗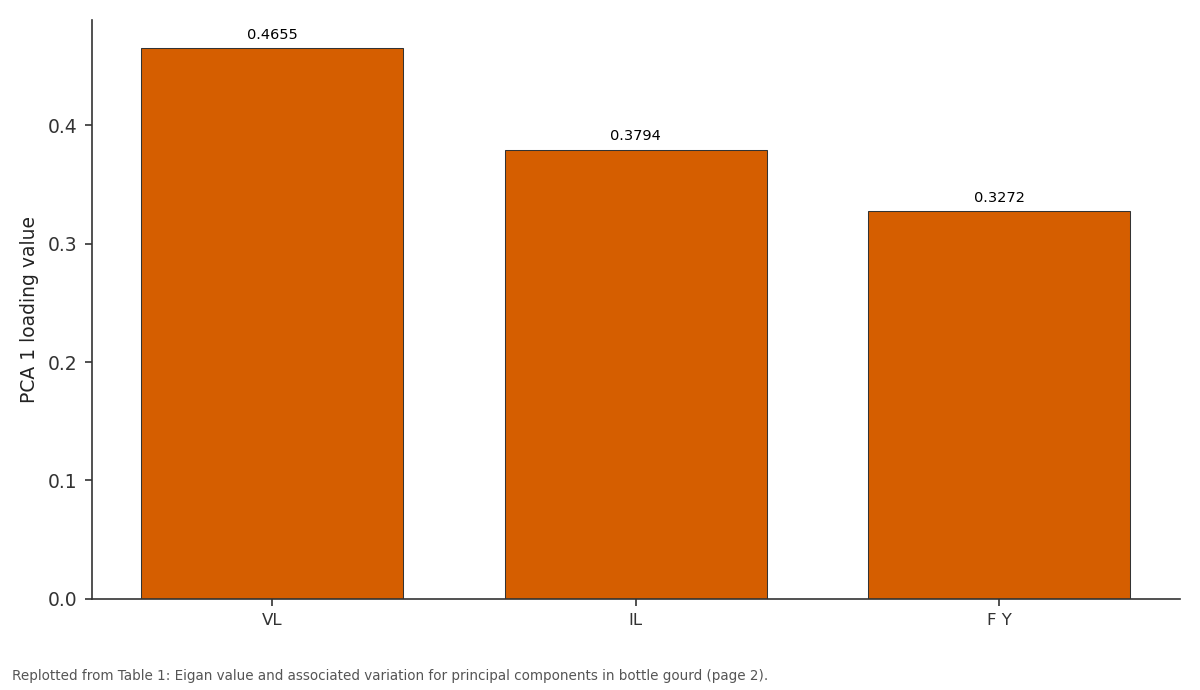
PCA 1: VL vs IL vs F Y
Replotted from Table 1 (page 2) of the original paper. Every bar is the paper's own table value.
View source evidence ↗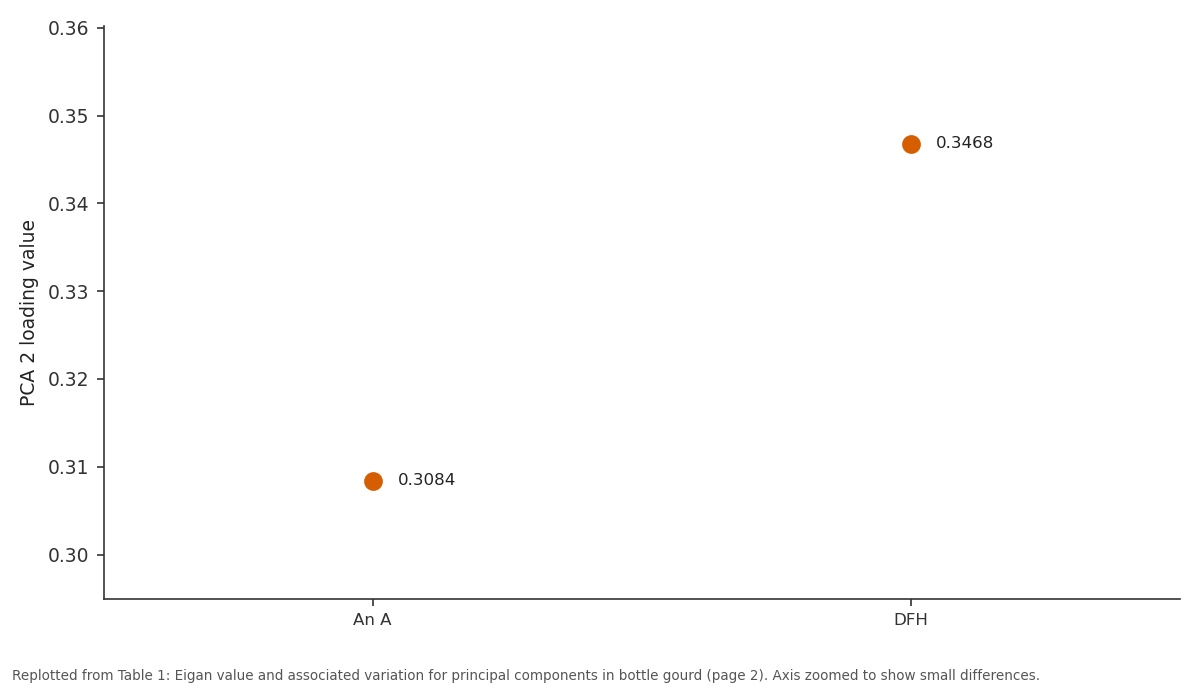
PCA 2: An A vs DFH
Replotted from Table 1 (page 2) of the original paper. Every bar is the paper's own table value.
View source evidence ↗Figures & tables
From the original paper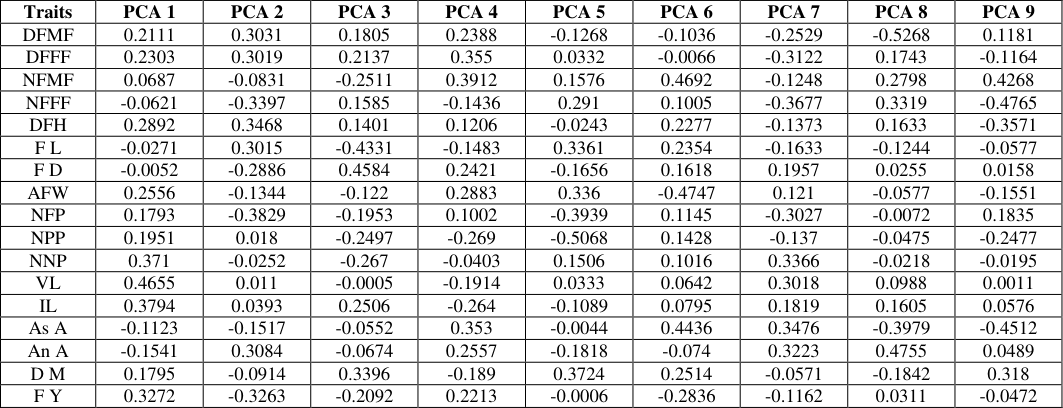 Table 1
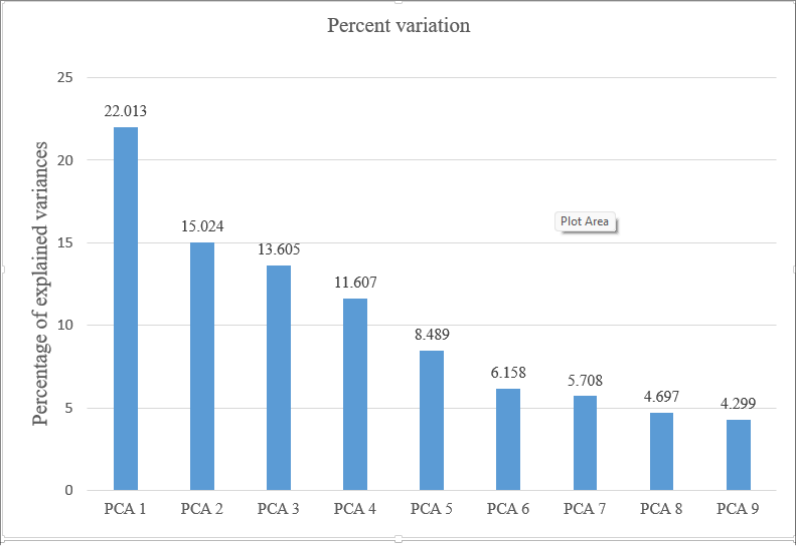 Figure 1
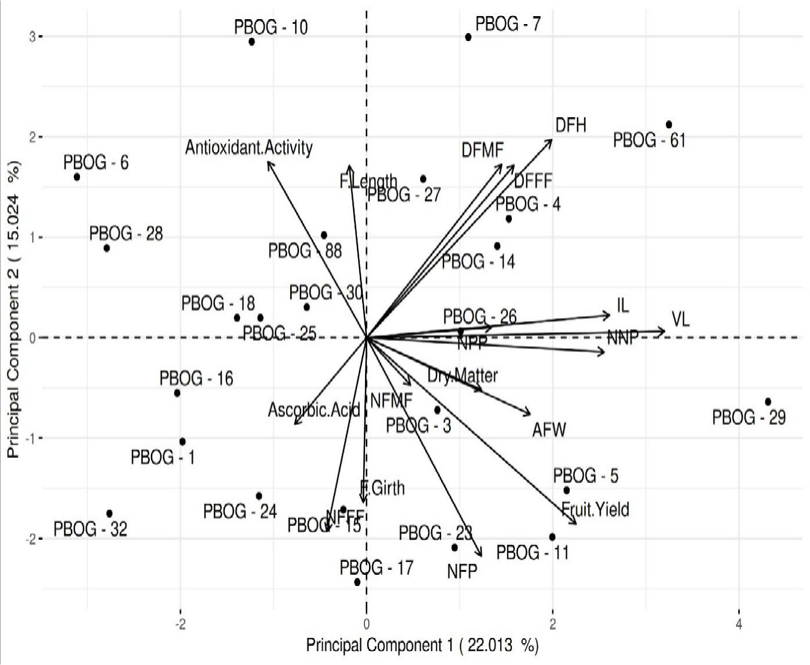 Figure 2
Introduction
Bottle gourd [Lagenaria siceraria (Mol.) Stand.] belonging to the family Cucurbitaceae is a worm season crop cultivated for its fruits. The cultivated species is commonly known as bottle gourd or white flowered gourd. It is a cross pollinated crop with large amount of variation for many economically important traits. India is the secondary center of origin of bottle gourd endowed with a variety of diverse germplasm (Sultana et al., 2018) [7] . The average day temperature of 20 -27 °C with lower night temperature of 18 -23 °C is optimal for growth and fruiting. The relative contribution of different traits to the total divergence helps to select a particular trait or a combination of traits for inter-crossing which avoids wastage to time and labor. Principal component analysis (PCA) is a powerful technique which allows the visualization of natural grouping of the genotypes and is precise indicator of differences among genotypes (Uddin et al., 2019) [8] . More stable genotypes are believed to generate a superior recombinants through crossing as there is less environmental influence on them. Keeping all these points in mind, the present investigation was undertaken to evaluate the genetic diversity among the bottle gourd genotypes collected from diverse locations and to identify a superior genotypes for future use.
Material and Methods
The experimental material for the present investigation, which included twenty-three genotypes and one check, was sown in a randomized block design with three replications during the spring season of 2024. Fifteen advance lines from GBPUA&T, Pantnagar were taken under the study including the check variety i.e. Pant Lauki-3. One local culticar from Uttarakhand, five local cultivars from Uttar Pradesh and three released varieties from IIVR, Varanasi (Kashi Ganga, Kashi Kirti, Kashi Kiran) were also taken under study. A spacing of 3.0 m × 1.0 m was maintained, recommended and uniform agronomical practices were adopted to raise the crop. Observations were recorded on 5 randomly selected and tagged Plants from each genotype for all the characters. The mean values measured from these 5 plants were used for further statistical analysis, were carried out using R Studio software.
Result and Discussion
The principal component analysis is a precise statistical technique to present the large set of data in smaller components method. The large original set of data, containing many sets of variables can be reduced to a few numbers of components, termed as principal components. The first principal component contributes to the maximum variation in the data as possible, and every succeeding component account for a much of the remaining variability as possible (Singh and Narayanan, 2013) [6] . In present study, the principal component analysis of twenty-four genotypes of bottle gourd explained the genetic diversity, presented in table 1 and fig. 1. The highest variation was explained by PCA 1 (22.01%) with an eigen value of 1.93. The principal components PCA 2 (15.02%) with an eigen value of 1.59, PCA 3 (13.61%) with an eigen value of 1.52, PCA 4 (11.61%) with an eigen value of 1.40, PCA 5 (8.49%) with an eigen value of 1.20, PCA 6 (6.16%) with an eigen value of 1.02, PCA 7 (5.71%) with an eigen value of 0.99, PCA 8 (4.70%) with an eigen value of 0.89, and PCA 9 (4.30%) with an eigen value of 0.85 explained the variation. The remaining principal components contributed towards lesser proportion of the total variation. The distribution of the studied 24 accessions in the PCA scattered biplot (Fig. 2) was based on the relationship between the studied parameters using PC1 and PC2. The vectors begin at the origin (0,0) and extend to coordinates given by the loading vectors. The accessions positioned closer to the orign are lesser diverse as compared to the farther and are considered to be more superior for all the parameters studied. The accessions falling far from the origin in the positive X-Y axis and positive X negative Y-axis are inferior for the parameter studied. The distribution pattern in all four quadrants showed more or less uniform in their scattering. The forth quadrant comprises a maximum number of accessions ( 7), followed by the third and the first quadrant (6) and second quadrant (5). The principal component PCA 1 had positive effect with variables vine length (0.4655), internodal length (0.3794), number of nodes per plant (0.371), fruit yield per plant (0.3272), days to first fruit harvest (0.2892), average fruit weight (0.2556), days to first female flower anthesis (0.2303), days to first male flower anthesis (0.211), number of primary branches per plant (0.1951), dry matter content in fruits (0.1795), number of fruits per plant (0.1793) and node to first male flower appearance (0.0687) , while negative correlation with variables fruit diameter (-0.0052), fruit length (-0.0271), node to first female flower appearance (-0.0621), ascorbic acid in fruits (-0.1123), and antioxidant activity in fruits (-0.1541). The principal component PCA 2 had positive effect with variables days to first fruit harvest (0.3468), antioxidant activity in fruits (0.3084), days to first male flower anthesis (0.3031), days to first female flower anthesis (0.3019), fruit length (0.3015), internodal length (0.0393), number of primary branches per plant (0.018) and vine length (0.011) , while negative correlation with variables number of nodes per plant (-0.0252), node to first male flower appearance (-0.0831), dry matter content in fruits (-0.0914), average fruit weight (-0.1344), ascorbic acid in fruits (-0.1517), fruit diameter (-0.2886), fruit yield per plant (-0.3263), node to first female flower appearance (-0.3397), and number of fruits per plant (-0.3829). The principal component PCA 3 had positive effect with variables fruit diameter (0.4584), dry matter content in fruits (0.3396), internodal length (0.2506), days to first female flower anthesis (0.2137), days to first male flower anthesis (0.1805), node to first female flower appearance (0.1585) and days to first fruit harvest (0.1401), while negative correlation with variables vine length (-0.0005), ascorbic acid in fruits (-0.0552), antioxidant activity in fruits (-0.0674), average fruit weight (-0.122), number of fruits per plant (-0.1953), fruit yield per plant (-0.2092), number of primary branches per plant (-0.2497), node to first male flower appearance (-0.2511), number of nodes per plant (-0.267), and fruit length (-0.4331). The principal component PCA 4 had positive effect with variables node to first male flower appearance (0.3912), days to first female flower anthesis (0.355), ascorbic acid in fruits (0.353), average fruit weight (0.2883), antioxidant activity in fruits (0.2557), fruit diameter (0.2421), days to first male flower anthesis (0.2388), fruit yield per plant (0.2213), days to first fruit harvest (0.1206) and number of fruits per plant (0.1002), while negative correlation with variables number of nodes per plant (-0.0403), node to first female flower appearance (-0.1436), fruit length (-0.1483), dry matter content in fruits (-0.189), vine length (-0.1914), internodal length (-0.264), and number of primary branches per plant (-0.269). The principal component PCA 5 had positive effect with variables dry matter content in fruits (0.3724), fruit length (0.3361), average fruit weight (0.336), node to first female flower appearance (0.291), node to first male flower appearance (0.1576), number of nodes per plant (0.1506), vine length (0.0333) and days to first female flower anthesis (0.0332), while negative correlation with variables fruit yield per plant (-0.0006), ascorbic acid in fruits (-0.0044), days to first fruit harvest (-0.0243), internodal length (-0.1089), days to first male flower anthesis (-0.1268), fruit diameter (-0.1656), antioxidant activity in fruits (-0.1818), number of fruits per plant (-0.3939), and number of primary branches per plant (-0.5068). The principal component PCA 6 had positive effect with variables node to first male flower appearance (0.4692), ascorbic acid in fruits (0.4436), dry matter content in fruits (0.2514), fruit length (0.2354), days to first fruit harvest (0.2277), fruit diameter (0.1618), number of primary branches per plant (0.1428), number of fruits per plant (0.1145), number of nodes per plant (0.1016), node to first female flower appearance (0.1005), internodal length (0.0795) and vine length (0.0642), while negative correlation with variables days to first female flower anthesis (-0.0066), antioxidant activity in fruits (-0.074), days to first male flower anthesis (-0.1036), fruit yield per plant (-0.2836), and average fruit weight (-0.4747). The principal component PCA 7 had positive effect with variables ascorbic acid (0.3476), number of nodes per plant (0.3366), antioxidant activity (0.3223), vine length (0.3018), fruit diameter (0.1957), internode length (0.1819), average fruit weight (0.1210), while negative correlation with variables dry matter content in fruit (-0.0571) fruit yield (-0.1162), node of first male flower (-0.1248), days to first harvest (-0.1373), number of primary branches (-0.1370), fruit length (-0.1633), days to first male flower (-0.2529), number of fruits per plant (-0.3027), days to first female flower (-0.3122), and node of first female flower -0.3677). The principal component PCA 8 had positive effect with variables antioxidant activity (0.4755), node at first female flower (0.3319), node at first male flower (0.2798), days to first female flower (0.1743), days to first harvest (0.1633), internode length (0.1605), vine length (0.0988), fruit yield (0.0311), fruit diameter (0.0255), while negative correlation with variables number of nodes per plant (-0.0218), number of primary branches per plant (-0.0475), average fruit weight (-0.0577), number of fruits per plant (-0.0072), fruit length (-0.1244), dry matter content in fruit (-0.1842), ascorbic acid (-0.3979), and days to first male flower (-0.5268). The principal component PCA 9 had positive effect with variables node at first male flower (0.4268), dry matter content in fruit (0.3180), number of fruits per plant (0.1835), days to first male flower (0.1181), internode length (0.0576), antioxidant activity (0.0489), fruit diameter (0.0158), vine length (0.0011), while negative correlation with variables number of nodes per plant (-0.0195), fruit yield (-0.0472), fruit length (-0.0577), days to first female flower (-0.1164), average fruit weight (-0.1551), number of primary branches per plant (-0.2477), days to first harvest (-0.3571), ascorbic acid (-0.4512), node at first female flower (-0.4765). The results of the current inquiry are supported by the findings of Kalyanrao et al. (2016) [1] , who observed five principal components PC1, PC2, PC3, PC4 and PC5 with Eigen values 3.89, 2.75, 1.75, 1.47 and 1.36, respectively, accounting for 80.28% of the total variation. The first two principal components PC1 and PC2 with a proportion of 27.84% and 19.60%, respectively, contributed more to the overall variation. In further support to our findings, Shubha et al. (2019) [5] reported that the first two components were responsible for 36.77% of the phenotypic variability. The first principal component (PC1) accounted for 24.11% followed by second principal component (PC2) which accounted for 12.64% of the total variability. Principal component analysis (PCA) was carried out for factor extraction. The main advantage of using PCA over cluster analysis is to assign each accession to only one group (Mohammadi, 2002) [3] . The traits with the largest absolute value closer to unity within the first component influence the clustering than those with a lower absolute value closer to zero. Thus, in the present study differentiation of accessions into different components was because of the high contribution of the few traits rather than a small contribution of each trait. Our findings are useful, because it furnishes information about the groups, where certain traits are more important in allowing the breeder to execute the specific breeding program with a higher yield, other quality traits and mineral nutrients. Similarly, Morimoto et al. (2005), Mashilo et al. (2017) [2,4] performed the principal component analysis for various qualitative and quantitative traits in bottle gourd landraces.
| Traits | PCA 1 | PCA 2 | PCA 3 | PCA 4 | PCA 5 | PCA 6 | PCA 7 | PCA 8 | PCA 9 |
|---|---|---|---|---|---|---|---|---|---|
| DFMF | 0.2111 | 0.3031 | 0.1805 | 0.2388 | -0.1268 | -0.1036 | -0.2529 | -0.5268 | 0.1181 |
| DFFF | 0.2303 | 0.3019 | 0.2137 | 0.355 | 0.0332 | -0.0066 | -0.3122 | 0.1743 | -0.1164 |
| NFMF | 0.0687 | -0.0831 | -0.2511 | 0.3912 | 0.1576 | 0.4692 | -0.1248 | 0.2798 | 0.4268 |
| NFFF | -0.0621 | -0.3397 | 0.1585 | -0.1436 | 0.291 | 0.1005 | -0.3677 | 0.3319 | -0.4765 |
| DFH | 0.2892 | 0.3468 | 0.1401 | 0.1206 | -0.0243 | 0.2277 | -0.1373 | 0.1633 | -0.3571 |
| F L | -0.0271 | 0.3015 | -0.4331 | -0.1483 | 0.3361 | 0.2354 | -0.1633 | -0.1244 | -0.0577 |
| F D | -0.0052 | -0.2886 | 0.4584 | 0.2421 | -0.1656 | 0.1618 | 0.1957 | 0.0255 | 0.0158 |
| AFW | 0.2556 | -0.1344 | -0.122 | 0.2883 | 0.336 | -0.4747 | 0.121 | -0.0577 | -0.1551 |
| NFP | 0.1793 | -0.3829 | -0.1953 | 0.1002 | -0.3939 | 0.1145 | -0.3027 | -0.0072 | 0.1835 |
| NPP | 0.1951 | 0.018 | -0.2497 | -0.269 | -0.5068 | 0.1428 | -0.137 | -0.0475 | -0.2477 |
| NNP | 0.371 | -0.0252 | -0.267 | -0.0403 | 0.1506 | 0.1016 | 0.3366 | -0.0218 | -0.0195 |
| VL | 0.4655 | 0.011 | -0.0005 | -0.1914 | 0.0333 | 0.0642 | 0.3018 | 0.0988 | 0.0011 |
| IL | 0.3794 | 0.0393 | 0.2506 | -0.264 | -0.1089 | 0.0795 | 0.1819 | 0.1605 | 0.0576 |
| As A | -0.1123 | -0.1517 | -0.0552 | 0.353 | -0.0044 | 0.4436 | 0.3476 | -0.3979 | -0.4512 |
| An A | -0.1541 | 0.3084 | -0.0674 | 0.2557 | -0.1818 | -0.074 | 0.3223 | 0.4755 | 0.0489 |
| D M | 0.1795 | -0.0914 | 0.3396 | -0.189 | 0.3724 | 0.2514 | -0.0571 | -0.1842 | 0.318 |
| F Y | 0.3272 | -0.3263 | -0.2092 | 0.2213 | -0.0006 | -0.2836 | -0.1162 | 0.0311 | -0.0472 |
Table text extracted from the original PDF; superscript letters are shown inline. The original table image is below.
View original table image
Conclusion
This study utilized Principal Component Analysis (PCA) to evaluate genetic diversity among twenty-four bottle gourd genotypes. Nine principal components were identified, with PCA 1 and PCA 2 contributing the most to the total variation (22.01% and 15.02%, respectively). Key traits such as vine length, fruit yield, and flowering patterns significantly influenced the clustering of accessions. These findings provide a precise framework for breeders to select superior genotypes based on specific yield and quality traits, facilitating more targeted and effective breeding sprograms. Keywords: Bottle gourd, genetic diversity, principal component analysis (PCA)
References
8 in the original paper- Kalyanrao K, Tomar BS, Singh B, Aher BM. Morphological characterization of parental lines and cultivated genotypes of bottle gourd (Lagenaria siceraria). Indian J Agric Sci. 2016;86(1):65-70.
- Mashilo J, Shimelis HA, Odindo AO, Amelework BA. Genetic differentiation of bottle gourd [Lagenaria siceraria (Molina) Standl.] landraces assessed by fruit qualitative traits and simple sequence repeat markers. Sci Hortic. 2017;216:1-11.
- Mohammadi SA. Statistical methods in genetics. In: Proceedings of the Sixth International Conference of Statistics; 2002 Aug 26-28.
- Morimoto Y, Maundu P, Fujimaki H, Morishima H. Diversity of landraces of the white-flowered gourd (Lagenaria siceraria) and its wild relatives in Kenya: fruit and seed morphology. Genet Resour Crop Evol. 2005;52(6):737-747.
- Shubha K, Srivastava R, Gangopadhyaya KK, Rana JC. Diversity analysis of bottle gourd (Lagenaria siceraria [Molina] Standl.) germplasm by multivariate analysis. Veg Sci. 2019;46(1-2):50-55.
- Singh P, Narayanan. Biometrical techniques in plant breeding. 5th rev ed. New Delhi: Kalyani Publishers; 2013.
- Sultana S, Rahman MS, Ferdous J, Ahamed F, Chowdhury AK. Studies on genetic variability and interrelationship in bottle gourd [Lagenaria siceraria (Mol.) Standl.]. Int J Agric Res Innov Technol. 2018;8(1):14-17.
- Uddin MN, Islam AS, Bala SK, Islam GT, Adhikary S, Saha D, et al. Mapping of climate vulnerability of the coastal region of Bangladesh using principal component analysis. Appl Geogr. 2019;102:47-57.