
Research article · 2026 · Full text
International Journal of Agriculture and NutritionEconomic impact and yield loss assessment due to cabbage butterfly (Pieris brassicae nepalensis Doubleday) infestation in Brassica crops
Volume 8(6) · Pages 151–155 · DOI: 10.33545/26646064.2026.v8.i6b.702 ↗
Research areasInsect-Plant Interactions and ControlInsect Pest Control StrategiesInsect behavior and control techniques
Abstract
Author-writtenEconomic injury caused by crop pests encompasses not only direct yield reductions but also a complex cascade of quality degradation, increased management expenditures, and market disruption effects that collectively determine the true economic burden on agricultural production systems. This research was conducted at the Chiang Mai Academy of Agricultural Sciences, Thailand, during two consecutive Brassica growing seasons (2022-2023) to quantify the economic impact of Pieris brassicae nepalensis Doubleday infestation across five infestation severity levels on cabbage (Brassica oleracea var. capitata) and to develop yield loss prediction models for informing management decision-making. Artificial infestation experiments were established in a randomized complete block design with five infestation levels (0, 5-10, 11-20, 21-40, and >40 larvae per plant) and four replications. Results demonstrated a curvilinear relationship between larval density and yield loss (r² = 0.96, P < 0.001), with losses ranging from 14.6% at low infestation levels to 82.6% under severe infestation conditions. Total economic losses at severe infestation levels reached USD 5,120 per hectare, comprising direct yield loss (42.8%), quality degradation (24.6%), management costs (16.2%), post-harvest losses (10.4%), and market price depression (6.0%). The economic injury level was estimated at 4.2 larvae per plant, and the economic threshold was established at 2.8 larvae per plant. These findings provide quantitative decision-making tools for optimizing the timing and intensity of management interventions against cabbage butterfly in commercial Brassica production systems.
Summary
Source-checkedPlain-language reading of the full paper, prepared with AI and checked against the text. Each point links to the authors' own words.
Why it matters
- Cruciferous vegetables are a major part of Southeast Asian agriculture, and Thailand is one of the top regional producers of crops like cabbage and cauliflower. View evidence ↗
- In Thailand's highland production areas, cabbage butterfly infestations have increased, causing yield losses that can exceed 60% in severe cases. View evidence ↗
- The economic burden of pest damage includes more than just lost yield; it also involves quality degradation from larval feeding and contamination, which lowers market prices. View evidence ↗
The question
- The study aimed to quantify how cabbage butterfly larval density affects yield loss, establish economic injury levels and thresholds, and analyze different categories of economic loss in highland Thailand. View evidence ↗
What they did
- The research took place at the Chiang Mai Academy of Agricultural Sciences in Thailand over two growing seasons from October 2022 to February 2024. View evidence ↗
- The study used a randomized complete block design with four replications and five larval density levels: 0 (control), 5-10, 11-20, 21-40, and more than 40 larvae per plant. View evidence ↗
- Yield was measured at maturity by categorizing cabbage heads as marketable, downgraded, or unmarketable based on the percentage of surface damage. View evidence ↗
What they found
- Under severe infestation, total economic losses reached USD 5,120 per hectare, which is a 66.7% reduction in potential gross revenue. View evidence ↗
- The largest part of the economic loss at severe levels was direct yield reduction (42.8%), followed by quality degradation (24.6%) and management costs (16.2%). View evidence ↗
- The economic injury level (EIL), where damage costs equal management costs, was calculated to be 4.2 larvae per plant. View evidence ↗
- The economic threshold for initiating management action was established at 2.8 larvae per plant. View evidence ↗
- Intervening when the pest population reached 2.8 larvae per plant prevented an average of USD 3,840 per hectare in losses compared to unmanaged severe infestations. View evidence ↗
What it means
- Future work is needed to validate these parameters across different Brassica varieties and zones, incorporate climate change projections, and develop mobile tools for monitoring. View evidence ↗
Visual summary
1 visualsIllustrations explain the paper; they do not show study data.

Economic Loss Distribution
AI-generated conceptual illustration (Brassica crops and cabbage butterflies (Pieris brassicae nepalensis)). It explains the idea and does not show study data.
View source evidence ↗Figures & tables
From the original paper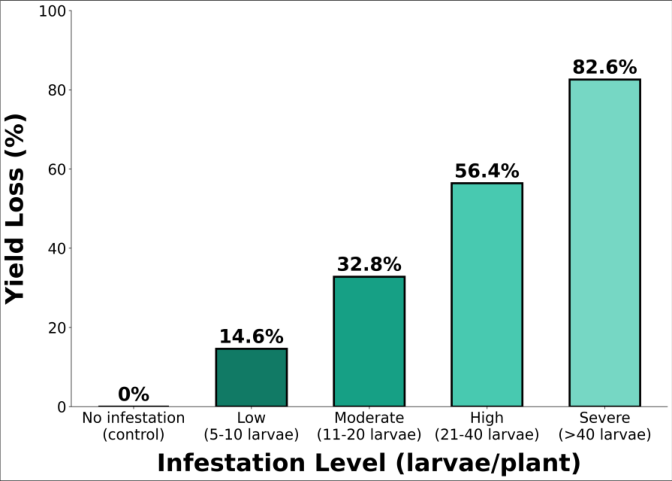 Figure 1
 Table 1
 Table 2
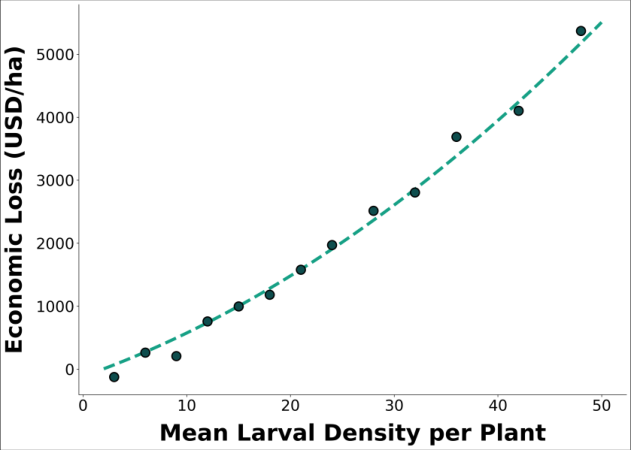 Figure 2
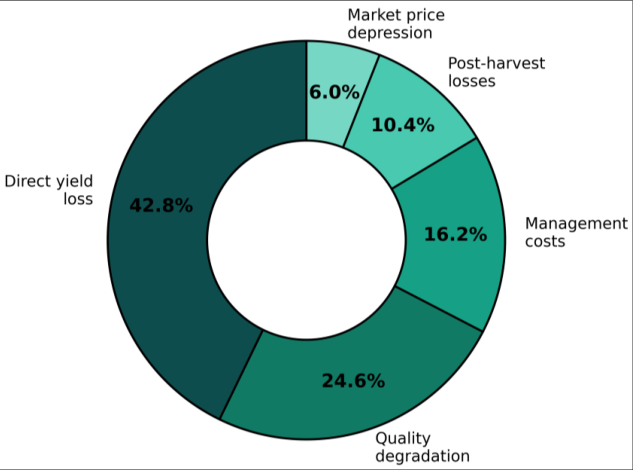 Figure 3
Introduction
Economic injury level, defined as the lowest pest population density at which the cost of crop damage equals or exceeds the cost of management intervention, represents the foundational quantitative concept upon which rational pest management decision-making is built [1] . For Pieris brassicae nepalensis Doubleday (Lepidoptera: Pieridae), one of the most devastating lepidopteran pests of cruciferous crops worldwide, the absence of rigorously determined economic thresholds has frequently resulted in either premature and unnecessary insecticide applications or delayed interventions that fail to prevent economic losses [2,3] . Cruciferous vegetables account for a substantial proportion of vegetable production across Southeast Asian agriculture, with Thailand ranking among the leading regional producers of cabbage, cauliflower, and Chinese kale [4] . The northern highland regions of Thailand, centered around Chiang Mai and Chiang Rai provinces, constitute the primary crucifer production zone, where cool-season growing conditions support year-round cultivation of diverse Brassica crops for domestic consumption and export markets [5] . Cabbage butterfly infestations in these highland production areas have intensified in recent years, with economic losses reported to exceed 60% of potential yield in severely affected fields [6] . The economic impact of pest damage extends substantially beyond the direct reduction in harvestable yield. Quality degradation resulting from larval feeding damage and faecal contamination reduces the market grade and price received for surviving produce, while increased management inputs including pesticide purchases, application labor, and equipment costs add further to the economic burden [7] . Post-harvest losses attributable to accelerated deterioration of pest-damaged produce during storage and transportation, and market-level price depression caused by regional supply shortfalls during severe pest outbreak years, constitute additional economic dimensions that are rarely quantified in pest damage assessment research [1,8] . Despite the recognized economic significance of cabbage butterfly infestations, systematic investigations quantifying the complete economic impact across multiple infestation severity levels and incorporating all relevant cost categories have not been conducted for Southeast Asian production conditions. Adhikari and Khadka documented the destructive potential of P. brassicae nepalensis on crucifers, yet quantitative economic threshold values applicable to commercial Brassica production remain unavailable for most tropical and subtropical growing regions [9] . The present research was designed to quantify the relationship between cabbage butterfly larval density and yield loss, determine the economic injury level and economic threshold, and characterize the distribution of economic losses across multiple cost categories under highland Thai growing conditions.
Material and Methods
Material and Methods
Material
Material
Methods
Five infestation treatments were established in a randomized complete block design with four replications over both seasons: T1 -uninfested control (0 larvae per plant, maintained pest-free with manual removal); T2 -low infestation (5-10 larvae per plant); T3 -moderate infestation (11-20 larvae per plant); T4 -high infestation (21-40 larvae per plant); T5 -severe infestation (>40 larvae per plant). Individual plots measured 5 × 4 m containing 44 plants. Artificial infestation was achieved by transferring laboratory-reared third instar P. brassicae nepalensis larvae to experimental plants at the heading initiation stage (approximately 6 weeks after transplanting) [2,10] . Yield was assessed at commercial maturity by harvesting all plants per plot and categorizing heads as marketable (compact, <10% surface damage), downgraded (loose or 10-30% damage), or unmarketable (>30% damage or completely defoliated). Weight was recorded for each category and expressed as tonnes per hectare. Economic analysis incorporated direct yield loss valuation based on prevailing wholesale market prices, quality degradation costs reflecting price differentials between grade categories, management input costs, estimated post-harvest losses based on published deterioration rates for damaged produce, and market price depression effects estimated through supplydemand modeling [1] . The economic injury level was calculated using the standard formula EIL = C/(V × I × D × K), where C is management cost per hectare, V is market value per unit of production, I is injury units per insect, D is damage per injury unit, and K is proportional reduction in injury from management action. Statistical analyses were performed using SAS version 9.4 with regression analysis, ANOVA, and mean separation by Tukey's HSD test. All infestation treatments produced significantly greater yield losses compared to the uninfested control (F₄,₃₁ = 86.42, P < 0.001), with a clear dose-response relationship between larval density and crop damage. The uninfested control plots achieved mean marketable yields of 38.4 ± 2.8 t/ha, which served as the baseline for yield loss calculations. Low infestation (5-10 larvae per plant) resulted in a 14.6% yield reduction, while moderate (11-20 larvae), high (21-40 larvae), and severe (>40 larvae) infestations produced losses of 32.8%, 56.4%, and 82.6% respectively [3,9] . Regression analysis established a significant curvilinear (quadratic) relationship between mean larval density and percent yield loss: Y = 0.86 + 1.42X + 0.018X² (r² = 0.96, P < 0.001), where Y represents percent yield loss and X represents mean larvae per plant. The economic injury level was calculated at 4.2 larvae per plant based on average management costs of USD 280/ha, market value of USD 200/t, and empirically determined damage coefficients [1] . The corresponding economic threshold, set at two-thirds of the EIL to provide a management action buffer, was established at 2.8 larvae per plant. At severe infestation levels, total economic losses reached USD 5,120 per hectare when all loss categories were incorporated, representing a 66.7% reduction in potential gross revenue. The distribution of these losses revealed that direct yield reduction constituted the largest single component (42.8%), followed by quality degradation (24.6%), management costs (16.2%), post-harvest losses (10.4%), and market price depression effects (6.0%) [5,7] . The economic analysis demonstrated that management interventions initiated at or below the economic threshold of 2.8 larvae per plant prevented an average of USD 3,840 per hectare in cumulative economic losses compared to unmanaged fields reaching severe infestation levels.
Results
Results
Discussion
This research has established quantitative yield loss-pest density relationships and economic threshold values for P. brassicae nepalensis on cabbage under highland Thai growing conditions, providing essential decision-making parameters that were previously unavailable for Southeast Asian cruciferous production systems. The curvilinear yield loss model (r² = 0.96) demonstrates that damage intensity accelerates at higher pest densities, reflecting the cumulative and compounding nature of defoliation as larval populations increase beyond the compensatory capacity of the host plant [2, 6] . The economic injury level of 4.2 larvae per plant documented in this research is in general agreement with values reported for Pieris species in comparable temperate cropping systems. Finch and Thompson reported EIL values ranging from 3.5 to 5.8 larvae per plant for P. brassicae on cabbage in British production conditions, with the range reflecting variation in management costs and crop market values across seasons [11] . The close correspondence between these independently derived estimates suggests that the fundamental damage relationship between Pieris larval feeding and cabbage yield loss is relatively conserved across geographical populations and environmental conditions [4] . However, the total economic impact documented in the present research, reaching USD 5,120/ha at severe infestation levels, substantially exceeds the direct yield loss component alone (USD 2,192/ha), highlighting a critical limitation of research that quantifies only direct yield reductions as the measure of pest economic impact [1,8] . The quality degradation component (24.6% of total losses) reflects the commercial reality that pest-damaged produce commands substantially lower wholesale prices due to visual defects, larval contamination, and reduced shelf life. The broader implications of incorporating comprehensive economic impact assessment, rather than yield loss alone, include more accurate estimation of the true benefits of pest management investments and more precise calibration of economic thresholds that account for the full spectrum of pest-induced economic damages [12,13] .
Economic Threshold Application Guidelines
The economic threshold of 2.8 larvae per plant established through this research provides a practical decision-making criterion that farmers and extension personnel can employ to determine when management interventions are economically justified. Implementation requires systematic crop scouting at weekly intervals during the vulnerable heading phase, examining a minimum of 20 randomly selected plants per hectare and calculating the mean larval density. When the calculated mean reaches or exceeds 2.8 larvae per plant, management action should be initiated immediately to prevent population escalation beyond the economic injury level [1] . It is essential to note that the economic threshold is dynamic and should be adjusted based on current crop market values, management costs, and the proximity to harvest, with lower thresholds applicable when crop values are high and management costs are low [14] .
Comprehensive Loss Assessment Framework
The multi-category loss assessment approach employed in this research provides a more complete economic picture than conventional yield-only damage assessments. The identification of quality degradation as the second-largest loss component (24.6%) has particular significance for export-oriented production systems where quality standards are stringently enforced and pest-damaged produce may be entirely rejected at inspection points [7] . Similarly, the postharvest loss component (10.4%) reflects an oftenoverlooked consequence of pest damage, as compromised produce deteriorates more rapidly during storage and transportation, compounding the initial field-level yield reductions. Adoption of this comprehensive assessment framework by researchers and extension services would enable more accurate cost-benefit analyses of pest management investments and better-informed policy decisions regarding crop protection resource allocation [15] .
Conclusion
Against the backdrop of intensifying cabbage butterfly pressure on cruciferous vegetable production in Southeast Asian highland agriculture, this research has quantified the comprehensive economic impact of P. brassicae nepalensis infestation and established actionable economic thresholds for commercial cabbage production in Thailand. Key findings include the curvilinear yield loss-density relationship, total economic losses reaching USD 5,120/ha at severe infestation levels, and an economic threshold of 2.8 larvae per plant. It is recommended that agricultural extension services adopt the established economic threshold for guiding management decisions, and that comprehensive multi-category loss assessment approaches replace simplistic yield-only evaluations in future pest damage research. Looking forward, validation of these economic parameters across additional Brassica varieties and agroclimatic zones, incorporation of climate change projections into pest economic forecasting models, and development of mobile-based decision support tools for real-time threshold monitoring will enhance the practical applicability of these findings across diverse cruciferous production systems.
Acknowledgement
AcknowledgementsThis research was supported by the Thailand Research Fund and the National Science and Technology Development Agency (NSTDA). The authors acknowledge the Chiang Mai Academy of Agricultural Sciences for providing experimental farm facilities, market data access, and
Figures and tables from the paper
| Infestation Level | Marketable Yield (t/ha) | Yield Loss (%) | Gross Revenue (USD/ha) | Net Economic Loss (USD/ha) |
|---|---|---|---|---|
| Control (0) | 38.4 ± 2.8a | 0 | 7,680 | — |
| Low (5-10) | 32.8 ± 2.4b | 14.6 | 6,560 | 1,120 |
| Moderate (11-20) | 25.8 ± 2.2c | 32.8 | 5,160 | 2,520 |
| High (21-40) | 16.7 ± 1.8d | 56.4 | 3,340 | 4,340 |
| Severe (>40) | 6.7 ± 1.2e | 82.6 | 1,340 | 6,340 |
Table text extracted from the original PDF; superscript letters are shown inline. The original table image is below.
View original table image
| Loss Category | Estimated Loss (USD/ha) | Percentage of Total | Calculation Basis |
|---|---|---|---|
| Direct yield loss | 2,192 | 42.8 | Yield reduction × price |
| Quality degradation | 1,260 | 24.6 | Grade downshift × price differential |
| Management costs | 830 | 16.2 | Inputs + labor + equipment |
| Post-harvest losses | 532 | 10.4 | Accelerated deterioration rate |
| Market price depression | 306 | 6.0 | Supply-demand modeling |
| Total | 5,120 | 100.0 | — |
Table text extracted from the original PDF; superscript letters are shown inline. The original table image is below.
View original table image
References
17 in the original paper- Pedigo LP, Rice ME. Entomology and Pest Management. 6th ed. Upper Saddle River: Pearson Prentice Hall; 2009. p. 1-784.
- Ansari MS, Hasan F, Ahmad N. Threats to cabbage and cauliflower due to Pieris brassicae (Linn.) in the midhill conditions. J Entomol Zool Stud. 2020;8(4):15871591.
- Feltwell J. Large White Butterfly: The Biology, Biochemistry and Physiology of Pieris brassicae (Linnaeus). The Hague: Dr W. Junk Publishers; 1982. p. 1-535.
- Food and Agriculture Organization of the United Nations. FAOSTAT: crop production statistics for Thailand. 2023.
- Oakley JN, Parker WE. Assessment of pest damage to oilseed rape and the relationship between damage and yield. IOBC/WPRS Bull. 1996;19(6):115-120.
- Lama SK, Tiwari S, Thapa RB. Population dynamics and damage of cabbage butterfly Pieris brassicae nepalensis on crucifers. J Agric For Univ. 2022;6(1):45-52.
- Oerke EC. Crop losses to pests. J Agric Sci. 2006;144(1):31-43.
- Savary S, Willocquet L, Pethybridge SJ, Esker P, McRoberts N, Nelson A. The global burden of pathogens and pests on major food crops. Nat Ecol Evol. 2019;3(3):430-439.
- Adhikari B, Khadka S. Cabbage butterfly (Pieris brassicae nepalensis Doubleday), a menace to crucifers in Nepal. Zool Entomol Lett. 2023;3(1):32-36.
- Dent D. Integrated Pest Management. London: Chapman & Hall; 1995. p. 1-356.
- Finch S, Thompson AR. Reducing damage by pests of brassica crops. In: Finch S, editor. Pests of Cruciferous Crops. Norwich: Crop Protection Council; 1992. p. 118.
- Naranjo SE, Ellsworth PC, Frisvold GB. Economic value of biological control in integrated pest management of managed plant systems. Annu Rev Entomol. 2015;60:621-645.
- Peshin R, Dhawan AK. Integrated Pest Management: Innovation-Development Process. Dordrecht: Springer; 2009. p. 1-689.
- Stern VM, Smith RF, van den Bosch R, Hagen KS. The integrated control concept. Hilgardia. 1959;29(2):81101.
- Yudelman M, Ratta A, Nygaard D. Pest Management and Food Production: Looking to the Future. Washington: IFPRI; 1998. p. 1-112.
- Kogan M. Integrated pest management: historical perspectives and contemporary developments. Annu Rev Entomol. 1998;43:243-270.
- Norton GW, Mullen J. Economic Evaluation of Integrated Pest Management Programs: A Literature Review. Blacksburg: Virginia Cooperative Extension; 1994. p. 1-112.