
Research article · 2026 · Full text
International Journal of Geography Geology and EnvironmentThe possibility of investing solar energy in generating electricity in Diyala Governorate using GIS
Volume 8(7) · Pages 158–166 · DOI: 10.22271/27067483.2026.v8.i7b.817 ↗
Research areasSolar Radiation and PhotovoltaicsSolar Thermal and Photovoltaic SystemsPhotovoltaic Systems and Sustainability
Abstract
Author-writtenSolar radiation is one of the best sources of energy because it is free, clean, permanent, and does not cause environmental pollution as fossil fuel-based energy sources do. This research aims to examine the natural characteristics and climatic elements affecting solar radiation, as well as the efficiency of solar panels in Diyala Governorate. It also explores some of the applications of these panels, identifies the factors influencing solar energy investment in the study area, and highlights their role in addressing the shortage of electrical power through the utilization of solar energy.
Summary
Source-checkedPlain-language reading of the full paper, prepared with AI and checked against the text. Each point links to the authors' own words.
Why it matters
- Solar radiation is considered a superior energy source because it is clean, free, and permanent, avoiding the environmental pollution associated with fossil fuels. View evidence ↗
- Diyala Governorate has significant solar radiation, presenting an opportunity to address government electrical power shortages through solar energy investment. View evidence ↗
The question
- The research investigates whether the natural characteristics of Diyala Governorate are suitable for solar power plants and identifies potential areas for solar energy investment. View evidence ↗
What they did
- The study analyzed climatic data from the Khanaqin station within the administrative boundaries of Diyala Governorate over a 33-year period from 1989 to 2022. View evidence ↗
What they found
- Theoretical brightness in Khanaqin peaked in June at 14.09 hours per day and reached its minimum in December at 10.15 hours per day. View evidence ↗
- Actual brightness hours were highest in summer (June: 10.1, July: 11.4, August: 11.0 hours/day) and lowest in winter (December: 6.2, January: 6.4, February: 7.4 hours/day). View evidence ↗
- Annual total solar radiation at Khanaqin station ranged from a low of 406.6 mW/cm²/day in 2011 to a high of 478.5 mW/cm²/day in 2021. View evidence ↗
- Monthly solar radiation peaked in June (637.1 mW/cm²/day) and July (627.9 mW/cm²/day), and was lowest in December (227.8 mW/cm²/day) and January (248.9 mW/cm²/day). View evidence ↗
- Cloud frequency was highest in December (3.3) and lowest in June (1.0). View evidence ↗
- Dust storm frequency peaked in June at 3.9 storms per day and was lowest in January at 0.2 storms per day. View evidence ↗
- Relative humidity was highest in January (70.2%) and lowest in July (20.1%). View evidence ↗
- Solar radiation showed a direct relationship with relative humidity (0.75), actual brightness hours (0.64), and rainfall (0.50). View evidence ↗
- Climatic phenomena including dust storms, rising dust, and suspended dust had an inverse relationship with solar radiation, with suspended dust having the strongest effect (-0.22). View evidence ↗
- Field studies found residential solar systems costing 4.5 million dinars that provide approximately 10-14 amperes using batteries. View evidence ↗
- Some agricultural irrigation systems utilize 18 cells (three systems of six cells each) of 540 watts per cell, operating without batteries. View evidence ↗
What it means
- The authors conclude that the high rates of solar radiation in the study area justify investing in solar energy for electricity production. View evidence ↗
- The authors recommend promoting solar energy culture and establishing specialized centers with support from various government ministries. View evidence ↗
Visual summary
2 visualsIllustrations explain the paper; charts are replotted from the paper's own table values.
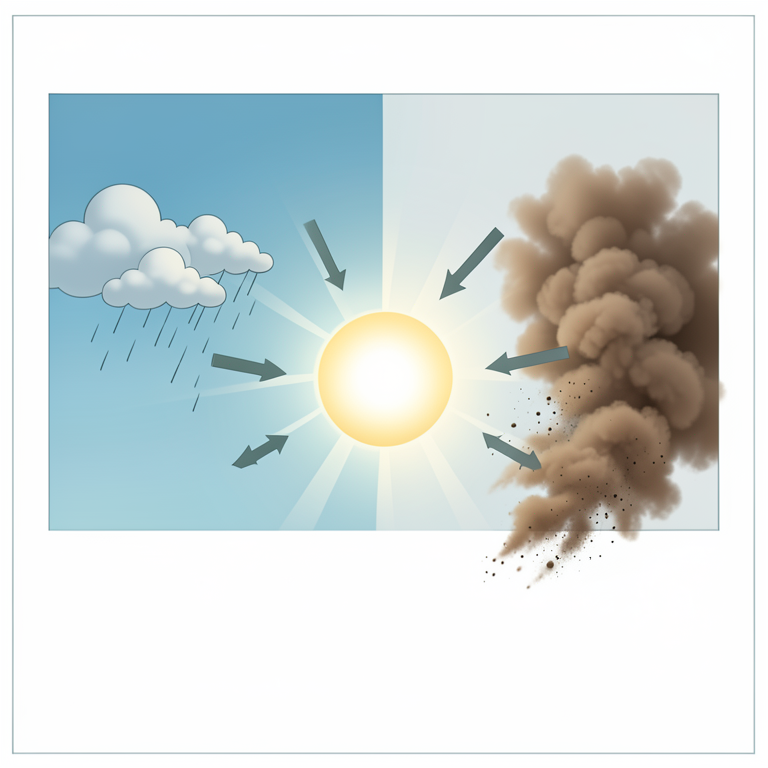
Climatic Factors and Solar Radiation Correlation
AI-generated conceptual illustration (Solar radiation and atmospheric particles over a landscape in Diyala Governorate). It explains the idea and does not show study data.
View source evidence ↗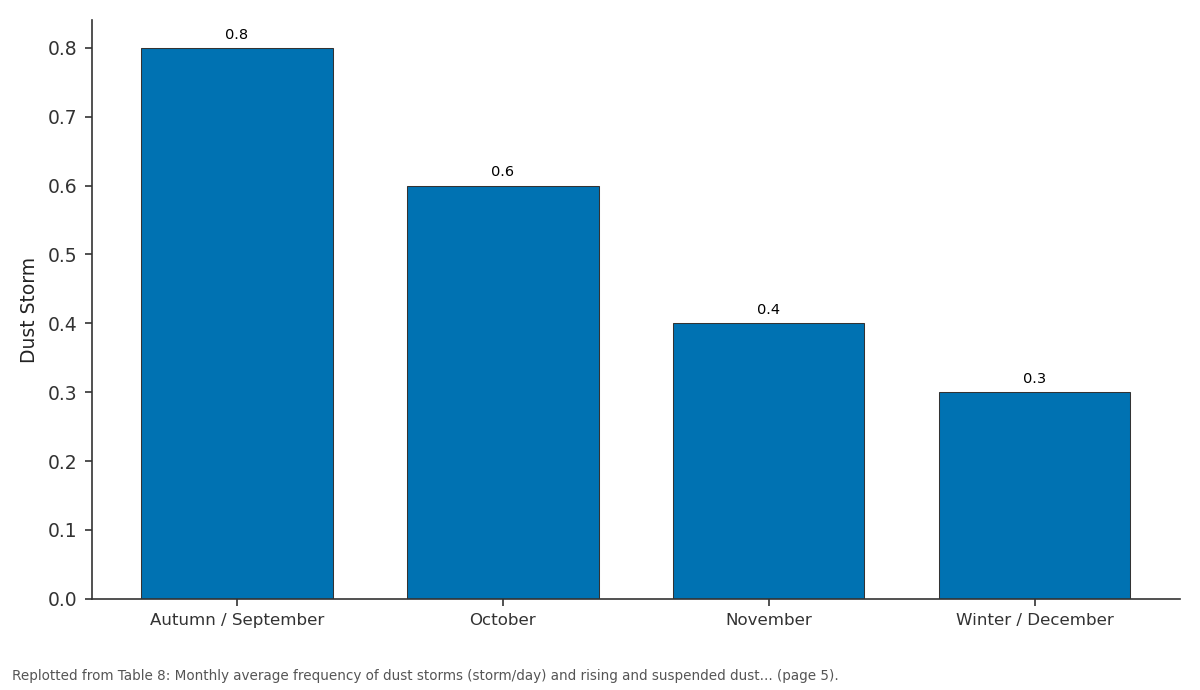
Dust Storm: Autumn / September vs October vs November vs Winter / December
Replotted from Table 8 (page 5) of the original paper. Every bar is the paper's own table value.
View source evidence ↗Figures & tables
From the original paper Table 1
 Table 2
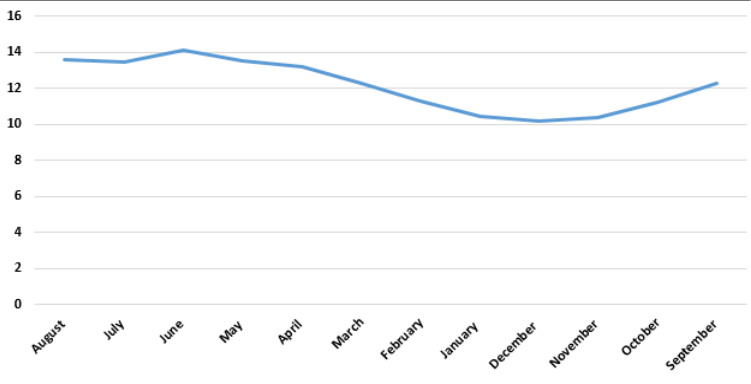 Figure 1
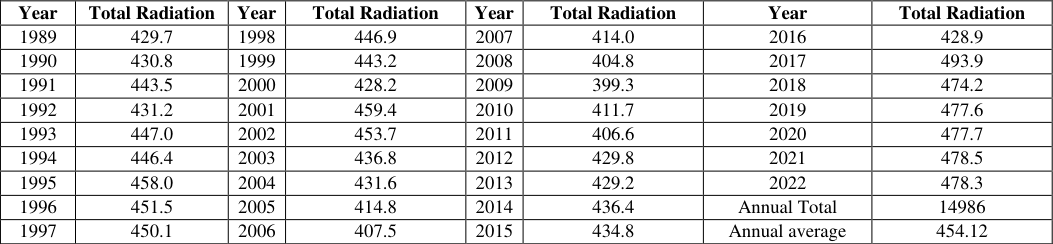 Table 3
 Table 4
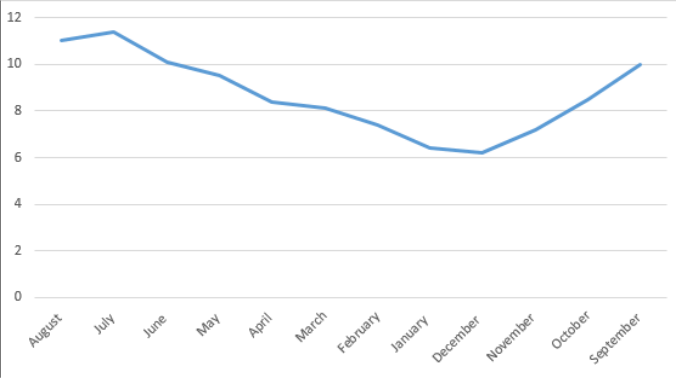 Figure 2
 Table 5
 Table 6
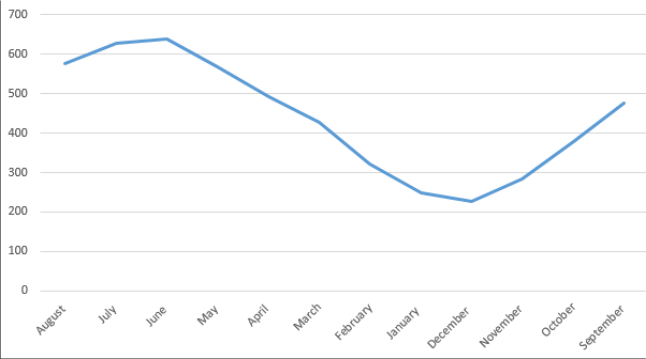 Figure 3
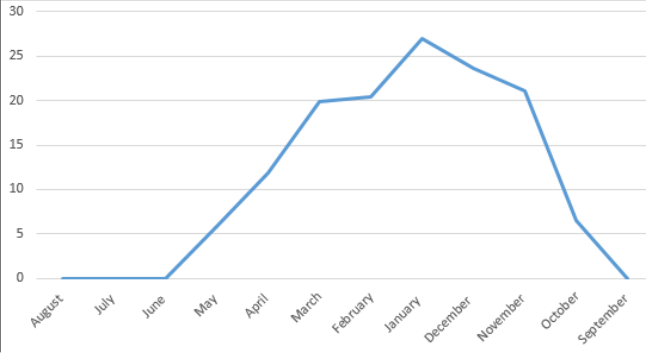 Figure 4
 Table 7
 Table 8
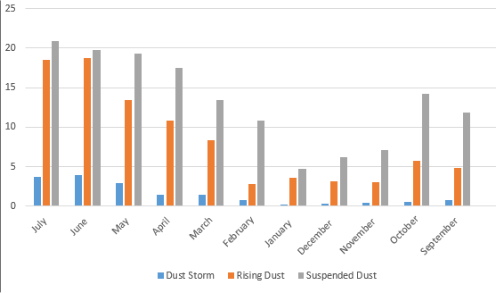 Figure 5
 Table 9
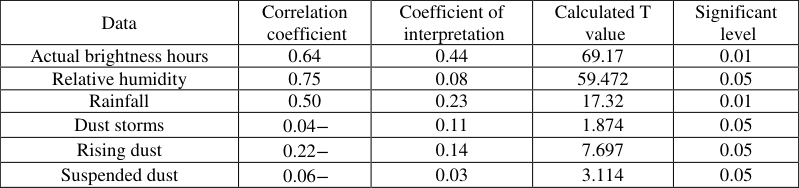 Table 10
Introduction
Research problem: Are the natural characteristics of Diyala Governorate suitable for the construction of electric power plants? What are the nature and areas of use and investment of Sun energy in it?
Research hypothesis: Diyala province has natural characteristics suitable for the establishment of solar power plants, with multiple areas of use and investment of Sun energy.
Search limits:
The spatial boundaries are the administrative boundaries of Diyala Governorate, which are astronomically located between the latitudes of 3 (33° and 35°) north and longitudes (22 ° 44) and 56 (45 °) east, while the geographical boundaries are located in the center east of Iraq, bordered to the east by the Islamic Republic of Iran, to the south by Wasit province, to the west by Baghdad, to the northwest by Salah al-Din province, and to the north by the province of Sulaymaniyah Governorate, and within its administrative boundaries are two climatic stations, the Khanaqin monitoring station, which is located in the northwestern part, and the Khalis monitoring station, which is located in the southwest of the province, The area of Diyala Governorate is (17685) km2, meaning that it occupies an area of (4.1%) of the total area of Iraq of (434128) km2 () See map (1), while the temporal boundaries are represented by the climatic data of the Khanaqin station for a major climate cycle of (33) years starting from (1989) and ending in (2022).
Factors affecting the intensity of radiation
These include hours of sunshine and length of day. Theoretical brightness hours: It is the average length of the luminous daylight hours, which vary temporally and spatially, as they are affected by the rotation of the earth around itself and the apparent movement of the sun (), and it is shown from Table (1) and Figure (1) that the highest rate of theoretical brightness in Khanaqin station (14.09) hours / day in the month of June is due to the clarity of the sky and the verticality of the sun in this month, while the month of December recorded the lowest rate of (10.15) hours / day. Actual brightness hours: It is the period in which the disk of the sun is seen bright in the day, as it is not related to the length or shortness of the day, as the day may be long, but it is full of clouds and vice versa, and the actual brightness affects the amount of solar radiation reaching the earth (), and it is clear from Table (2) and
The intensity of calculated solar radiation
The values of the calculated total radiation vary between months and seasons, depending on the angle of incidence of solar radiation, the length of the day and the clarity of the atmosphere, and it is shown from Table (3) that the highest annual rate was recorded in 2021 by (478.5) milliwatts / cm 2 / day, while in 2011 the lowest rate was (406.6) milliwatts / cm 2 / day, and at the level of the monthly average, and show from Table (4) and Figure (3) that the months of June and July recorded the highest rates, which are (637.1) mW/cm2/day and (627.9) mW/cm2/day respectively, while the lowest values were in the months of December and January, recording (227.8) mW/cm2/day and (248.9) mW/cm2/day respectively.
Daytime length:
The difference in the length of the day plays a major role in the variation of the amount of solar radiation reaching the surface of the earth, and the difference in the length of the day increases with increasing the degree of width (), and the long day is compensated for in a Summer season in Diyala province because the rays are vertical or close to vertical, but in the winter months, the small length of the day reduces the amount of Sun radiation reaching the study area. Transparency of the atmosphere: It is the absence of clouds, impurities, smoke and dust, and it is one of the important factors in determining the amount of solar radiation reaching the surface of the earth, the air contains aerosols that greatly affect the process of absorption, cattering and reflection of rays, and therefore the time when pollutants increase in Diyala Governorate, the percentage of solar radiation to it is less ().
Clouds: Clouds reduce the amount of solar radiation reaching the surface of the earth, especially in the winter months, and they regulate the entry and exit of terrestrial radiation between the earth and the upper layers of the atmosphere due to the factors of absorption, spread and reflection that scatter and scatter solar radiation before it reaches the surface of the earth, when the number of cloudy days increases, the amount of solar radiation reaching the earth decreases and vice versa, Therefore, the most important thing that should be taken into account when installing solar panels is the percentage of covering the sky with clouds and the type of influential clouds, and therefore the greater the quantities of clouds, the less the possibility of investing the solar energy necessary to provide electrical energy (), and it follows from this that clouds are of great importance in the amount of solar radiation and its distribution in Diyala Governorate, as the large number of clouds in Diyala Governorate in winter reduces the solar energy connecting, and it is clear from Table (5) that the highest frequency of clouds was in the month of December The second reached (3.3), while the month of June recorded the lowest Repetition of (1.0), and the spring months came in the frequencies of clouds in them, and the highest was in April by (2.9) and then March ((2.8). Rainfall: It is a Precipitation in which the size of water droplets exceeds (0.5) mm and its intensity is less than (0.1) mm / hour, and its quantity is related to the number and type of clouds and the frequency of depressions (), and Through Table (6) and Figure (4), it is clear that the total annual rainfall in Khanaqin station for the duration of the study was (136.2) mm, and it is clear from the same table that the highest amount of rain fell in January, which is (27.0) mm, while no rain fell in the months of summer Season and September Month. Therefore, it can be said that rain in Diyala province has a positive impact on solar radiation, as when rain falls, the atmosphere is cleaned of plankton and impurities, which helps to clear the atmosphere, as well as other effects such as soil stabilization and non-volatilization, reducing the amount of dust and other suspended materials, and helping to grow the natural plant. Fog: It is small particles of water vapor suspended in the air that reduce the range of visibility, and this varies according to the type and density of fog (), There for Fog affects solar radiation and works to block and reduce the amount of solar radiation to Diyala Governorate and absorbs part of it and allows the other part to pass, so the amount of solar radiation arriving is low on foggy days, and it also does not encourage the installation of solar cells in areas where fog is permanent, but the study area does not constantly occur fog If it occurs, it is in warm nights and early mornings, and quickly dissipates with sunrise or gusts of wind, and its impact on the work of solar systems is weak unless it is dense, and it is clear from Table (7) that the frequency of the fog phenomenon records the highest frequencies in the winter months, as they were in December, January and February (1.6, 1.6, 0.6) respectively, and the summer months did not record any recurrence of the fog phenomenon. Dust phenomena (dust storm, rising dust, suspended dust): Dust phenomena are known as the process of raising dust particles from the surface of the earth, causing a deterioration in the range of visibility, and this process is done with the help of wind speed and its pressure force concentrated on the surface more than the force of gravity of the surface, and this causes the excitement of dust particles and their rise (), As for the dust storm, it consists of winds with a speed of not less than (11) m / s and works to sediment and transport materials of different sizes (dirt atoms, sand and sediments) forming clouds of dust and causing a decrease in visibility, and it is shown from Table (8) and Figure (5) The most months in which dust storms occur are the months of spring and summer, the study station recorded the highest rate in June and was (3.9) storm / day, while the lowest months were January, as it recorded (0.2) Storm/day, From the same table and figure, it is clear that the highest frequency of rising dust was in the month of June, as it recorded ((18.7 days), while the month of February recorded the lowest frequencies by (2.8) days, and the recurrences of rising dust in the months come after the repetitions of the summer months, while the suspended dust recorded the summer months (June, July and August) the highest frequencies were (19.8, 20.9, 20.6) days respectively, while the months (November, December and January) recorded the lowest repetitions of suspended dust and were (7.1, 6.2, 4.7) A day in a row. Relative humidity: It is the percentage of vapor actually present in the air and the amount of water needed under the same pressure and temperature(),and the higher the relative humidity, the greater its impact on the amount of solar radiation, and the relative humidity varies between the months of the year in Khanaqin station, so the winter months record the highest rates, foremost of which is January, which records (70.2)%, while the summer months record the lowest values, foremost of which is July, which records (20.1)%, and accordingly, relative humidity has a significant impact on solar radiation and renewable energy in Diyala Governorate, See Table (9).
Source: Researcher based on Table (8) and Excel program. Albedo: A term that means whiteness, and describes the bright or bright thing, and it can be said that the greater the proportion of albedo for the surface on which solar radiation falls, the less the amount of solar radiation (), So, The Impurities, ice crystals, water droplets suspended in the atmosphere and clouds have an important role in reflecting part of the solar radiation, and the reflection coefficient increases with increasing thickness, height or proximity to the surface of the earth, as it reaches (21)% if the clouds are of high height, and (48)% in medium clouds, while it is estimated at (69)% in low clouds (). Topography: The surface affects the amount of solar radiation received, as the smooth polished surfaces reflect solar radiation greater than the rough surfaces, so the reflection coefficient in the flat plain areas exceeds the reflection coefficient in the rugged plateaus and mountains, and with regard to Diyala province, most of its lands are flat except for the northeastern region, which is covered by mountains, Therefore, its southern slopes receive the largest amount of solar radiation from its northern slopes, and thus the slopes of the mountains can be used in the process of installing solar panel systems after knowing the degree of their slope and inclination.
Correlation between Sun radiation and the factors affecting it:
Pearson's correlation coefficient was adopted to measure the degree of correlation between quantitative variables (), Pearson's correlation coefficient (r) ranges between (+1) and (-1) if it is close to (+1) it is a direct relationship and if it is close to (-1) it is an inverse relationship, but if the correlation coefficient is (zero), this indicates that there is no relationship between the two variables, and through the application of this coefficient to the data of the study area and through Table (10) it is clear that three of the variables, which are climatic phenomena, are inversely trending, namely (dust storms, suspended dust and rising dust) and it is clear that the suspended dust is, Its effect is greater than other phenomena on solar radiation, although the relationship is inverse (-0.22) and the rising dust and dust storm come after it, while the elements (actual brightness hours, rain and relative humidity) are a direct relationship, so the correlation of the actual brightness hours was (0.64), which is a medium direct relationship to rise in the relative humidity relationship, as it was (0.75), while the rain relationship was (0.50), which is a weak direct relationship, So, the tabular value of (T) (1.603) was less than the calculated value of (T), which means that there is statistical significance for this Model is at a degree of freedom (29) and a level of significance (95)% and thus accepting the null hypothesis (H0) for the studied climatic station, which is the Khanaqin station. The researchers based on the data of tables (2), (3), ( 4), ( 6), ( 8), ( 9), Pearson's equation (r) and the equation of interpretation (R2).
Solar Energy Uses in Diyala Governorate
Diyala Governorate enjoys large amounts of Sun radiation, which requires serious thinking about exploiting radiation to generate electrical energy to reduce the lack of government electrical power supply, but the use of clean energy in Diyala Governorate is limited and low, and this is due to the absence of specialized research institutions and centers, and it can be said that there is a timid trend to invest clean energy in Diyala Governorate in recent years, and among the forms of energy uses in Diyala Governorate are the following: The use of solar energy in homes: The frequent government power outages and the high and low temperatures in summer and low temperatures in winter led to the need to use solar panels in the study area, so they are used on the roofs of houses to generate electrical energy in order to benefit from it in domestic use such as heating water in winter and cooling buildings in summer, as well as for the purpose of lighting, fans and other electrical appliances, So, Through the field study and through the questions addressed to the homeowners, it was found that the houses are equipped with three systems at a price of (4.5) million dinars, which provides about (10)(11)(12)(13)(14) amperes with the presence of batteries, note picture (1). However, these systems depend directly on the electrical energy that works to operate water pumps in the pipes, and because the electrical energy is oscillating, it has become necessary to use clean energy from solar radiation to provide what these systems need, and solar energy has been used in irrigation systems in Diyala Governorate, Through the implementation of some projects such as drip irrigation systems mediated by the use of solar panels, and through the field study, some farms were monitored that operate fully based on solar energy, and three systems have been installed and each system has six cells with a total of (18) cells, and each cell (540) watts and the cells work during the day without batteries and their cost is lower, and through that many cultivated lands have been irrigated, note picture (2). The use of solar energy in irrigation systems (drip): Given that Iraq in general and Diyala Governorate in particular suffer from the problems of water scarcity, drought and power outages, it has become necessary to adopt modern irrigation methods such as sprinkler and drip irrigation systems, The use of solar energy in street lighting and surveillance cameras: Due to the frequent power cuts, a group of lighting poles that work on solar energy have been installed through cells installed at the top of the column See Picture (3), and with the presence of a sensor cell that separates the current from the lamps autonomously when sunlight appears, and this process is reverse at night when the sunlight disappears, the lamps work autonomously, as for the surveillance cameras, due to the security situation in Diyala province, the need to use modern technology, including cameras, has been deployed, some control towers on which cameras are installed have been deployed in the streets and important intersections relying on solar energy, which is important and helped reduce crimes and terrorist operations See image (4). 5), As for the use of solar energy in government institutions and departments, it is represented by two projects representing the Technical Institute -Baquba, the first project that was implemented for the purpose of relying entirely on solar energy in the supply of electricity, as (56) solar cells with a capacity of (20 KVA) were installed with the (Off Grid) system, a system that is generated by rotation with government electricity (), So, The second project is in the Faculty of Engineering and the Faculty of Science at the University of Diyala, where (6) solar cells were installed, each cell capacity (250 watts), and the kidneys work with a solar cell system, as they are provided with electricity by solar cells naturally and easily see picture (6). The study area enjoys high rates of falling solar radiation, and this calls for investing it in the production of electrical energy. 2. The elements and phenomena of climate have a significant impact on radiation and solar panels in Diyala Governorate, as well as the effect of the direction of cell placement and the degree of inclination on the strength of solar radiation.
Sun cells can be used in many activities and fields in
Diyala Governorate, such as irrigation systems, street lighting, cameras, surveillance, institutions, government departments, etc. 4. Through the application of Pearson's correlation coefficient, it was found that there is a direct relationship between the calculated solar radiation and climatic elements and inverse with climatic phenomena.
Recommendations
1. Spreading the culture of using Sun energy with the opening of specialized centers with the support of the Ministries of Higher Education, Scientific Research, Electricity, Culture and Information.
Government support for energy projects in Diyala
Governorate, as well as providing Sun cells and related devices at good prices and subsidized.
3. Establishing stations to measure the total and widespread solar radiation in Diyala Governorate, specifically the district centers.
Figures and tables from the paper
| Autumn | — | — | Winter | — | — | Spring | — | — | Summer | — | — | Annual Average |
|---|---|---|---|---|---|---|---|---|---|---|---|---|
| September | October | November | December | January | February | March | April | May | June | July | August | |
| 12.25 | 11.23 | 10.38 | 10.15 | 10.44 | 11.32 | 12.25 | 13.19 | 13.52 | 14.09 | 13.43 | 13.58 | 12.15 |
Table text extracted from the original PDF; superscript letters are shown inline. The original table image is below.
View original table image
| Autumn | — | — | Winter | — | — | Spring | — | — | Summer | — | — | Annual Average |
|---|---|---|---|---|---|---|---|---|---|---|---|---|
| September | October | November | December | January | February | March | April | May | June | July | August | |
| 10.0 | 8.5 | 7.2 | 6.2 | 6.4 | 7.4 | 8.1 | 8.4 | 9.5 | 10.1 | 11.4 | 11.0 | 9.08 |
Table text extracted from the original PDF; superscript letters are shown inline. The original table image is below.
View original table image
| Year | Total Radiation | Year | Total Radiation | Year | Total Radiation | Year | Total Radiation |
|---|---|---|---|---|---|---|---|
| 1989 | 429.7 | 1998 | 446.9 | 2007 | 414.0 | 2016 | 428.9 |
| 1990 | 430.8 | 1999 | 443.2 | 2008 | 404.8 | 2017 | 493.9 |
| 1991 | 443.5 | 2000 | 428.2 | 2009 | 399.3 | 2018 | 474.2 |
| 1992 | 431.2 | 2001 | 459.4 | 2010 | 411.7 | 2019 | 477.6 |
| 1993 | 447.0 | 2002 | 453.7 | 2011 | 406.6 | 2020 | 477.7 |
| 1994 | 446.4 | 2003 | 436.8 | 2012 | 429.8 | 2021 | 478.5 |
| 1995 | 458.0 | 2004 | 431.6 | 2013 | 429.2 | 2022 | 478.3 |
| 1996 | 451.5 | 2005 | 414.8 | 2014 | 436.4 | Annual Total | 14986 |
| 1997 | 450.1 | 2006 | 407.5 | 2015 | 434.8 | Annual average | 454.12 |
Table text extracted from the original PDF; superscript letters are shown inline. The original table image is below.
View original table image
| Autumn | — | — | Winter | — | — | Spring | — | — | Summer | — | — | Annual Average |
|---|---|---|---|---|---|---|---|---|---|---|---|---|
| September | October | November | December | January | February | March | April | May | June | July | August | |
| 477.2 | 379.7 | 282.5 | 227.8 | 248.9 | 322.1 | 427.1 | 491.7 | 568.4 | 637.1 | 627.9 | 577.1 | 438.95 |
Table text extracted from the original PDF; superscript letters are shown inline. The original table image is below.
View original table image
| Autumn | — | — | Winter | — | — | Spring | — | — | Summer | — | — | Annual Average |
|---|---|---|---|---|---|---|---|---|---|---|---|---|
| September | October | November | December | January | February | March | April | May | June | July | August | |
| 1.2 | 2.4 | 2.6 | 2.9 | 3.3 | 2.8 | 2.8 | 2.9 | 2.5 | 1.0 | 0.6 | 0.7 | 2.1 |
Table text extracted from the original PDF; superscript letters are shown inline. The original table image is below.
View original table image
| Autumn | — | — | Winter | — | — | Spring | — | — | Summer | — | — | Annual Average |
|---|---|---|---|---|---|---|---|---|---|---|---|---|
| September | October | November | December | January | February | March | April | May | June | July | August | |
| 0.0 | 6.5 | 21.1 | 23.6 | 27.0 | 20.4 | 19.9 | 11.9 | 5.8 | 0.0 | 0.0 | 0.0 | 136.2 |
Table text extracted from the original PDF; superscript letters are shown inline. The original table image is below.
View original table image
| Autumn | — | — | Winter | — | — | Spring | — | — | Summer | — | — | Annual Total |
|---|---|---|---|---|---|---|---|---|---|---|---|---|
| September | October | November | December | January | February | March | April | May | June | July | August | |
| 0.2 | 0.3 | 0.6 | 1.6 | 1.6 | 0.6 | 0.3 | 0.5 | 0.3 | 0.0 | 0.0 | 0.0 | 0.50 |
Table text extracted from the original PDF; superscript letters are shown inline. The original table image is below.
View original table image
| Data | Autumn | — | — | Winter | — | — | Spring | — | — | Summer | — | — |
|---|---|---|---|---|---|---|---|---|---|---|---|---|
| September | October | November | December | January | February | March | April | May | June | July | August | |
| Dust Storm | 0.8 | 0.6 | 0.4 | 0.3 | 0.2 | 0.8 | 1.4 | 1.5 | 2.9 | 3.9 | 3.7 | 2.6 |
| Rising dust | 4.9 | 5.7 | 3.0 | 3.1 | 3.6 | 2.8 | 8.4 | 10.8 | 13.4 | 18.7 | 18.5 | 15.2 |
| Suspended dust | 11.8 | 14.2 | 7.1 | 6.2 | 4.7 | 10.8 | 13.4 | 17.5 | 19.3 | 19.8 | 20.9 | 20.6 |
Table text extracted from the original PDF; superscript letters are shown inline. The original table image is below.
View original table image
| Autumn | — | — | Winter | — | — | Spring | — | — | Summer | — | — | Annual Total |
|---|---|---|---|---|---|---|---|---|---|---|---|---|
| September | October | November | December | January | February | March | April | May | June | July | August | |
| 27.6 | 39.8 | 56.4 | 66.8 | 70.2 | 55.5 | 45.9 | 41.2 | 30.1 | 21.3 | 20.1 | 21.4 | 41.35 |
Table text extracted from the original PDF; superscript letters are shown inline. The original table image is below.
View original table image
References
14 in the original paper- Al-Waeli AAK. Foundations and principles in weather and climate science. 2nd ed. Baghdad: Ahmed AlDabbagh Press; 2018.
- Al-Musawi AST. Geography of weather and climate. Najaf: Dar Al-Diaa for Printing and Publishing; 2009.
- Hassan AWA, Al-Waeli AAK. The spatial and temporal variation of the concentration of gaseous pollutants in the air of Al-Waziriya region. Res Militaris. 2022;12(2):Summer-Autumn.
- Karbel AIR, Wali MAS. Weather and climate science. Basra: College of Arts, University of Basra; 1986.
- Al-Najjar BMD, Al-Waeli AA. Studying the frequencies of the monthly middle-level cloud cover (CM) in Iraq. Psychol Educ. 2021;58(3):5447-5460.
- Mawed KM. Weather and climate. Scientific Knowledge Series. Beirut: Arab League Educational, Cultural and Scientific Organization; 2011.
- Shehadeh N. Climatology. 1st ed. Amman: Dar Safa for Printing, Publishing and Distribution; 2009.
- Republic of Iraq, Ministry of Planning, Central Bureau of Statistics. Annual statistical collection for 2007. Baghdad: Central Bureau of Statistics Press; 2007.
- Republic of Iraq, Ministry of Water Resources, Directorate General of Survey. Administrative map of Iraq for 2021. Scale 1:250,000. Baghdad: Directorate General of Survey; 2021.
- Republic of Iraq, Ministry of Transport, Iraqi General Authority for Meteorology and Seismic Monitoring, Climate Section. Unpublished climatic data. Baghdad; 2023.
- Samhan SA, Al-Wadi MH. Principles of statistics for economics and administrative sciences. 1st ed. Zarqa: Zarqa Private University; 2010.
- Issa SM. Climatic geography. Amman: Arab Society Library for Publishing and Distribution; 2006.
- Al-Rawi SM, Al-Bayati AH. Foundations of climatology. Mosul: Dar Al-Kutub for Printing and Publishing, University of Mosul; 2001.
- Tony Y. Dictionary of geographical terms. Cairo: Dar Al-Fikr Al-Arabi for Printing and Publishing; 1977.